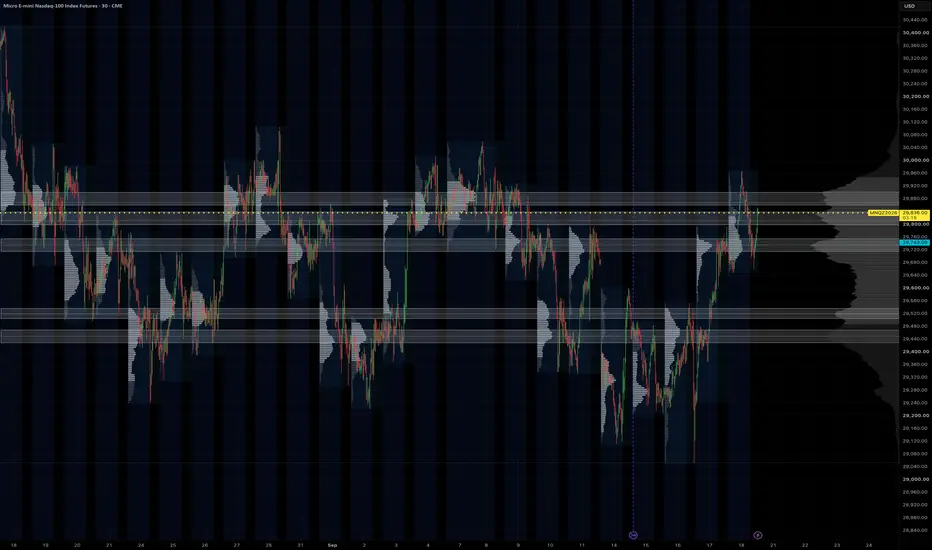
DiNapoli Levels Confluence Targets [MarkitTick]💡 This script automates the complete DiNapoli-style Fibonacci workflow on any symbol and timeframe: it locates confirmed swing pivots, measures the resulting impulse leg, selects an appropriate Fibonacci retracement entry from that leg, projects a three-tier set of Fibonacci profit objectives from the pullback point, cross-checks a second independent swing for confluence, filters everything through a displaced-average trend context, and then tracks the resulting trade in real time through on-chart levels and a live dashboard.
Rather than requiring a trader to manually draw retracement and expansion tools on every fresh swing, cross-reference two different Fibonacci grids by eye, and mentally track a displaced moving average's bias, the script performs all of that detection, labeling, and state-tracking automatically, and exposes the resulting signals through webhook-ready alert payloads for automation.
✨ Originality and Utility
This is not a rehash of a single built-in Pine tool or a simple retracement drawing utility. It implements the full, interdependent DiNapoli Levels sequence as one coherent system, where each stage consumes the output of the previous one:
Confirmed fractal pivot detection builds the swing skeleton the entire tool depends on.
The most recent three-to-five pivots are used to define both a primary swing (for entries and objectives) and a secondary, older swing (used only for confluence cross-checking).
Retracement depth of the pullback determines which of two Fibonacci entry levels is actually referenced, rather than relying on a single fixed ratio for every setup.
Profit objectives are geometric extensions of the very same swing used to derive the entry, not independent, arbitrarily chosen levels.
The displaced-average trend filter, ATR-based stop, and confluence check all read from the same pivot/swing state, so removing any one of them would break the internal logic rather than simply "simplify" the script.
Because the entry, stop, and all three objectives are all mathematically derived from the same confirmed swing, the tool gives traders a single, internally consistent read on a setup instead of several disconnected indicators layered on top of one another. The value is in the integration and automation of a documented, multi-step methodology, the live tracking of trade state once a signal fires, and the structured webhook output for downstream automation — not in inventing a new mathematical formula.
🔬 Methodology and Concepts
• Pivot and Swing Detection
Swing highs and lows are identified using a standard confirmed-fractal method: a candidate high (or low) is only accepted once it is verified to be the extreme point across a window of Pivot Left bars before it and Pivot Right bars after it. Confirmed pivots are stored in a rolling, alternating high/low sequence (capped at the eight most recent) that forms the script's live market-structure map.
• Swing Classification
The three most recent pivots are labeled, oldest to newest, A, B, and C. A bullish structure requires the sequence low → high → low (A low, B high, C low), representing an upward impulse leg from A to B followed by a pullback into C. A bearish structure is the mirror image. The distance from A to B defines the primary swing used for every subsequent calculation.
• Retracement Measurement
The pullback's depth is expressed as a percentage of the A–B swing: how far price has travelled back from B toward A by the time pivot C is confirmed. This retracement percentage drives both setup validity and entry-level selection.
• Fibonacci Retracement Entry Zone
Two retracement levels of the A–B swing are calculated, at 38.2% and 61.8%. If the confirmed pullback has already reached 61.8% or deeper, the script references the 61.8% level as the entry; otherwise it references the shallower 38.2% level. This dynamic selection reflects the idea that the appropriate entry reference depends on how deep the actual retracement has gone, rather than committing to one ratio for every swing.
• Fibonacci Objective Targets
Three profit objectives are projected from pivot C using the primary swing magnitude, following the classic three-tier DiNapoli objective-point structure:
COP (Contracted Objective Point) — C plus 0.618 times the swing.
OP (Objective Point) — C plus 1.000 times the swing.
XOP (Expanded Objective Point) — C plus 1.618 times the swing.
These represent successively less conservative price projections derived from the same impulse leg used for the entry.
• Setup Validation
A setup is only considered valid when all of the following hold: the alternating high/low pattern is intact, the retracement sits between 38.2% and the user-defined Max Retrace ceiling (filters out pullbacks that have gone too deep to be a valid retracement), the swing's magnitude is at least the Min Swing × ATR threshold (filters out insignificant, noise-driven swings), the swing direction is consistent with the claimed bias, the trend filter (if enabled) agrees, and a confluence zone exists (if Confluence Required is enabled).
• Dual-Swing Confluence Detection
A second, independent swing is measured from an older pivot (A2) to B, and the same 38.2%/61.8% retracement math is applied to it. The script then compares all four combinations of the primary and secondary retracement levels and, if the two closest levels fall within Confluence Tolerance × ATR of each other, marks the midpoint between them as a confluence zone. This reflects agreement between two independently measured Fibonacci grids rather than a single grid taken in isolation, which is the basis of the confluence concept in DiNapoli's original methodology.
• Displaced Moving Average Trend Filter
A short simple moving average (DMA Length) is calculated, and the internal trend comparison uses that average's value from DMA Displace bars earlier, effectively lagging the filter by that many bars. The same average is plotted on the chart with a forward visual offset equal to the same displacement, so the line drawn on the chart lines up with the value actually being compared against price. When enabled, only setups where price sits on the correct side of this displaced average are accepted.
• Stop and Objective Placement Logic
The stop is placed a user-defined multiple of ATR beyond pivot C, giving the stop room proportional to the instrument's own recent volatility rather than a fixed distance. All targets are recalculated fresh each time a new, valid setup fires and remain fixed for the life of that trade.
• Signal Firing and State Tracking
A new signal fires only on a confirmed (closed) bar, and only once per underlying pivot, preventing duplicate or repeated firing on the same structure. Once fired, the script tracks live high/low crosses against the stop and each objective; a stop hit takes priority over a same-bar target hit, and each hit updates the relevant level's on-chart label and color permanently for that trade. The Lock Signal input can freeze the presently tracked setup on the real-time bar so that a fresh pivot does not override an open position mid-trade.
⏱️ Confirmation Lag Notice
Because a pivot cannot be confirmed until Pivot Right bars have elapsed past it, both the pivot itself and any signal built from it only become visible on the chart after that many bars have passed — the resulting lines and labels are drawn retroactively onto a swing that has already formed. This is a structural characteristic of any confirmed-pivot Fibonacci tool rather than a flaw, but it does mean a signal never appears exactly at the live turning point; it appears with a short, deliberate confirmation delay.
The script contains no request.security() calls and references no higher-timeframe or future data, so outside of this inherent pivot-confirmation delay there is no forward-looking bias in the setup logic. Entry signals fire only on confirmed, closed bars, and once a signal and its levels are drawn they do not later shift to a different bar or disappear — they are only replaced outright when a new, opposite setup fires.
The DMA line's forward visual offset is a display convention matching the traditional presentation of a displaced moving average: the values plotted are ordinary trailing averages, simply drawn shifted to the right so the line visually tracks price with the same lag the trend filter itself uses internally. It is not a projection or forecast of future price.
🎨 Visual Guide
• Trade Level Lines and Labels
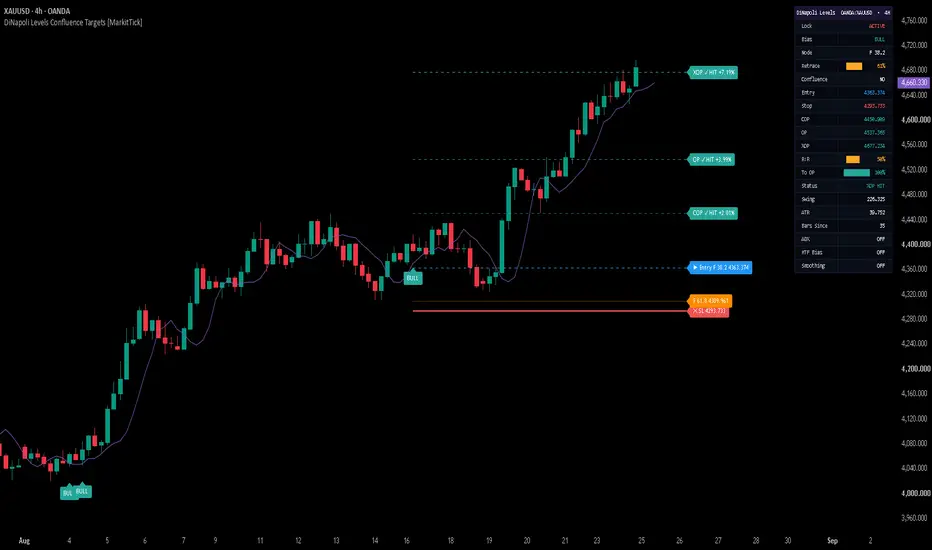
When a setup fires, five horizontal lines and their accompanying labels extend from the signal bar: the Stop (solid, thicker line), Entry (dashed), and the COP, OP and XOP objectives (dashed, drawn in progressively fuller shades of the same bullish or bearish color to reflect their increasing distance). All five lines automatically extend to the current bar while the trade remains open, and extend up to the closing bar once the trade is stopped out or reaches XOP.
• Fibonacci Node Reference Line
A dotted line marks whichever of the two retracement levels (38.2% or 61.8%) was not selected as the entry, shown for reference so the alternate level remains visible alongside the chosen one.
• Confluence Line
When a confluence zone is detected and the Confluence Line option is enabled, a dashed line marks the midpoint between the two agreeing Fibonacci levels from the primary and secondary swing grids.
• Merged Labels
When two or more levels land at the same price, their labels are merged into a single combined label (separated by a middle dot) instead of stacking overlapping duplicate labels, keeping the chart readable.
• Signal Markers
A "BULL" or "BEAR" label is plotted at the low or high of the firing bar respectively, colored to match the configured bullish or bearish color.
• Displaced Moving Average Line
The DMA is plotted in its configured color, shifted forward on the chart by the DMA Displace setting, matching the internal trend-filter reference described above.
• Live Dashboard Table
An on-chart table (position configurable to any corner) shows, row by row: symbol and timeframe, Lock status, current bias, which Fibonacci node is active, retracement depth as a ten-block progress bar with percentage, whether confluence was present, the Entry/Stop/COP/OP/XOP price levels, risk-to-reward expressed as a block bar scaled to 5R, progress toward OP as a block bar, current trade status (open, or which level was hit), the swing size, the current ATR value, and the number of bars elapsed since the last signal.
📖 How to Use
Wait for a "BULL" or "BEAR" marker and its accompanying level lines to appear; remember these will appear with the short pivot-confirmation delay described above rather than exactly at the swing extreme.
On a bullish setup, price will already be sitting in the retracement zone of the prior up-leg; the Entry line marks the DiNapoli-selected reference level, the Stop sits an ATR-buffered distance beyond the swing low, and COP/OP/XOP are staged, increasingly distant profit levels. Bearish setups mirror this on the downside.
Enable Confluence Required to restrict signals to setups where two independently measured Fibonacci grids agree — this produces fewer but more selectively filtered setups.
Leave the DMA Filter enabled to only take setups aligned with the displaced-average trend context, or disable it to see every structurally valid swing regardless of that bias.
Use Lock Signal on the real-time bar if you are already in a tracked trade and do not want a newly forming pivot to override the current levels mid-position.
Watch the dashboard's Status row and block-bar visualizations for a fast read of retracement depth, risk-to-reward, and progress toward the OP objective without needing to read exact prices.
Configure the Alerts group's action strings to match the JSON keys your webhook or automation platform expects, then use TradingView's "Any alert() function call" option to route long, short, close, objective-hit, and stop-hit events.
Treat the Stop, COP, OP and XOP levels as a structured framework for planning risk and staged exits, not as a guarantee that price will reach any particular level — always size positions according to your own risk tolerance.
⚙️ Inputs and Settings
• Core
Pivot Left / Pivot Right — number of bars required on each side of a candidate swing point before it is confirmed; larger values confirm more significant but slower-appearing swings.
Min Swing × ATR — minimum size, in ATR multiples, an A–B swing must have to be considered valid, filtering out noise-sized structures.
Max Retrace — the deepest retracement (as a fraction of the swing) still accepted as a valid pullback.
ATR Len — lookback period for the Average True Range used throughout the stop, minimum-swing, and confluence-tolerance calculations.
• Filters
DMA Filter — toggles the displaced-average trend requirement on entries.
DMA Len / DMA Displace — period and forward displacement of the trend-filter average.
Confluence Required — toggles whether a confluence zone is mandatory for a setup to fire.
Confluence Tol × ATR — maximum distance, in ATR multiples, between two Fibonacci levels for them to be treated as confluent.
• Trade Tools
Lock Signal — freezes the currently tracked setup on the real-time bar, blocking new signals from overriding it.
Stop Buffer × ATR — distance, in ATR multiples, the stop is placed beyond pivot C.
• Visuals
Fibnodes — shows or hides the unused Fibonacci reference node line.
Confluence Line — shows or hides the confluence-zone line.
Signal Markers — shows or hides the BULL/BEAR labels.
DMA Line — shows or hides the displaced moving average plot.
• Dashboard
Show Dashboard — toggles the on-chart table.
Position — selects which chart corner hosts the dashboard.
• Alerts
Long / Short Action, Close Long / Close Short Action — the "action" values sent in the JSON payload for entries and exits.
COP / OP / XOP Action, Stop Action — the "action" values sent when each objective or the stop is hit.
• Colors
Individual color controls are provided for the bullish and bearish themes, stop, entry, each of the three objectives, both Fibonacci nodes, the confluence line, the DMA line, label text, the dashboard's three-tier progress-bar shading, and the dashboard's header, background, and text colors, allowing the full visual theme to be adapted to any chart background.
🔍 Deconstruction of the Underlying Scientific and Academic Framework
The core methodology follows Joe DiNapoli's published approach from "Trading with DiNapoli Levels" (1998), which combines a displaced moving average for trend context with Fibonacci retracement levels for entry timing and a three-tier set of Fibonacci expansion objectives — the Contracted, standard, and Expanded Objective Points — for profit projection. The script's DMA filter and COP/OP/XOP target structure are direct implementations of that framework.
The use of Fibonacci ratios in price analysis traces back to the Fibonacci sequence itself (Leonardo of Pisa, 13th century) and its adoption into market analysis through Ralph Nelson Elliott's wave theory and W.D. Gann's work on proportional price relationships, later formalized by DiNapoli into a discrete, rules-based entry and objective framework.
Swing-point identification via a confirmed left/right bar window reflects the standard swing-high/swing-low definition used broadly across technical analysis, closely related to the fractal concept popularized by Bill Williams, and provides an objective, repeatable substitute for discretionary chart reading.
Average True Range, developed by J. Welles Wilder, supplies the volatility-normalized basis for the stop distance and minimum-swing filter, allowing the same input values to scale automatically across instruments and volatility regimes rather than relying on fixed point or pip distances.
The confluence-detection logic reflects the broader "cluster" or "confluence zone" concept found throughout Fibonacci-based technical analysis: treating agreement between two independently derived retracement grids as a stronger signal than either grid considered alone, a filtering approach explicitly discussed within DiNapoli's own writings on Fibonacci analysis.
⚠️ Disclaimer
All provided scripts and indicators are strictly for educational exploration and must not be interpreted as financial advice or a recommendation to execute trades. We expressly disclaim all liability for any financial losses or damages that may result, directly or indirectly, from the reliance on or application of these tools. Market participation carries inherent risk where past performance never guarantees future returns, leaving all investment decisions and due diligence solely at your own discretion.
Chỉ báo