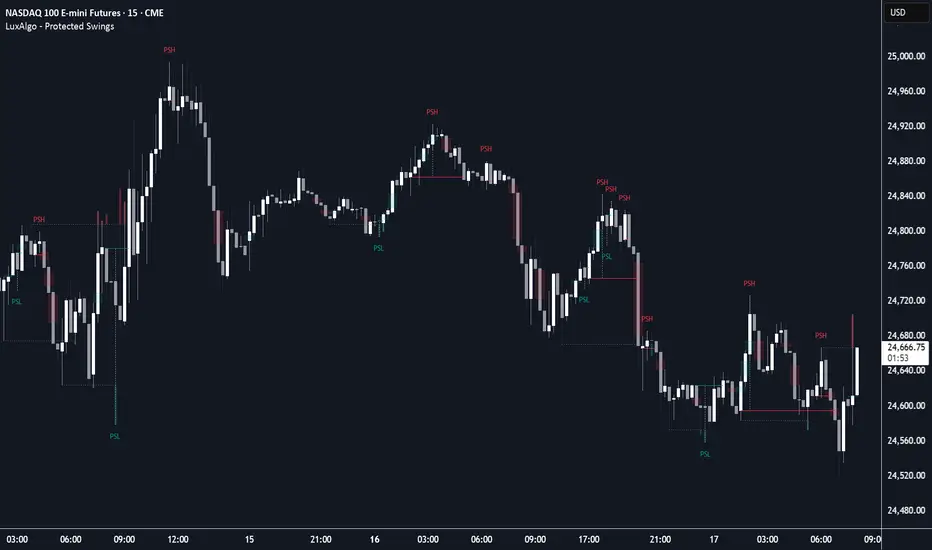
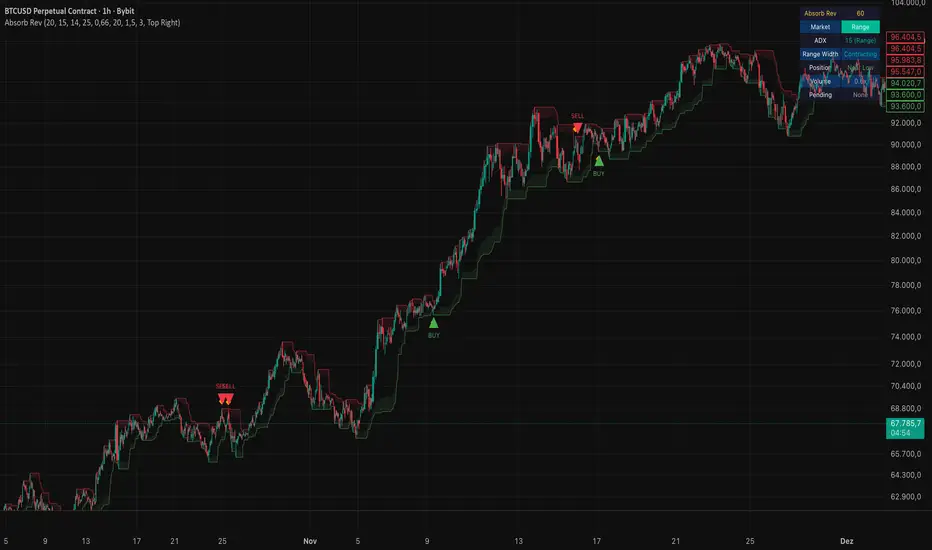
Failed 2 Evaluator v2.2-Failed 2 Evaluator & Continuation EngineDescription:
The Failed 2 Evaluator & Continuation Engine is an objective price-action analysis tool designed to categorize, visualize, and statistically track how Failed 2 candles behave when interacting with key market levels.
This indicator evaluates whether a breach of a level results in price expansion, choppy price action, or a strict structural failure (a "Failed 2" in Strat terminology), providing traders with a quantitative view of historical follow-through.
How It Is Calculated
The script operates in three distinct phases:
1. Level Generation & Trigger
The indicator establishes boundaries using either auto-calculated Pivot Highs/Lows (with user-defined left/right lengths) or manually inputted price levels. The evaluation sequence is triggered the moment a candle's total range (wick) physically breaches one of these active levels.
2. Strict Outcome Evaluation (On Close)
Once the triggering candle closes, the script strictly categorizes the outcome into one of three buckets:
Breakout/Breakdown Expansion: The candle successfully closes outside the breached level, indicating a continuation of the break.
Strict Failed 2 (F2U / F2D): The candle breaches the level but immediately reverses, failing to hold the extreme. To qualify as a true Failed 2, the script enforces a strict structural rule: the candle must close back inside the level and must be a directional reversal candle (e.g., an F2U requires the close to be below the level and below its own open).
Neutral Reclaim (Chop): The candle breaches the level and falls back inside, but fails the strict color/directional logic of a true Failed 2.
3. The Continuation Engine
When a strict Failed 2 is confirmed, the script activates a forward-looking continuation tracker. It records the closing price of the Failed 2 candle and waits a user-defined number of bars (e.g., 3 bars). It then checks if the price at that future bar successfully continued in the direction of the reversal, logging the historical frequency of structural follow-through.
Dashboard Features & Chart Visuals
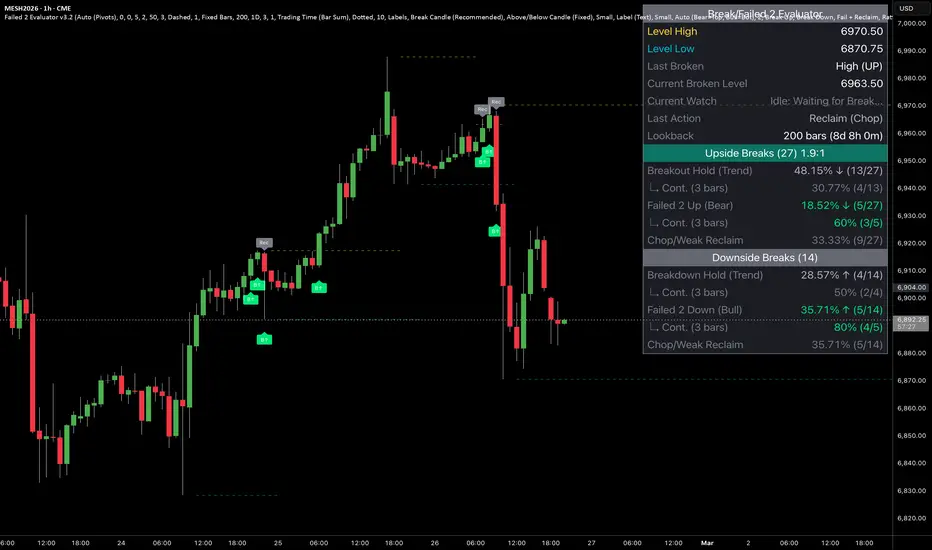
Real-Time Watcher: A dynamic table row alerts the user when a live, unconfirmed candle is actively testing a level, prompting observation for either a Continuation or a Failed 2.
Historical Distribution: The dashboard calculates the exact percentage breakdown of Expansions, True Failed 2s, and Chop over a user-defined lookback window.
Chart Markers: Clean, unobtrusive visual tags pinpoint exactly where Breaks (B↑/B↓) and True Reversals (F2U/F2D) occurred on the chart for easy visual backtesting.
Analytical Purpose
The primary benefit of this tool is the removal of emotional bias and subjectivity from "false breakout" analysis. By rigidly defining what constitutes a failed move and statistically tracking its historical continuation rate, this indicator allows analysts to quantify an asset's unique behavior at range extremes. It transforms abstract price action theories into measurable, observable data.
Chỉ báo