Buy/Sell Signals [WynTrader]Buy/Sell Signals
Hello dear Friend
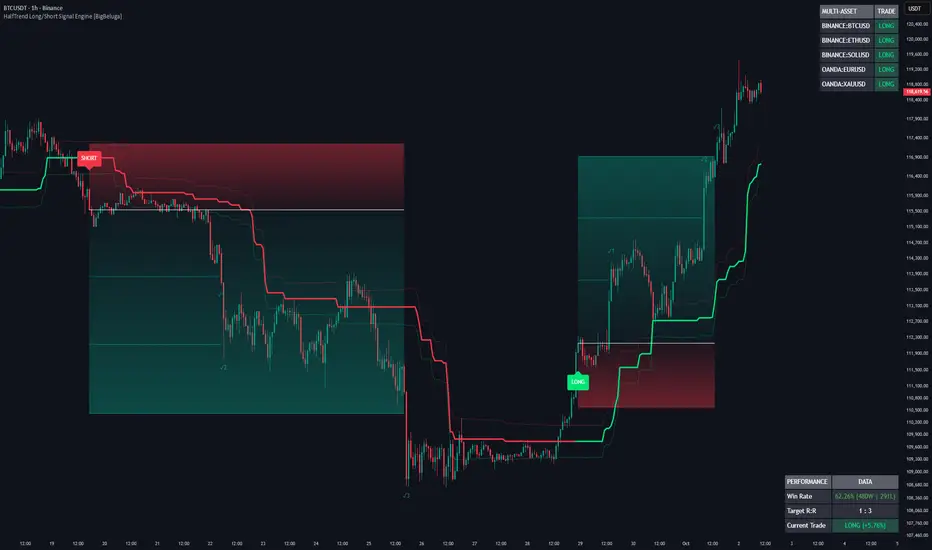
Here is my Buy/Sell Signals indicator that may help you easily run a Buy/Sell backtest Strategy, seeing, at a glance, performance results.
█ OVERVIEW
This indicator identifies trend changes and generates Buy/Sell signals as accurately as possible. Its strength lies in the results Table, which lets you evaluate signal performance directly on the chart — compared to a simple Buy & Hold strategy — without running a full backtest.
█ CONCEPTS
This Buy/Sell Signals , compared to other tools that detect trend shifts, is simple, easy to use, and demonstrates its efficiency on its own, at a glance.
The Table results allow you to quickly evaluate signal performance, both on their own and compared to a Buy & Hold strategy. The Table calculations are fully s ynchronized with the visible chart (WYSIWYG – What You See Is What You Get). You can also scroll the chart across different date ranges to see how a stock or product performs under various market conditions.
You can adjust the variables to suit your goals. The design is simple, with clear parameters and instant readability of Buy/Sell Signals on the chart and in the Table results, without complex interpretation needed.
A Table shows the effectiveness of the signals on the current visible chart, providing immediate, realistic feedback performance. The Buy & Hold strategy results are also included for comparison with the Buy/Sell swing strategy. The Buy & Hold results start from the first Buy signal to ensure a fair comparison. Changing the parameters instantly updates the Table, giving a quick, immediate performance check.
█ FILTERS (Buy/Sell parameters)
This indicator generates Buy/Sell signals using optional and adjustable filters:
- Bollinger Bands Lookback Trend Filter
- High-Low vs Candle Range Threshold %
- Distance from Fast and Slow MAs Threshold %
Results are displayed in a Table on the chart, based on the currently visible start and end dates.
█ TABLE RESULTS (Buy/Sell signals performance)
The Results Calculation presented in the Table is based on the Current Chart Visible Range . The Table shows the:
- Calculation Results of the Buy and Sell Signals activated on the chart
- Number of Trades (Signals)
- Winning Points
- Win Rate %
The Buy & Hold calculation starts at the first Buy encountered.
█ CAUTION
The Graal Indicator, even with AI, doesn't exist yet — maybe one day, but not now — depending on the chart product, volatility, probabilities, and unpredictable market behaviour. Don't rely on this tool to make trade decision, it's only a tool to, maybe, help assess a change of trend.
Seeing Buy/Sell signals on a chart is appealing, but assessing their performance in a Table makes it even more convincing — and without running a full backtest, you get a clear overview of performance immediately.
█ WYNTRADER
My name is WynTrader. I cumulate 24 years of experience. In 2001, I took an intensive technical analysis course taught by an exceptional friend, Cyril, who taught me everything I know.
After testing thousands of TradingView indicators over these 24 years, I've found none to be 100% accurate all the time. This Buy/Sell Signals indicator may outperform some others but is still not perfect. So, just be aware, and don't be fooled by this tool.
Enjoy!
WynTrader
Chỉ báo