Chart Structure & Price Action JINDALSTELTrend Flip & Re-Test: Following a multi-month decline from the top (~1,300–1,400 zone) down toward the low near 980–1,020, the price bounced back to reclaim the Supertrend indicator (green shaded support area at 1,049.0). The price action shows a breakout above initial resistance followed by a downward pull to re-test the trend line before attempting a higher-high move.
Momentum Oscillator: The lower pane shows Williams %R (26) breaking above its lower downtrend line with an annotated "Early-stage bullish momentum" signal sitting near -60.18, suggesting that oversold conditions have cleared and bullish momentum is recovering.
Key Levels Annotated:
Current Price: ~1,126.0
Buy Level: Above 1,153.2 – 1,164.5
Stop Loss: 1,118.0 (Conservative) / 1,084.1 / 1,049.0 (Weekly low / Supertrend level)
Target 1: 1,164.5 / 1,196.4
Target 2: 1,196.4
Target 3: 1,244.1
Confirmation Needed: Entry is contingent on price sustaining above the 1,153.2–1,164.5 region to confirm that the trend re-test holds.
Risk Management: A breach below 1,084.1 invalids the bullish swing bias, sending price back into the Supertrend support zone at 1,049.0.
Disclaimer: aliceblueonline.com Chart Structure & Price Action JINDALSTELTrend Flip & Re-Test: Following a multi-month decline from the top (~1,300–1,400 zone) down toward the low near 980–1,020, the price bounced back to reclaim the Supertrend indicator (green shaded support area at 1,049.0). The price action shows a breakout above initial resistance followed by a downward pull to re-test the trend line before attempting a higher-high move.
Momentum Oscillator: The lower pane shows Williams %R (26) breaking above its lower downtrend line with an annotated "Early-stage bullish momentum" signal sitting near -60.18, suggesting that oversold conditions have cleared and bullish momentum is recovering.
Key Levels Annotated:
Current Price: ~1,126.0
Buy Level: Above 1,153.2 – 1,164.5
Stop Loss: 1,118.0 (Conservative) / 1,084.1 / 1,049.0 (Weekly low / Supertrend level)
Target 1: 1,164.5 / 1,196.4
Target 2: 1,196.4
Target 3: 1,244.1
Confirmation Needed: Entry is contingent on price sustaining above the 1,153.2–1,164.5 region to confirm that the trend re-test holds.
Risk Management: A breach below 1,084.1 invalids the bullish swing bias, sending price back into the Supertrend support zone at 1,049.0.
Disclaimer: aliceblueonline.com JSW Infra: Fundamentals Meet a Breakout SetupJSW Infrastructure continues to build a strong long-term growth profile through expansion of its port, cargo-handling and logistics operations. The company has also been strengthening its balance sheet to support its expansion plans, while institutional participation has increased significantly.
Fundamental Analysis
JSW Infrastructure operates in an asset-intensive industry with high entry barriers, and its financial profile reflects the benefits of scale. The company currently maintains an operating profit margin of around 48% and a net profit margin of approximately 27%. ROE stands around 14%, while ROCE is approximately 12.7%, indicating that the business continues to generate reasonable returns on the capital employed.
The long-term growth record is notable. The company's five-year net profit growth is above 400%, while operating cash flow has also increased substantially over the same period. Revenue growth remains healthy, supported by increasing cargo volumes and capacity expansion.
The latest operating numbers remain constructive. Q1 FY27 cargo volume increased to approximately 31 MT from 29.4 MT YoY, while revenue from operations increased to around ₹1,208 crore from ₹1,086 crore in the corresponding period. Operating EBITDA increased to approximately ₹601 crore, although the EBITDA margin moderated to around 49.8%.
The recent earnings picture is therefore mixed: operational growth remains intact, but PAT growth has temporarily lagged revenue and operating-profit growth.
Balance Sheet
JSW Infrastructure's leverage remains manageable. Total debt-to-equity is around 0.59x, while long-term debt-to-equity is approximately 0.55x. Interest coverage is around 7.7x, providing a reasonable cushion against interest costs.
The company's FY26 net debt-to-equity was approximately 0.27x, while net debt to operating EBITDA was around 1.19x. These levels indicate that the company has taken on additional debt for expansion, but leverage remains within a manageable range.
The company also raised approximately ₹6,555 crore through a QIP in June 2026, providing additional capital for future expansion.
Institutional Holding
One of the most notable developments in the fundamental story is the sharp increase in institutional ownership.
Institutional holding increased from approximately 9.4% in March 2026 to 20.4% in June 2026.
Within this:
FII holding: 6.9% → 11.2%
Mutual Fund holding: 2.1% → 8.7%
DII holding: approximately 2.5% → 9.2%
This represents a substantial increase in institutional participation.
Promoter holding declined from approximately 83.6% to 73.9% during the same period. However, this change needs to be viewed alongside the June 2026 QIP and the resulting increase in the company's equity base rather than being interpreted simply as promoter selling.
Valuation
The major fundamental consideration is valuation.
JSW Infrastructure trades at approximately 51x trailing earnings, around 6.7x book value, with EV/EBITDA in the high-teens. These ratios indicate that the market is assigning a significant premium to the company's future growth prospects.
Therefore, the fundamental equation is clear:
Strong business growth + improving institutional participation + manageable leverage
versus
Premium valuation + recent moderation in PAT growth.
For the valuation to remain supported over the longer term, continued revenue growth, improving earnings, disciplined capital allocation and healthy returns on incremental capital will be important
Technical Analysis
The long-term daily chart presents an interesting Cup & Handle formation.
The stock recovered from the ₹220–₹250 region and gradually moved back toward the ₹350–₹360 area, forming the cup. The subsequent consolidation around the ₹310–₹360 region represents the handle portion of the pattern.
The stock closed around ₹348.25 on September 18, 2026, after trading as high as approximately ₹356.25, with volume of around 25.41 million shares.
The price is therefore approaching an important long-term resistance zone.
Key Technical Levels
The chart identifies ₹350–₹367 as the major yearly resistance region.
Resistance
₹367 — Major breakout level
A sustained daily close above ₹367 would represent a breakout from the major resistance zone and would provide technical confirmation of the Cup & Handle structure.
The next chart-based resistance levels are:
₹396 → ₹420 → ₹465
These represent the successive upside levels marked on the chart.
Support / Reversal Zone
The ₹310–₹330 region is the key reversal and support zone.
This area becomes important because it represents the lower boundary of the recent handle/consolidation structure.
A sustained breakdown below this zone would weaken the present Cup & Handle setup and indicate that the breakout structure requires reassessment.
Cup & Handle Structure
The technical structure can therefore be visualised as:
₹310–₹330 → Reversal / Support Zone
₹350–₹367 → Major Resistance / Breakout Zone
₹367 → Breakout Confirmation
₹396 → First Major Resistance
₹420 → Next Resistance
₹465 → Higher Resistance
The most important technical confirmation would come from a sustained close above ₹367 accompanied by strong volume and improving momentum indicators.
Conclusion
JSW Infrastructure presents an interesting techno-fundamental setup. Fundamentally, the company has strong operating margins, substantial long-term earnings growth, manageable leverage and a significant increase in institutional participation. The QIP has also strengthened the capital base for future expansion.
At the same time, the valuation remains demanding, while recent PAT growth has moderated. Therefore, future earnings growth will be important in validating the current valuation.
Technically, the stock has developed a large Cup & Handle structure and is approaching the crucial ₹350–₹367 yearly resistance zone. Momentum indicators such as RSI, MACD and ADX should be monitored alongside volume for confirmation.
The key technical trigger remains ₹367. A sustained breakout above this level would place ₹396, ₹420 and ₹465 as the next chart-based resistance levels, while ₹310–₹330 remains the major structural support/reversal zone.
Disclaimer: aliceblueonline.com APARINDS - Pole & Flag BreakoutAPAR Industries is one of India's largest manufacturers of conductors, cables, and specialty transformer oils — a direct beneficiary of India's accelerating power transmission and grid modernisation capex cycle.
📊 Key Numbers (TTM / Latest):
Revenue: ₹24,389 Cr (+24% YoY)
Net Profit: ₹1,182 Cr (+34% YoY)
Q1 FY27 PAT: ₹467 Cr (+77.8% YoY) ← accelerating
ROCE: ~29.8% | ROE: ~18.1%
Operating Margin: 8.85% (expanding)
Conductor Order Book: ₹10,190 Cr (strong revenue visibility)
💰 Valuation:
TTM P/E: ~63x (elevated vs. 5Y avg of ~37x)
PEG: ~1.9x — growth is priced in, but earnings trajectory justifies the premium
🏦 Ownership (Constructive):
Promoter: 55.42% | Zero Pledge ✅
Mutual Funds: 22.28% (+2.76% YoY)
FII: 11.36% (+2.30% YoY) — rising
Total Institutional: 36.24% (+5.4pp YoY) — smart money accumulating
⚠️ Risk: High valuation leaves little room for an earnings miss. Monitor operating cash flow vs. profit growth and working capital as scale increases.
📈 TECHNICAL SETUP — Daily Chart
Pattern: Pole & Flag (Bullish Continuation)
CMP: ₹18,858 | +5.94% breakout today on elevated volume (271.8K)
The stock formed a strong impulse pole in late July–early August, followed by a consolidating flag channel drifting slightly lower through August–September. Today's breakout above the upper flag boundary on high volume is the confirmation signal.
🎯 Targets:
R1: ₹20,000 (first resistance / round number)
R2: ₹21,150 (prior swing resistance)
R3: ₹23,130 (pole projection / extended target)
🛡️ Support & Stop:
Flag Base / Stop Loss: ₹17,075
Reversal Zone (strong demand): ₹16,015 – ₹17,075
Invalidation: Sustained close below ₹16,015
🔑 SUMMARY
Fundamentally strong business (ROCE ~30%, PAT +77% in Q1 FY27, rising institutional ownership) breaking out technically from a classic Pole & Flag on strong volume. The convergence of quality fundamentals and a clean chart setup makes this a high-conviction idea for positional traders.
Watch ₹20,000 closely — how price reacts at R1 will signal whether this breakout has legs for R2 and R3.
Disclaimer: aliceblueonline.com Laurus Labs: Momentum Meets GrowthLaurus Labs Ltd. is showing a strong combination of improving fundamentals and bullish price structure. The stock is trading around ₹1,887 in the chart shared, with a decisive move toward the ₹1,895 breakout level. A sustained close above this level could strengthen the bullish setup.
Fundamental Strength
Laurus Labs operates across API, formulations, CDMO and biotechnology, with CDMO becoming an increasingly important growth driver. FY26 was a strong turnaround year, with revenue rising 23% and profitability expanding sharply.
Key Financial Ratios
P/E: ~89–92x
P/B: ~17–18x
ROE: ~18%
ROCE: ~18–19%
Debt-to-Equity: ~0.45x
Net Debt/EBITDA: ~1.18x
Current Ratio: ~1.33x
Dividend Yield: ~0.1%
The ROE and ROCE recovery is a major positive, while debt-to-equity has improved significantly from previous years. However, the current valuation is demanding and leaves limited room for earnings disappointments.
Financial Performance
FY26 showed a significant improvement:
Revenue: ₹6,813 Cr — +23% YoY
EBITDA: ₹1,826 Cr — +64% YoY
EBITDA Margin: 26.8%
PAT: ₹889 Cr — +148% YoY
Operating Cash Flow: ₹1,624 Cr
Net Worth: ₹5,300 Cr
The improvement was driven by better business mix, CDMO growth, operating leverage and stronger utilisation of manufacturing assets.
Q1 FY27 Momentum
The latest quarter continued the positive trend:
Revenue: ₹2,026 Cr
EBITDA: ₹644 Cr
EBITDA Margin: 31.8%
This indicates that the margin expansion seen during FY26 has continued into FY27.
Balance Sheet & Financial Stability
Laurus Labs' balance sheet has strengthened considerably.
Net worth increased to ₹5,300 Cr from ₹4,473 Cr.
Debt-equity improved to 0.45x from 0.60x.
ROCE improved to 17.7% from 9.7%.
ROE improved to 17% from 8%.
Operating cash flow of ₹1,624 Cr provides strong internal funding capacity.
The company is also investing heavily in capacity expansion, with FY26 capex of ₹1,070 Cr, supporting future CDMO, peptide, fermentation and other high-value opportunities.
Technical Outlook
The chart shows a strong uptrend followed by a short consolidation. The latest candle is attempting to break above the ₹1,895 level.
Key Levels
📌 Current Price: ₹1,887
📌 Breakout Confirmation: Close above ₹1,895
📌 Resistance R1: ₹1,960
📌 Resistance R2: ₹2,015
📌 Resistance R3: ₹2,110
📌 Reversal Zone: ₹1,790–₹1,811
A sustained close above ₹1,895 could strengthen the breakout and bring ₹1,960 → ₹2,015 → ₹2,110 into focus.
The ₹1,790–₹1,811 reversal zone is the key support area to watch if the stock experiences a pullback.
Techno-Fundamental View
Bullish factors:
Strong FY26 revenue and PAT growth
Significant EBITDA margin expansion
CDMO business growing rapidly
ROE and ROCE recovery
Improving debt-equity ratio
Strong operating cash flow
Continued investment in high-value pharmaceutical capabilities
Positive Q1 FY27 momentum
Key concern:
Valuation is very demanding, with P/E around 90x and P/B around 18x at recent prices.
Fundamental Rating — Out of 5
Business Strength: 4.5/5
Financial Stability: 4.3/5
Profitability: 4.5/5
Growth Potential: 4.7/5
Valuation: 2.5/5
Overall Fundamental Rating: 4.1/5
Final View
Laurus Labs presents a strong techno-fundamental setup, backed by accelerating earnings, improving returns, stronger cash generation and a rapidly expanding CDMO franchise.
From the technical perspective, ₹1,895 is the key breakout trigger. A sustained close above it could open the path toward ₹1,960, ₹2,015 and ₹2,110.
₹1,790–₹1,811 remains the crucial reversal/support zone.
Overall View: Bullish above ₹1,895, but valuation remains the key risk.
ANISHFNK21
Follow
Disclaimer
The information and publications are not meant to be, and do not constitute, financial, investment, trading, or other types of advice or recommendations supplied or endorsed by TradingView. Read more in the Terms
Disclaimer: aliceblueonline.com Piramal Finance: Breakout Mode ON?Piramal Finance Ltd. is showing a strong technical setup after breaking above its recent ₹2,170–₹2,220 consolidation range. The stock is currently around ₹2,221, and the breakout comes against a backdrop of improving profitability, strong AUM growth and stable asset quality.
Fundamental Strength
Piramal Finance has been steadily transforming into a retail-focused NBFC. Its AUM crossed ₹1 lakh crore in FY26, while the growth portfolio accounted for 97% of total AUM. FY26 consolidated PAT increased 210% YoY to ₹1,506 crore, supported by stronger margins and improving operating efficiency.
Key Financial Ratios
P/E: ~29.5x
P/B: ~1.76x
ROE: ~5.5%
ROA: ~1.5%
Debt-to-Equity: ~2.86x
The valuation is no longer deeply discounted, but the improving earnings trajectory and quality of the loan book provide a reasonable growth story.
Latest Business Momentum
Q1 FY27 further strengthened the fundamental picture:
PAT: ₹461 crore, up 67% YoY
AUM: ~₹1.07 lakh crore, up 25% YoY
Retail AUM: ₹91,249 crore, up 32% YoY
Consolidated NIM: 6.5%
GNPA: 2.4%
NNPA: 1.6%
Retail disbursements increased 44% YoY.
The company has also received strong domestic debt ratings, with Crisil, ICRA and Care at AA+, while maintaining substantial liquidity.
Balance Sheet & Financial Stability
The balance sheet has expanded significantly, with shareholders' equity at about ₹28,191 crore in FY26. Total assets stood at roughly ₹1.11 lakh crore.
The key positive is the continued shift away from the legacy book toward the higher-growth retail franchise. However, leverage remains an inherent feature of the NBFC business, so asset quality and funding costs need to be monitored closely.
Technical Outlook
The chart shows a Range Breakout after several Days of consolidation.
Key Levels
📌 Breakout Range: ₹2,170–₹2,220
📌 Breakout Confirmation: Close above ₹2,277
📌 Resistance R1: ₹2,436
📌 Resistance R2: ₹2,574
📌 Reversal Zone: ₹2,035–₹2,080
A sustained close above ₹2,277 could strengthen the breakout and open the way toward ₹2,436 and ₹2,574. The ₹2,035–₹2,080 zone remains the key demand area during any meaningful correction.
Techno-Fundamental View
The setup combines:
Strong AUM growth
67% YoY Q1 FY27 PAT growth
Improving NIM
Stable asset quality
Increasing retail contribution
Stronger credit ratings
Range breakout on the technical chart
The primary risk remains valuation and leverage, particularly if credit costs or funding costs rise.
Fundamental Ratings — Out of 5
Business Strength: 4.3/5
Financial Stability: 4.2/5
Profitability: 4.0/5
Valuation: 3.7/5
Growth Potential: 4.5/5
Overall Fundamental Rating: 4.1/5
Investment View
Bullish above ₹2,277. Sustained price action above this level could bring ₹2,436 and ₹2,574 into focus.
On the downside, ₹2,035–₹2,080 remains the important reversal zone.
Conclusion: Piramal Finance is combining strong retail AUM growth, improving profitability and stable asset quality with a fresh technical breakout. A sustained move above ₹2,277 could signal the beginning of the next leg of the uptrend.
Disclaimer: aliceblueonline.com Kennametal's Rally Has More Fuel?Kennametal India Ltd. has entered a strong bullish phase after a sharp upmove from the ₹2,700–₹2,800 zone. The stock is currently around ₹3,527, and the chart structure continues to show strong momentum. The company’s latest financial performance also supports the bullish view, with FY26 revenue growth and improving profitability providing a solid fundamental backdrop.
Fundamental Strength
Kennametal India manufactures advanced cutting tools, hard-metal products and machine-tool solutions, serving industries including automotive, aerospace, defence, infrastructure and general engineering. It is a 75% subsidiary of Kennametal Inc.
Key Financial Ratios
P/E: ~45.8x
P/B: ~7.9x
ROE: ~13.9%
ROCE: ~19%
Dividend Yield: ~1.4%
EPS: ~₹63
Debt-to-Equity: Effectively zero / debt-free
The valuation is premium, but the company has a strong balance sheet and established industrial franchise.
Financial Performance
Kennametal India generated approximately ₹1,357 crore of TTM revenue and ₹139 crore of TTM net profit, with earnings showing strong improvement.
For FY25, revenue from operations was ₹1,170.3 crore and PBT was ₹140.2 crore. The company's FY26 quarterly numbers subsequently showed continued momentum, including strong March-quarter revenue of approximately ₹403 crore.
Balance Sheet & Stability
Debt-free balance sheet is a major positive.
Net worth remains strong relative to liabilities.
Operating cash flow has improved, with recent annual data showing approximately ₹144.8 crore of operating cash flow.
The company maintains a healthy dividend payout.
Strong parentage from Kennametal Inc. provides technological and global business support.
Technical Outlook
The chart shows a strong higher-high, higher-low structure, with the recent rally taking the stock sharply above its previous consolidation range.
Key Technical Levels
📌 Current Price: ₹3,513
📌 Reversal Zone: ₹3,094–₹3,304
📌 Resistance R1: ₹3,975
📌 Resistance R2: ₹4,597
📌 Resistance R3: ₹5,135
The ₹3,094–₹3,304 reversal zone is the key demand area. A sustained move above this zone keeps the bullish structure intact, while a decisive breakout above ₹3,975 could open the way toward the higher resistance levels.
Techno-Fundamental View
Kennametal India's setup combines:
Strong price momentum
Debt-free balance sheet
Improving earnings
ROCE around 19%
Established industrial and engineering franchise
Exposure to automotive, aerospace, defence and infrastructure
Consistent dividend distribution
The major concern is valuation. At around 45–46x earnings and nearly 8x book value, the stock is not cheap, so continued earnings growth will be important to justify further re-rating.
Fundamental Ratings — Out of 5
Business Strength: 4.5/5
Financial Stability: 4.7/5
Profitability: 4.0/5
Valuation: 3.2/5
Growth Potential: 4.2/5
Overall Fundamental Rating: 4.1/5
Techno-Fundamental View
Bullish above ₹3,304. A sustained move above ₹3,975 could strengthen the momentum and bring ₹4,597 and ₹5,135 into focus. On the downside, ₹3,094–₹3,304 remains the key reversal/accumulation zone.
Conclusion: Kennametal India presents a strong combination of technical momentum, debt-free financials and improving earnings, although its premium valuation warrants monitoring. If the current momentum sustains, the stock could remain on the radar for the next leg toward the projected resistance levels.
Disclaimer: aliceblueonline.com Time Technoplast: Breakout Brewing?Time Technoplast is a multinational polymer and composite products manufacturer, incorporated in 1992 and headquartered in Daman. The company is a leading global industrial packaging player, holding an estimated 55% market share in India's industrial packaging segment and ranking as the world's largest manufacturer of large-size plastic drums. It also claims to be India's first manufacturer of Type-IV composite cylinders (LPG/CNG/hydrogen), the world's second-largest composite cylinder producer, the second-largest MOX film maker in India, a major HDPE pipe manufacturer, and the third-largest Intermediate Bulk Container (IBC) producer globally, with market-leading positions in 9 of the 11 countries it operates in. Growth drivers include value-added product mix expansion, hydrogen/CNG cylinder demand, and capacity additions in packaging and pipes.
Key Financial Ratios (FY26 / TTM, Consolidated)
P/E: ~18.6x (TTM ~19.5x per some sources) — Neutral: trades below the small-cap plastics industry median (~33x), suggesting reasonable valuation
P/B: ~2.2x–2.3x — Neutral: moderate premium to book, in line with peer range
ROE: 13.4% (3-yr avg); ~13.8% latest annual — Neutral: improving but still below the 15%+ "strong" threshold
ROCE: 16.7%–17% — Positive: healthy and trending upward over the last 3 years
Debt-to-Equity: ~0.16–0.22 (Borrowings ₹733 Cr vs. Net worth ~₹4,088 Cr) — Positive: low leverage, comfortable balance sheet
Current Ratio: Not separately disclosed in available data — flagged as unclear rather than assumed
Operating Margin (OPM): ~14%–15% — Neutral: stable but not expanding meaningfully
Net Profit Margin: ~7.7% (FY26: ₹498 Cr TTM profit / ₹6,445 Cr TTM sales) — Positive: improving versus prior years
EPS (TTM): ₹9.50 (FY26) / ₹10.12 (TTM) — Positive: strong multi-year growth
Dividend Yield: ~0.82% — Neutral: modest, growth-reinvestment-oriented payout (~15–16% payout ratio)
Promoter Holding: 47.57%, down from ~51.6% a year ago — Concern: partly explained by an equity capital expansion (₹23 Cr → ₹49 Cr, likely a rights/preferential issue), but still worth monitoring
Financial Performance
Revenue growth: Consolidated sales have grown from ₹4,289 Cr (FY23) to ₹6,105 Cr (FY26), a 3-year CAGR of ~12% and a stronger TTM growth of ~16%.
EBITDA (Operating Profit) growth: Operating profit rose from ₹577 Cr (FY23) to ₹892 Cr (FY26), with OPM steady in the 13–15% band — margins are stable rather than expanding.
PAT growth: Net profit has scaled sharply from ₹224 Cr (FY23) to ₹477 Cr (FY26) — a 5-year CAGR of ~35%, though the 3-year CAGR is a more moderate ~29% and TTM growth has cooled to ~21%.
EPS trend: EPS has risen consistently from ₹4.84 (FY23) to ₹9.50 (FY26), aided partly by profit growth and partly by capital structure changes.
Operating cash flow (CFO): CFO was strong at ₹431 Cr in FY25 but fell to ₹233 Cr in FY26 (CFO/Operating Profit conversion dropped from ~70% to ~41%) — a point of caution despite the headline profit growth.
Free cash flow: Turned negative (–₹137 Cr) in FY26 versus +₹275 Cr in FY25, driven by a jump in capital expenditure/investing outflow (₹446 Cr) tied to capacity expansion.
Overall: Profitability is clearly improving on a multi-year view, but the FY26 dip in cash conversion and free cash flow is a near-term watch item that tempers an otherwise strong growth narrative.
Balance Sheet & Financial Stability
Total assets: ₹5,639 Cr (FY26), up from ₹4,399 Cr in FY25 — reflecting the recent equity raise and capex cycle.
Net worth: ~₹4,088 Cr (Equity capital ₹49 Cr + Reserves ₹4,039 Cr), up sharply from ₹2,892 Cr in FY25, largely due to fresh equity infusion.
Debt: Borrowings of ₹733 Cr, broadly stable versus ₹732 Cr in FY25.
Debt-to-equity: ~0.16–0.22x — low and among the more conservative names in the sector.
Cash position: Net cash flow swung sharply positive (+₹411 Cr) in FY26, largely due to financing inflows (likely the equity raise) rather than core operations.
Working capital: Cash conversion cycle has stretched to 161 days (FY26) from 143 days (FY25), driven by longer inventory/debtor days — a mild efficiency concern to monitor.
Interest coverage: Operating profit of ₹892 Cr against interest cost of ₹80 Cr implies coverage of over 11x — comfortable.
Overall Balance Sheet Rating: Stable to Strong. Leverage is low and interest coverage is comfortable, though the lengthening working-capital cycle and the FY26 dip in operating cash conversion are points to track in coming quarters.
Business & Growth Outlook
Growth opportunities: Expansion in value-added and high-margin products (Type-IV composite cylinders for LPG/CNG/hydrogen), continued leadership in industrial packaging (drums, IBCs), and HDPE pipes.
Industry outlook: India's industrial packaging and specialty polymer segment continues to benefit from manufacturing/export growth and import substitution themes.
Expansion/capex: FY26 saw a step-up in capital expenditure and capital-work-in-progress (₹230 Cr CWIP, up from ₹79 Cr), pointing to active capacity build-out.
Corporate action: The company has announced a board discussion (26 Aug 2026) on a proposed merger of TPL Plastech Limited into Time Technoplast — a structural development investors should track for further disclosures.
New order wins: Recent order win from NTPC for a hydrogen locomotive pilot project signals early traction in the hydrogen/clean-energy composite cylinder segment, though currently small in absolute value.
Key risks: Commodity (polymer/resin) price volatility, working-capital cycle lengthening, reduced promoter holding percentage, moderation in cash conversion, and execution risk around the proposed merger and capacity expansion.
Technical Analysis
Current Price: ₹185.30 (as marked on the chart)
Chart Pattern: An Inverse (bullish) Head & Shoulders pattern is visible, formed over roughly November 2025 to June 2026 — with a clear Left Shoulder, a deeper Head (lows near the March–April 2026 zone), and a shallower Right Shoulder (June 2026). The price broke out of this base and rallied strongly through July–August 2026.
Breakout Level: The neckline/breakout resistance zone is visible around the ₹204–205 area (marked by the horizontal cyan line), which the price broke above during the July–August rally before pulling back.
Reversal Zone: ₹173 to ₹180.5 — clearly marked on the chart as the zone where a reversal/retest of support is expected to hold if the recent breakout is to remain valid.
Resistance:
R1: ₹195
R2: ₹210
R3: ₹235
Support: The Reversal Zone of ₹173–180.5 also functions as the nearest visible support band; no other support level is explicitly marked on the chart.
Setup explained simply: The stock built a rounded bottom (inverse head-and-shoulders), broke out above the ~₹205 neckline, rallied toward the ~₹235 region, and has since pulled back to retest the breakout zone. Price is currently consolidating between the Reversal Zone (₹173–180.5) below and R1 (₹195) above. As long as the Reversal Zone holds on a closing basis, the broader breakout structure stays intact; a break below it would raise doubts about the pattern's validity.
Techno-Fundamental View
Fundamental attractiveness: Consistent multi-year revenue and profit growth (5-year PAT CAGR of ~35%), low leverage, improving ROCE, and a leadership position in a niche, high-barrier segment (composite cylinders, industrial packaging) make the business fundamentally sound.
Technical support: The completed inverse Head & Shoulders base and the successful breakout above the ~₹205 neckline reflect underlying bullish structure, even after the recent pullback.
Major concerns: FY26 saw softer operating cash flow conversion and negative free cash flow due to elevated capex; the working capital cycle has lengthened; and promoter holding has declined. On the technical side, price is currently below both the breakout level and R1, meaning the retracement needs to hold.
Bullish confirmation level: A sustained move back above the ₹195 (R1) and then the ₹204–205 breakout/neckline zone would support renewed bullish momentum.
Invalidation level: A decisive close below the ₹173–180.5 Reversal Zone would weaken the technical setup and call the breakout's durability into question.
Fundamental Rating — Out of 5
Business Strength: 4/5
Financial Stability: 4/5
Profitability: 3/5
Growth Potential: 4/5
Valuation: 3/5
Management/Corporate Quality: 3/5
Overall Fundamental Rating: 3.5/5
Time Technoplast scores well on business positioning, balance sheet strength, and long-term growth track record, supported by low leverage and a leading market position in niche polymer/composite segments. The rating is moderated by softer near-term cash conversion, a declining promoter stake, and valuation that — while reasonable versus peers — is not distinctly cheap.
Final View
Fundamental outlook: Constructive, backed by a strong multi-year growth trend, low debt, and leadership in industrial packaging and composite cylinders, tempered by a near-term dip in cash flow conversion and a pending merger development to watch.
Technical outlook: Bullish structurally (inverse Head & Shoulders breakout), but currently in a consolidation/retest phase.
Technically, the setup stays constructive as long as price holds the ₹173–180.5 reversal/support zone, while a close above ₹195–205 would strengthen bullish momentum toward the ₹210 zone and beyond.
Key breakout level: ₹204–205
Reversal/support zone: ₹173–180.5
Upside resistance levels: R1 ₹195, R2 ₹210, R ₹235.
Major risk: A breakdown below the reversal zone, or a slippage in cash flow/working-capital metrics in coming quarters, would weaken both the technical and fundamental case.
Disclaimer: aliceblueonline.com Grasim Industries: Momentum Surge & BreakoutRecent News & Corporate Announcements
Q1 FY27 Earnings Date: Grasim Industries is scheduled to announce its Q1 FY27 financial results and hold its analyst call on August 12, 2026.
Dividend Record Date: August 7, 2026 marks the record date for the recommended final dividend of ₹10 per share (500% on ₹2 face value) for FY26.
Business Expansion: Market sentiment remains supported by rapid capacity utilization in the Birla Opus paints segment and expansion in cellulosic specialty fibers, offsetting initial launch-phase operational costs.
Technical Chart Analysis
Multi-Week Breakout: The weekly chart displays a strong bullish breakout, with price action clearing the long-standing horizontal resistance line of ₹3,246.0 to reach current levels around ₹3,290.1.
Counter Trend Reversal: The base of the recent impulse leg marks a solid counter-trend reversal structure at ₹3,066.4.
Supertrend Indicator: The weekly Supertrend (7, 2) is active in green at ₹2,933.0, reaffirming macro uptrend support.
Momentum Indicator (Williams %R): The Williams %R (26) is reading at -0.43 (well above the -20 threshold), indicating a strong momentum surge in bullish territory.
Trade Projection & Levels
Current Market Price (CMP): ₹3,290.1
Immediate Support / Re-test Zone: ₹3,246.0
Stop-Loss: ₹3,066.4 (Counter-trend reversal base)
Disclaimer: aliceblueonline.com M&M Swing Setup: Bullish Trend ShiftRecent News & Corporate Announcements
Strong Auto & SUV Sales Volume: M&M continues to report robust monthly sales growth driven by sustained high demand across its flagship SUV portfolio (XUV700, Scorpio-N, Thar/Thar ROXX) and stable farm equipment segment performance.
Electric Vehicle & SUV Strategy: Ongoing expansion in EV manufacturing capacities, strategic investments in the EV business unit (MEAL), and upcoming launch pipelines continue to bolster medium-to-long-term investor sentiment.
Quarterly Performance: Robust operational performance with expanding margins across the automotive segment and strong cash flow generation supporting growth plans.
Technical Chart Analysis
Trend & Structure: The weekly chart shows a strong bullish continuation with a clear structural "Trend Shift From Red to Green", confirming a fresh bullish phase.
Supertrend Indicator: The Supertrend (7, 2) indicator is active in green and situated at ₹3,107.5, providing strong macro trend support.
Weekly Breakout: Price action indicates an active Weekly Breakout around current market levels (₹3,493.4), signaling strong institutional buying interest.
Momentum Indicator (Williams %R): The Williams %R (26) is reading at -28.83 and moving upward, confirming gaining weekly momentum in the bullish zone.
Trade Projection & Levels
Current Price (CMP): ₹3,493.4
Weekly Breakout Zone: ₹3,460.0 – ₹3,490.0
Stop-Loss: ₹3,457.0 (Alternative structural support at ₹3,398.5 / ₹3,325.2 for positional trades)
Disclaimer: aliceblueonline.com Tata Elxsi: Base Building Above ₹3,690 AnalysisRecent News & Corporate Announcements
Q1 FY27 Earnings Impact: Tata Elxsi reported its Q1 FY27 results in mid-July 2026 with a net profit of ₹170.6 crore and revenue of ₹1,021.1 crore. Despite steady top-line growth, the stock faced sell-offs due to a 330 bps margin contraction caused by elevated transition/onsite costs and European automotive sector headwinds
Healthcare & Strategic Partnerships: On July 27, 2026, the company announced a strategic partnership with SCTIMST to accelerate medical technology development and healthcare innovations.
Dividend & Full-Year Growth: Board declared a final dividend of ₹75 per share (750%) for FY26 following solid full-year growth.
Technical Chart Analysis
Trend & Structure:The weekly chart exhibits a prolonged primary markdown phase following the break below its downward trendline. However, recent price action indicates a structural base building near the ₹3,680–₹3,690 support zone (3-week Support Bounce).
Moving Averages & Breakouts: 9-Week SMA Breakout: The stock has reclaimed its 9-week SMA (currently at ₹3,783.30) after 9 consecutive weeks under moving average resistance.
4-Week High Breakout: Current trading price (₹3,807.40) marks a breakout above the prior 4-week high range with an active Change of Character (ChoCH) indicator on the weekly timeframe.
Trade Projection & Levels
Key Support / Stop-Loss: ₹3,690.00 (Base of the 3-week support cluster)
Immediate Hurdle / Breakout Zone: ₹3,840.00
Target 1 (Initial),"₹4,139.30",Retest of intermediate breakdown origin / prior swing low resistance
Target 2 (Full Target),"₹4,462.80",Structural horizontal swing target post-trendline recovery
Disclaimer: aliceblueonline.com
Nifty 50 Weekly Outlook ( 3rd Aug to 7th Aug 2026 )The Nifty 50 Index closed the week at 24,383.60, surging +616.15 points (+2.59%), reflecting a strong bullish breakout and renewed buying momentum. The index has reclaimed the key price action pivot zone, indicating that the broader uptrend remains intact.
🔹 Key Levels for the Upcoming Week
📌 Price Action Pivot Zone (24,334–24,368)
This blue-shaded area is the key weekly decision zone. As long as Nifty holds above this range, the bullish structure remains strong. Sustaining above the pivot could lead to further upside, while a breakdown below it may trigger short-term profit booking.
🔻 Support Levels
S1: 24,270
S2: 24,189
S3: 24,089
🔺 Resistance Levels
R1: 24,458
R2: 24,580
R3: 24,725
📈 Market Outlook
✅ Bullish Scenario:
If Nifty sustains above the Price Action Pivot Zone (24,334–24,368) and breaks above R1 (24,458), bullish momentum could strengthen toward R2 (24,580). A sustained breakout above this level may extend the rally toward R3 (24,725).
❌ Bearish Scenario:
If the index slips below the 24,334 support zone, selling pressure could drag Nifty toward S1 (24,270). A decisive break below this level may lead to a decline toward S2 (24,189) and eventually S3 (24,089).
Disclaimer: aliceblueonline.com Healthcare Giant Turns Bullish?Max Healthcare is India's largest listed hospital chain by market capitalization, with a strong presence in North India and an aggressive expansion strategy. The company continues to benefit from rising healthcare demand, higher occupancy levels, premium treatment offerings, and operational efficiencies.
The company recently reported 12% revenue growth and 7% growth in net profit, reflecting resilient operational performance while continuing to expand its hospital network.
Key Financial Ratios
P/E Ratio: ~65x
Price-to-Book: ~7.8x
ROE: ~14.3%
ROCE: ~12.0%
Current Ratio: ~0.89
Dividend Yield: ~0.2%
While the stock trades at premium valuations, the market continues to reward its consistent earnings growth, superior healthcare franchise, and long-term expansion plans.
Balance Sheet & Financial Stability
✔ Consistent revenue and earnings growth.
✔ Strong operating margins compared to industry peers.
✔ Healthy cash generation supporting future expansion.
✔ Ongoing investments in new hospitals and bed capacity.
✔ Low leverage with a stable financial profile.
Technical Outlook
The stock has completed an Inverse Head & Shoulders pattern and is currently trading near the neckline after a successful breakout. Such formations often signal the beginning of a new medium-term uptrend if the neckline continues to hold.
Key Technical Levels
📌 Neckline Breakout Zone: ₹1,100 (Key support after breakout)
📌 Immediate Resistance (R1): ₹1,190
📌 Major Resistance (R2): ₹1,255
📌 Long-Term Resistance (R3): ₹1,310
📌 Reversal Zone: ₹1,068–₹1,086
The highlighted reversal zone acts as a strong demand area. As long as the stock remains above this support, the bullish reversal pattern remains valid.
Techno-Fundamental View
The combination of:
✔ Bullish Inverse Head & Shoulders pattern
✔ Consistent earnings and revenue growth
✔ Strong healthcare demand
✔ Expansion in hospital capacity
✔ Healthy profitability and improving operational efficiency
✔ Long-term structural growth in India's healthcare sector
creates a favorable setup for both positional traders and long-term investors.
Fundamental Ratings (Out of 5)
Business Strength: 4.8
Financial Stability: 4.6
Profitability: 4.5
Valuation: 3.8
Growth Potential: 4.8
Overall Techno-Fundamental Rating: 4.5/5
Investment View
Short-Term View: Sustaining above the neckline and the ₹1,068–₹1,086 reversal zone could lead the stock towards ₹1,190, followed by ₹1,255 and ₹1,310.
Medium-to-Long-Term View: Max Healthcare remains one of the strongest structural growth stories in India's healthcare sector. Any pullback toward the reversal zone may offer an attractive accumulation opportunity for long-term investors.
Conclusion
Max Healthcare has formed a high-probability Inverse Head & Shoulders reversal pattern, supported by solid fundamentals and continued business expansion. If the neckline support holds, the stock appears well-positioned for the next leg of its uptrend, with ₹1,190, ₹1,255, and ₹1,310 emerging as the key upside targets.
Disclaimer: aliceblueonline.com Aether Eyes Fresh HighsAether Industries is one of India's leading specialty chemical manufacturers, catering to pharmaceuticals, agrochemicals, material sciences, oil & gas, and performance chemicals. The company continues to strengthen its position through innovation, contract manufacturing, and custom synthesis while benefiting from the global China+1 supply chain shift.
The company has reported strong revenue and profit growth in FY26, driven by higher demand for high-value specialty chemicals and increasing contribution from contract manufacturing.
Key Financial Ratios
P/E Ratio: ~66x
Price-to-Book: ~6.5x
ROE: ~9.4%
ROCE: ~11.7%
Current Ratio: 1.78
Quick Ratio: 0.65
Although the stock trades at premium valuations, investors continue to assign higher multiples due to its niche product portfolio, technological capabilities, and long-term growth potential.
Balance Sheet & Financial Stability
✔ Healthy balance sheet with manageable leverage.
✔ Strong investment in manufacturing capacity and R&D.
✔ Revenue increased by approximately 38% in FY26.
✔ Net profit also recorded healthy double-digit growth, supported by improving operating margins.
✔ Expanding contract manufacturing business provides strong long-term earnings visibility.
Technical Outlook
After consolidating within a narrow range around ₹1,535, Aether has successfully broken above resistance, confirming a Range Breakout and signaling renewed bullish momentum.
Key Technical Levels
📌 Range Breakout Level: ₹1,500–₹1,535 (Successfully crossed)
📌 Immediate Resistance (R1): ₹1,750
📌 Major Resistance (R2): ₹1,875
📌 Long-Term Resistance (R3): ₹2,100
📌 Reversal Zone: ₹1,400–₹1,453
The highlighted reversal zone now becomes an important support area. As long as the stock sustains above this demand zone, the broader uptrend remains intact.
Techno-Fundamental View
The combination of:
✔ Confirmed range breakout
✔ Strong revenue and earnings growth
✔ Expanding specialty chemicals portfolio
✔ Increasing contribution from contract manufacturing
✔ Capacity expansion supported by R&D
✔ Beneficiary of the global China+1 manufacturing shift
creates a favorable outlook for both positional traders and long-term investors.
Fundamental Ratings (Out of 5)
Business Strength: 4.5
Financial Stability: 4.2
Profitability: 4.1
Valuation: 3.6
Growth Potential: 4.6
Overall Techno-Fundamental Rating: 4.3/5
Investment View
Short-Term View: Sustaining above the breakout zone could drive the stock towards ₹1,750, followed by ₹1,875 and ₹2,100.
Medium-to-Long-Term View: Any healthy retracement toward the ₹1,400–₹1,453 reversal zone may offer an attractive accumulation opportunity within the prevailing uptrend.
Conclusion
Aether Industries has confirmed a Range Breakout, backed by strong business momentum and a growing specialty chemicals portfolio. With healthy financial performance, continued capacity expansion, and structural industry tailwinds, the stock appears well-positioned for the next leg of its upward journey if it sustains above the breakout level.
Disclaimer: aliceblueonline.com Avalon Technologies Breaks Out: Bullish PennantAvalon Technologies is one of India's leading Electronics Manufacturing Services (EMS) companies, serving high-growth sectors such as aerospace, defense, clean energy, industrials, mobility, and medical electronics. The company continues to benefit from the global China+1 manufacturing strategy, increasing electronics outsourcing, and rising demand for high-value EMS solutions.
Management has set an ambitious goal of doubling revenue over the next three years, supported by a strong order book, expanding customer base, and favorable global supply chain trends.
Key Financial Ratios
P/E Ratio: ~55x
Price-to-Book: ~8.6x
ROE: ~16.9%
ROCE: ~21.9%
Current Ratio: 2.05
Quick Ratio: 1.06
The company trades at premium valuations, reflecting investors' confidence in its long-term growth prospects and improving profitability.
Balance Sheet & Financial Stability
✔ Healthy balance sheet with comfortable liquidity.
✔ Strong working capital management and improving cash conversion cycle.
✔ Expanding order book of over ₹2,100 crore, providing strong revenue visibility.
✔ Revenue grew 46% YoY in FY26, while net profit increased 78%, demonstrating strong operational execution.
Technical Outlook
Avalon has formed a well-defined Bullish Pennant, a continuation pattern that typically develops after a strong impulsive rally.
A breakout above the pennant indicates buyers have regained control and momentum may continue.
Key Technical Levels
📌 Bullish Breakout: Pennant breakout confirmed.
📌 Immediate Resistance (R1): ₹2,050
📌 Major Resistance (R2): ₹2,200
📌 Long-Term Resistance (R3): ₹2,400
The breakout remains valid as long as the stock sustains above the upper trendline of the pennant.
Techno-Fundamental View
The combination of:
✔ Bullish Pennant breakout
✔ Strong revenue and earnings growth
✔ Expanding order book
✔ Beneficiary of the global China+1 manufacturing shift
✔ Exposure to high-growth industries such as aerospace, defense, EVs, and clean energy
✔ Improving profitability and capital efficiency
positions Avalon Technologies as one of the promising growth stories in the Indian EMS sector.
Fundamental Ratings (Out of 5)
Business Strength: 4.5
Financial Stability: 4.3
Profitability: 4.2
Valuation: 3.6
Growth Potential: 4.8
Overall Techno-Fundamental Rating: 4.3/5
Investment View
Short-Term View: Sustaining above the pennant breakout could lead the stock towards ₹2,050, followed by ₹2,200 and ₹2,400.
Medium-to-Long-Term View: Avalon Technologies remains a high-growth EMS player with strong structural tailwinds. While premium valuations may lead to intermittent volatility, continued execution and order inflows could justify the higher multiples over time.
Conclusion
Avalon Technologies has confirmed a Bullish Pennant breakout, supported by robust financial performance, a growing order pipeline, and favorable industry dynamics. If buying momentum continues, the stock could enter the next leg of its uptrend, making it an attractive candidate for both momentum traders and long-term growth investors.
Disclaimer: aliceblueonline.com Bajaj Finance Breaks Record High: Bulls Eye ₹1,580Fundamental Overview
Bajaj Finance continues to maintain its leadership in the NBFC sector through consistent loan book expansion, strong digital adoption, diversified lending portfolio, and disciplined risk management. Its latest quarterly performance exceeded market expectations, prompting multiple brokerages to raise their target prices.
Key Financial Ratios
P/E Ratio: ~34x
Price-to-Book: ~5.6x
ROE: ~18%
ROA: ~3.8%
Debt-to-Equity: ~3.15x (normal for lending businesses)
Current Ratio: ~2.7
Dividend Yield: ~0.6%
Balance Sheet & Financial Stability
Strong Assets Under Management (AUM) growth.
Healthy capital adequacy and liquidity position.
Improving asset quality with lower slippages.
Consistent growth in Net Interest Income (NII).
Well-diversified retail lending franchise across consumer finance, SME, commercial lending, and gold loans.
Fundamental Ratings (Out of 5)
Business Strength: 5.0
Financial Stability: 4.8
Profitability: 4.7
Valuation: 3.8
Growth Potential: 4.8
Overall Fundamental Rating: 4.6/5
Technical Outlook
The stock has confirmed a lifetime high breakout, ending a prolonged consolidation phase. The breakout is accompanied by strong momentum, suggesting renewed institutional buying and the possibility of sustained upside.
Key Technical Levels
📌 All-Time High Breakout Zone: ₹1,085–₹1,105 (Successfully crossed)
📌 Immediate Resistance (R1): ₹1,260
📌 Major Resistance (R2): ₹1,380
📌 Long-Term Resistance (R3): ₹1,580
📌 Reversal Zone: ₹1,035–₹1,068
The highlighted reversal zone now becomes a strong support area. As long as the stock sustains above this zone, the primary bullish trend remains intact.
Techno-Fundamental View
The combination of:
✔ Fresh all-time high breakout
✔ Strong Q1 FY27 earnings beat
✔ 28% growth in net profit and 23% rise in Net Interest Income
✔ Improving asset quality and lower credit costs
✔ Consistent AUM growth and market leadership in retail lending
✔ Long-term structural growth in India's consumer finance market
creates a compelling techno-fundamental setup for investors.
Investment View
Short-Term View: Sustaining above the breakout zone could drive the stock towards ₹1,260, followed by ₹1,380 and ₹1,580.
Medium-to-Long-Term View: Any healthy pullback towards the ₹1,035–₹1,068 reversal zone may present an attractive buying opportunity within the ongoing long-term uptrend.
Overall Techno-Fundamental Rating: 4.7/5
Conclusion
Bajaj Finance has entered a fresh price discovery phase after breaking its previous all-time high. Supported by strong earnings, improving asset quality, and sustained business momentum, the stock remains one of the highest-quality growth stories in India's financial sector. If it continues to hold above the breakout level, the path toward ₹1,260, ₹1,380, and eventually ₹1,580 remains open.
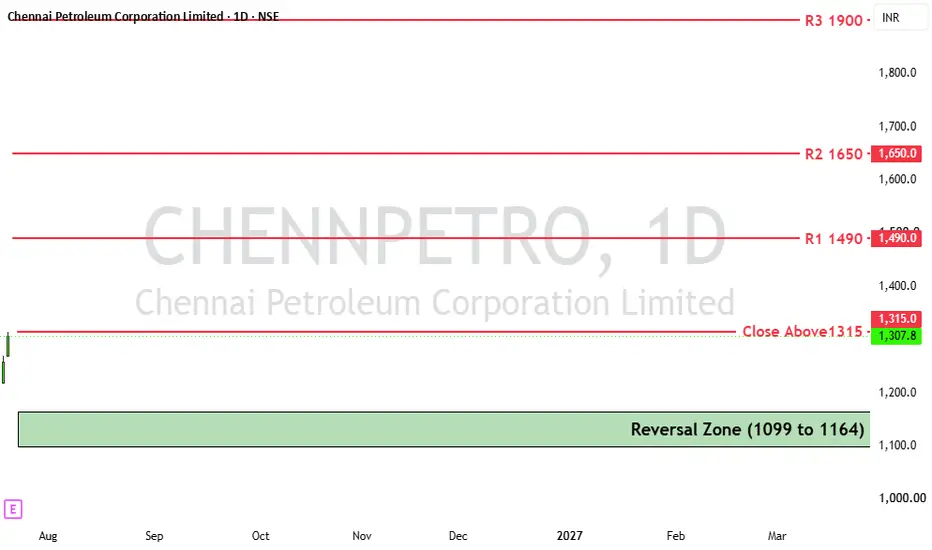
Disclaimer: aliceblueonline.com CPCL Breaks Into New Highs: More Upside Ahead?Chennai Petroleum Corporation Ltd. (CPCL) has entered a strong bullish phase after delivering a decisive breakout above its previous all-time high zone near ₹1,315. The stock closed at ₹1,307.80 (+3.95%), indicating strong buying momentum and renewed investor interest in the PSU refining space.
The breakout is particularly significant because it is supported not only by price action but also by robust financial performance, making CPCL an attractive techno-fundamental opportunity.
Fundamental Strength
Valuation & Profitability
P/E Ratio: ~5.4x (significantly below market average)
Price-to-Book: ~1.5x
ROE: ~32%
ROCE: ~32%
Dividend Yield: ~1.2%
The company continues to trade at inexpensive valuations despite delivering strong earnings and maintaining superior return ratios.
Balance Sheet & Financial Stability
Strong cash generation and improving liquidity.
Debt levels remain manageable compared to historical levels.
Healthy operating cash flows support future expansion and capex requirements.
CPCL's recent Navratna status enhances operational flexibility and growth prospects.
Fundamental Rating (Out of 5)
Business Strength: 4.0
Financial Stability: 4.0
Profitability: 4.5
Valuation: 4.5
Growth Potential: 3.5
Overall Fundamental Rating: 4.1/5
Technical Outlook
The stock has been forming a series of higher highs and higher lows, indicating a well-established uptrend. The recent breakout above the previous lifetime high confirms continuation of bullish momentum.
Key Technical Levels
📌 Major Breakout Level: ₹1,315
A decisive close above this zone can trigger fresh momentum buying.
📌 Immediate Resistance (R1): ₹1,490
📌 Major Resistance (R2): ₹1,650
📌 Reversal Accumulation Zone: ₹1,099 – ₹1,164
The highlighted green zone acts as a strong demand area. Any correction towards this region may attract long-term investors and positional traders.
ANISHFNK21
Follow
Disclaimer
The information and publications are not meant to be, and do not constitute, financial, investment, trading, or other types of advice or recommendations supplied or endorsed by TradingView. Read more in the Terms of Use.
Disclaimer: aliceblueonline.com Kirloskar Pneumatic: Next Multibagger?Kirloskar Pneumatic Co. Ltd. continues to stand out as a fundamentally strong industrial engineering company, backed by a debt-free balance sheet, healthy cash flows, and consistently high return ratios. The company benefits from growing demand across industrial, infrastructure, oil & gas, and manufacturing sectors, positioning it well for long-term growth.
Fundamental Analysis & Ratings
Revenue Growth: 4.5/5 – Consistent revenue growth driven by industrial capex and infrastructure demand.
Profit Growth: 4.5/5 – Healthy earnings growth with improving profitability.
Operating Margin: 4.5/5 – Stable margins reflecting efficient cost management.
Return on Equity (ROE): 5/5 – Excellent shareholder returns of over 21%.
Return on Capital Employed (ROCE): 5/5 – Strong capital efficiency above 25%.
Balance Sheet Strength: 5/5 – Debt-free with a robust net cash position.
Cash Flow Generation: 5/5 – Strong operating and free cash flow supporting future expansion.
Liquidity: 5/5 – Healthy current ratio and strong cash reserves.
Debt Management: 5/5 – Virtually debt-free, minimizing financial risk.
Dividend Quality: 3.5/5 – Consistent dividend payout with room for future growth.
Management Efficiency: 5/5 – Disciplined capital allocation and strong operational execution.
Valuation: 3/5 – Premium valuation (P/E ~48x), which limits the margin of safety.
Overall Ratings
Financial Strength: 5/5
Profitability: 5/5
Balance Sheet: 5/5
Cash Flow: 5/5
Business Quality: 4.8/5
Growth Potential: 4.5/5
Valuation: 3/5
Technical Structure: 4.5/5
Technical Levels
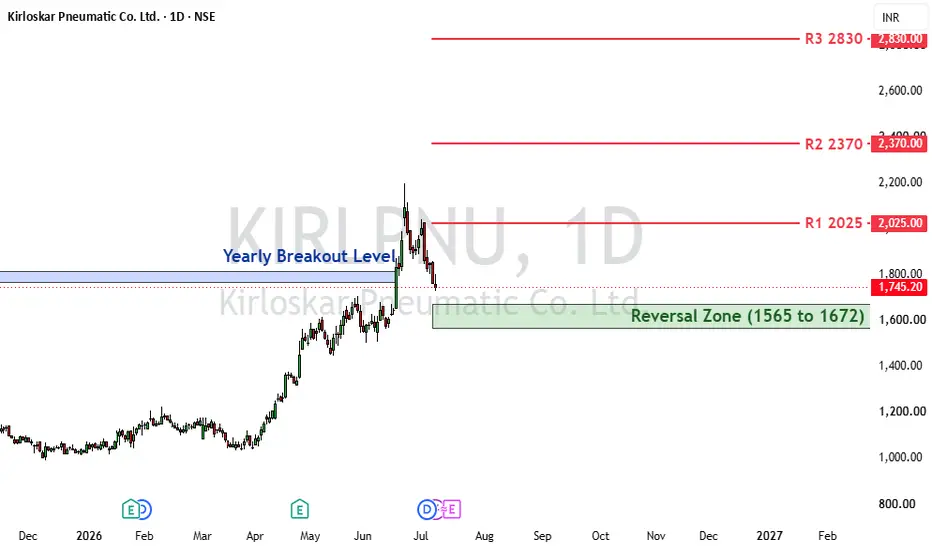
Immediate Support: Yearly Breakout Level
Major Reversal Zone: ₹1,565 – ₹1,672
Resistance 1: ₹2,025
Resistance 2: ₹2,370
Resistance 3: ₹2,830
Resistance 4: ₹3,230
Overall Fundamental Rating: 4.7/5
Investment View
Kirloskar Pneumatic remains a high-quality engineering company with exceptional financial strength and a constructive long-term technical setup. The stock is currently testing its Yearly Breakout Level, while the ₹1,565–₹1,672 Reversal Zone serves as a key accumulation area for long-term investors. A sustained move above ₹2,025 could revive bullish momentum toward higher resistance levels. Although valuations remain expensive, the company's robust fundamentals continue to support a Bullish long-term outlook, making corrections an opportunity for gradual accumulation.
Disclaimer: aliceblueonline.com Kirloskar Pneumatic: Next Multibagger?Kirloskar Pneumatic Co. Ltd. continues to stand out as a fundamentally strong industrial engineering company, backed by a debt-free balance sheet, healthy cash flows, and consistently high return ratios. The company benefits from growing demand across industrial, infrastructure, oil & gas, and manufacturing sectors, positioning it well for long-term growth.
Fundamental Analysis & Ratings
Revenue Growth: 4.5/5 – Consistent revenue growth driven by industrial capex and infrastructure demand.
Profit Growth: 4.5/5 – Healthy earnings growth with improving profitability.
Operating Margin: 4.5/5 – Stable margins reflecting efficient cost management.
Return on Equity (ROE): 5/5 – Excellent shareholder returns of over 21%.
Return on Capital Employed (ROCE): 5/5 – Strong capital efficiency above 25%.
Balance Sheet Strength: 5/5 – Debt-free with a robust net cash position.
Cash Flow Generation: 5/5 – Strong operating and free cash flow supporting future expansion.
Liquidity: 5/5 – Healthy current ratio and strong cash reserves.
Debt Management: 5/5 – Virtually debt-free, minimizing financial risk.
Dividend Quality: 3.5/5 – Consistent dividend payout with room for future growth.
Management Efficiency: 5/5 – Disciplined capital allocation and strong operational execution.
Valuation: 3/5 – Premium valuation (P/E ~48x), which limits the margin of safety.
Overall Ratings
Financial Strength: 5/5
Profitability: 5/5
Balance Sheet: 5/5
Cash Flow: 5/5
Business Quality: 4.8/5
Growth Potential: 4.5/5
Valuation: 3/5
Technical Structure: 4.5/5
Technical Levels
Immediate Support: Yearly Breakout Level
Major Reversal Zone: ₹1,565 – ₹1,672
Resistance 1: ₹2,025
Resistance 2: ₹2,370
Resistance 3: ₹2,830
Resistance 4: ₹3,230
Overall Fundamental Rating: 4.7/5
Investment View
Kirloskar Pneumatic remains a high-quality engineering company with exceptional financial strength and a constructive long-term technical setup. The stock is currently testing its Yearly Breakout Level, while the ₹1,565–₹1,672 Reversal Zone serves as a key accumulation area for long-term investors. A sustained move above ₹2,025 could revive bullish momentum toward higher resistance levels. Although valuations remain expensive, the company's robust fundamentals continue to support a Bullish long-term outlook, making corrections an opportunity for gradual accumulation.
Disclaimer: aliceblueonline.com Bank Nifty 50 Weekly Outlook (22nd June – 26th June 2026)The Nifty Bank Index last week ended at 57,714.85, gaining +28.05 points (+0.05%) on the weekly chart, indicating a consolidation phase near the key price action pivot zone.
🔹 Key Levels for this Week
📌 Price Action Pivot Zone (57,593–57,887)
This blue-shaded area represents the crucial weekly decision zone. Sustaining above 57,887 may trigger fresh bullish momentum, while rejection from this zone could keep the market under pressure.
🔻 Support Levels
S1: 56,830
S2: 56,056
S3: 55,420
🔺 Resistance Levels
R1: 58,350
R2: 59,057
R3: 59,713
📈 Market Outlook
✅ Bullish Scenario:
If Bank Nifty manages to reclaim and sustain above the Price Action Pivot Zone (57,593–57,887), buying momentum could push the index toward R1 (58,350). A decisive breakout above this level may extend the rally toward R2 (59,057) and R3 (59,713).
❌ Bearish Scenario:
If the index fails to hold above 57,593, selling pressure may intensify, dragging Bank Nifty toward S1 (56,830). A breakdown below this support could open the doors for a move toward S2 (56,056) and S3 (55,420).
Disclaimer: aliceblueonline.com Nifty 50 Weekly Outlook ( 22nd June – 26th June 2026)The Nifty 50 Index closed the week at 24,044.20, gaining +18.30 points (+0.08%), indicating that the index continues to trade above the key price action zone while maintaining a cautiously bullish structure.
🔹 Key Levels for the Upcoming Week
📌 Price Action Pivot Zone (23,888–23,978)
This blue-shaded area represents the crucial weekly decision zone. As long as Nifty sustains above this range, the overall trend remains positive. A decisive move above the immediate resistance could extend the ongoing rally, while a breakdown below the pivot may invite fresh selling pressure.
🔻 Support Levels
S1: 23,648
S2: 23,333
S3: 23,000
🔺 Resistance Levels
R1: 24,133
R2: 24,335
R3: 24,571
📈 Market Outlook
✅ Bullish Scenario:
If Nifty sustains above the Price Action Pivot Zone (23,888–23,978) and breaks above R1 (24,133), bullish momentum could accelerate toward R2 (24,335). A sustained breakout above this level may open the path toward R3 (24,571).
❌ Bearish Scenario:
If the index fails to hold the 23,888 support zone, selling pressure may drag Nifty toward S1 (23,648). A breakdown below this support could extend the decline toward S2 (23,333) and eventually S3 (23,000).
Disclaimer: aliceblueonline.com