Risk Management Tools for Successful TradingTrading in any market and utilising any trading platform brings with it the possibility of risks that could be detrimental. It is essential to assess and handle trading risks, taking into account elements like inflation, natural disasters, and political instability.
Savvy investors employ risk management tools to safeguard their assets and enhance their opportunities for long-term financial gain. Using the proper trading risk management software and following the necessary steps is vital for effectively managing risk in market fluctuations.
This article will explore risk-handling tools and techniques that seasoned traders use to secure their portfolios and multiply gains.
Key Takeaways
Employing proper risk management techniques helps manage exposure to finance threats.
Trading risks can be active, measured by alpha, and passive, measured by beta.
Successful traders limit their dealing capital to an amount they can afford to lose in case of a trading mistake.
Maximum drawdown, backtesting, position sizing, etc., are the most common procedures seasoned traders use to handle risks.
Why Risk Management Is Important
In the volatile finance trading world, a trader's success often depends on their risk-managing approach. By utilising effective risk tools and techniques, traders can ensure a sustainable career and manage exposure to capital threats.
Effective risk management in trading prevents market unpredictability, protects traders from disastrous losses, and instils discipline to cut losses at predetermined points. This systematic approach helps traders maintain confidence and remain solvent amidst unfavourable market movements.
Risk management involves measuring potential losses against profit potential on each new position in financial markets. A disciplined approach to risk and reward is essential to avoid losing positions for too long.
Without a proper plan, traders risk losing their positions and profits due to unexpected market news or having to earn profits for a long time. A risk management plan that includes several tools protects capital and earnings, reducing stress and anxiety. Implementing these tools helps traders achieve their trading goals without the stress of losing everything at any time.
How to Define Your Risks
Trading risk management tools are essential for defining exit strategies for both failing and successful trades. Risk exposure management involves estimating the potential impact of various risks on an investment or portfolio.
Trading risk can be evaluated using active and passive risk management methodologies. Active risks are subjective exposures arising from a trading strategy, while passive risks are objective exposures arising from market events.
Active risks represent subjective risk exposure from trading strategies, measured by alpha, which measures asset performance against a benchmark. A positive alpha indicates a higher return percentage, while a negative alpha indicates a lower return.
Passive risks are objective risk exposures arising from market events beyond our control. Beta, a passive risk ratio, measures asset volatility against a benchmark. A beta above 1 indicates higher volatility, indicating the portfolio amplifies market movements. Conversely, a beta below 1 suggests lower volatility, indicating stability and resilience in turbulent market conditions.
Best Risk Management Tools and Techniques
Strong risk-management strategies in trading can prevent euphoria and fear, which often lead to poor decision-making. It allows for objective market analysis and a willingness to follow the market flow, knowing you have taken reasonable steps to limit the risk of large losses.
One of the key risk management rules adopted by successful traders is to limit your trading capital to an amount that you can afford to lose if things go wrong. This method improves decision-making and allows to trade without feeling too much pressure.
Besides this method, proficient traders also use such techniques as backtesting, defining maximum drawdown, placing stop-loss orders and daily loss limits. They also employ position sizing, hedging, and portfolio diversification. Let's delve into each of these risk-managing techniques in more detail.
Maximum Drawdown
Maximum drawdown (MDD) is a measure of the largest movement from a high point to a low point before a new peak is achieved. It is used to assess the relative riskiness of stock screening procedures based on capital preservation. A low maximum drawdown indicates small losses, while a zero maximum drawdown indicates no losses. The maximum drawdown formula is as follows:
Maximum Drawdown Formula: MDD = (Trough Value - Peak Value) / Peak Value
The worst possible maximum drawdown is -100%, meaning the investment is worthless. MDD should be used in the right perspective to derive maximum benefit from an investment's performance. Professional traders base their MDD on their financial situation and willingness to take risks.
All traders have a max drawdown, which is their account size. If you're concerned about losing more than your MDD, set it as the maximum amount of money in your trading account.
Backtesting
Backtesting is a method used by professional traders that helps analyse and evaluate the performance of a trading strategy using historical data.
It lets traders assess the effectiveness of their strategies without risking real money. By analysing the strategy's performance over time, traders can gain insights into its performance under different market conditions and make necessary adjustments.
Backtesting benefits traders by identifying potential flaws in their strategies, such as underperforming techniques, which may indicate a need for refinement. It also helps optimise trading techniques by spotting the most effective parameters, such as testing different values for indicators to see which ones yield the best results.
Stop Loss Orders
A stop-loss order (SLO) is a crucial tool in risk handling, helping traders and investors protect their capital by setting predefined exit points. They automatically close an open trading position if unexpected volatility occurs and the underlying asset's price reaches a set value, helping protect trade against emotional decisions during market fluctuations. SLOs are often combined with Take-profit orders. Take-profit orders execute when an asset reaches a profit goal, securing earnings before market reversal.
Using SLOs as part of risk handling helps control risk, reduces the chance of large unexpected losses, and helps assess risk and reward. It allows users to measure the profit or loss achieved on each trade against the original potential loss, making it easier to decide not to enter certain trades if the profit potential is too small compared to the initial risk.
However, setting the SLO too often can lead to excessive trading commissions and missed opportunities. To set the right stop-loss level, start with a percentage based on your risk tolerance, consider volatility-based orders, and combine stop-loss orders with other risk management techniques like position sizing and diversification. It's essential to backtest different stop-loss levels using historical data to see how they would perform in different market conditions.
Portfolio Diversification
This is a strategy used by experienced traders and investors to minimise the impact of adverse events on a specific investment or sector. It involves distributing their investments across various asset classes or markets to minimise exposure to a single security.
Portfolio diversification involves choosing less-correlated assets that move simultaneously and correlate highly with the same factors. Positive or negative correlations can affect the price movement of assets. Positively correlated assets, like USD/JPY and USD/CHF, increase when markets move in our favour, leading to substantial profits but high-risk exposure.
Negatively correlated assets, like USD/JPY and EUR/USD, move in opposite directions, resulting in minimal profits and negated by trading fees. No or low correlation assets, like USD/JPY, have no price relation, causing significant risk and a single factor creating a major risk for the portfolio.
Position Sizing
Position sizing is a fundamental strategy that limits the impact of a single trade or investment on the overall portfolio, controlling risk by defining the amount of capital at risk in any given position. It's the opposite of going "all in," allowing each trade to limit exposure to a certain percentage of total capital.
In other words, position sizing limits trader positions to 1-2% of their account to prevent significant impact from single trades. For example, setting the maximum exposure of one trade to 2% would limit exposure to 100x2%, allowing for 50 trades before losing all money.
Fixed percentage position sizing is a trading strategy where the position size is calculated on each new trade, ensuring the initial stop-loss level equals a fixed percentage of the funds in the account. This method is crucial for maintaining a trading edge and avoiding erratic position sizing.
It allows for the gradual increase in position size as trading capital grows, ensuring steady growth while maintaining the same percentage risk levels.
Daily Loss Limit
The Daily Loss Limit (DLL) is a crucial risk management tool for traders to control conceivable losses and protect their trading capital. It determines how much a trader can afford to lose in a single day. DLL is based on the trader's trading history and is best determined by setting it at their average good winning day. DLLs are determined based on risk toleration, trading strategy, and account size.
To calculate the DLL, look for the midpoint between your average winning day and your best winning day. By setting yourself back less than a typical good day, the pressure will be lessened, reducing the likelihood of making mistakes.
Setting a DLL is essential for day traders in futures trading, as it helps mitigate inherent risks, such as excessive losses that could negatively affect profitability. It also encourages traders to assess and optimise the risk-to-reward ratio of their trades more carefully, considering potential losses relative to potential gains before entering into a trade.
A well-defined DLL helps bring consistency to the markets each day, limiting daily losses and preserving capital over the long run.
Hedging
Hedging is a risk reduction strategy where traders take an offsetting position in a related security to offset potential losses. This strategy is commonly employed by traders in unsteady markets to protect their portfolios and mitigate potential losses. Hedging can be done using derivatives, insurance, futures contracts, swaps, options, and over-the-counter products.
For example, if company ABC produces cornflakes, it must ensure the price does not rise invariably during procurement. To do this, the company enters into offsetting long contracts in the corn futures market at $400/bushel.
If the spot price is $425/bushel, the company has successfully hedged this price variability by entering into a long futures contract. If the spot price is less than $400, the company still buys corn at $400/bushel, achieving a price lock of $400/bushel.
Common hedging strategies include long/short equity, pair trading, options collar, risk reversal, currency hedging, and diversification. Long/short equity involves holding long positions in stocks that are expected to increase in value and short positions in stocks that are expected to decrease in value.
Pair trading means taking long and short positions in highly correlated securities to profit from price fluxes and reduce market risk. Options collar protects against asset decline and generates income, while risk reversal maximises value increase while limiting the downside. Currency hedging protects against rate fluxes, and diversification involves investing in a range of assets to reduce overall risk.
Final Takeaways
Effective risk administration is vital in trading, ensuring secure trades and minimising losses. Knowledge of basic risk management instruments helps identify and evaluate risks, maximising gains.
Risk management tools help traders make calculated decisions against uncertainty, reducing the risk of unexpected losses. Mastery of trading threat estimation and control ensures each move on the finance battlefield is measured, leaving less chance for random actions.
It also helps maintain emotional stability, which is essential for thriving trading in volatile markets. Integrating robust enterprise risk management tools into trading processes is essential for consistent growth and minimising market event impact.  Education
"Cheat Sheet" for Technical Indicators to Succeed in TradingTrading in financial markets can be challenging in the light of multiple trading markets, instruments, assets, and orders that can be executed to make some gains. Also, after analysing the above, success is not guaranteed in the financial market. Most traders try to mitigate the risks and maximise the chances of hitting the jackpot using technical indicators and analysis to look at the market trends differently.
Technical indicators help paint a bigger picture of what is happening in the market and spot the light on underlying meanings behind a particular price action. Ensure you read until the end of this article and find a cheat sheet to excel at technical analysis.
Key Takeaways
Technical indicators are tools and signals that help traders better understand market trends and price movements.
Indicators can be found on trading platforms for free, while some indicators are downloadable from different sources.
Technical indicators assist traders in identifying potential trends, entry/exit points, resistance/support levels, and more.
Indicators are technical tools provided in the trading platform, including signals, technical analysis, and options you can apply to a trading chart.
Most platforms offer a plethora of trading indicators that you drag and drop on the trading charts to explore different readings of the price trend and direction. Beginner traders may find it intimidating because there are many indicators, and not all apply to every asset.
Different technical indicators depend on your trading strategy, style, and industry. Some indicators are more risk tolerant than others, which can be applied to more volatile markets like cryptocurrencies, while other technical indicators are well-suited for long-term investments.
Why Use Trading Indicators
Financial markets involve a complex structure and several dependencies and variables, and a single glimpse at the price chart patterns may not tell everything the trader needs to know.
Therefore, trading indicators and tools help traders understand the full picture, track previous price tendencies, and reasonably predict future price movements.
For example, the price of asset A may face a sudden price increase, higher than that last 15 days average. A trader may think it is time to buy and capitalise on the increasing asset price.
However, a technical indicator may show that this price increase is an outlier movement due to overbuying, and the price will soon return to the average price, meaning that buying now is not the best move.
Top Technical Indicators You May Need to Know About
Technical indicators are usually shown in the options tab on the trading platform, and you may find different indicators between the platforms. However, here’s a cheat sheet of the most popular technical indicators you can use with your trading strategies.
Moving Averages
The moving averages are a commonly used technical indicator due to their simplicity and the useful technical analysis they provide. Moving averages use a price line of an asset’s previous price averages over a period of time.
This technical analysis helps traders identify market trends and to better respond to market sentiment. Most traders use the moving averages through Simple Moving Averages and Exponential Moving Averages.
Simple moving averages (SMA) measure the historical price averages during different timeframes.
Exponential moving averages (EMA) measure historical price averages during different timeframes, giving more value to recent periods. For example, a 10-day EMA line has more weight than a 50-day EMA line to focus on trend changes.
Using this technical analysis, if the price increases and crosses above its MA line, it refers to a possible price increase. On the other hand, if the price drops below the MA line, it indicates a possible downward trend.
Moving Average Convergence Divergence
The Moving Average Convergence Divergence is a momentum indicator that helps traders identify future price movements to capitalise on accelerated price changes. The MACD works well with trend trading strategy, where traders follow and act on market trends.
The MACD indicator is derivative from the moving averages technical indicators, using EMA as a baseline. MACD works by subtracting EMA-26 from EMA-12 as a fast line on the one hand.
On the other hand, the fast line is combined with a slow line, which is the EMA-9 line. This technical analysis compares the fast line “MACD line” against the slow line “signal line” to find market sentiment.
When the MACD line drops below the signal line, it indicates a downward trend; when the MACD price breaks over the signal line, it indicates an upward trend.
Relative Strength Index
The RSI is another momentum indicator that reveals a price trend's strength by using average price losses and gains over historical periods. This technical analysis indicator displays the results and gives a score ranging from 0 to 100.
RSI score above 70: The asset is overbought, and a trend reversal is expected.
RSI score under 30: The asset is oversold, and a potential trend reversal can happen to average price levels.
Bollinger Bands
Bollinger Bands are volatility indicators that assist traders in identifying volatility levels and determining entry and exit points. BB technical indicators use three lines or bands: an upper band, a lower band, and a middle band, that is, the SMA line.
The upper and lower bands expand and shrink, simulating market volatility, while the SMA line dictates if an asset is overbought or oversold. If the middle line moves close to the upper bands, the asset is overbought, and vice versa.
Stochastic Oscillator
This technical indicator measures price momentum by calculating an asset closing price and comparing it to historical price averages over a certain period of time.
The Stochastic Oscillator technical analysis gives a score ranging from 0 to 100, indicating how strong is a given price trend.
Stochastic Oscillator over 80: asset is overbought.
Stochastic Oscillator below 20: an asset is oversold.
Ichimoku Cloud
Ichimoku Cloud is like multiple indicators in one tool because it helps traders determine market trends, momentum, entry and exit points, and more.
This technical analysis draws a shaded cloud on the trading chart, indicating support and resistance levels, current price action, and if a potential trend reversal is expected.
This indicator works for different trading strategies because it powers various technical analysis tools that suit different markets.
Concluding Thoughts
Technical indicators are tools and signals that help traders better read chart patterns and understand price movements, which can be combined with different trading strategies. Multiple indicators are used to measure volatility, while others analyse momentum and how strong is the current price movement.
Applying technical indicators will assist you in market forecasting and making informed decisions to increase your chances of success. How the Fed's June Decision Hit EUR/USD, Bitcoin and GoldOn June 17, 2026, the Federal Open Market Committee voted to leave the federal funds rate unchanged at 3.50% - 3.75%. The rate itself moved no market. What moved markets was everything else.
The Triangle at a Glance: Before and After
EUR/USD — Pre-FOMC (Jun 16): ~1.1590 → Post-FOMC (Jun 18): ~1.1450. Move: −1.2%. Dollar strengthened; euro hit a 10-week low.
BTC/USD — Pre-FOMC: ~$65,800 → Post-FOMC: ~$64,150. Move: −2.5%. Risk-off; hawkish dots hit leveraged positions.
XAU/USD — Pre-FOMC: ~$4,370 → Post-FOMC: ~$4,290–4,330. Move: −1.5%. Hawkish real yield shock; below all key moving averages.
What the Fed Actually Did - and Why It Mattered
The rate decision was the least interesting part of the June meeting. The real content was threefold.
The dot plot shifted sharply hawkish. In March, zero officials had projected a hike in 2026. In June, nine did. The median year-end fed funds projection moved from 3.4% to 3.8%, implying at least one additional 25-basis-point hike before December. The probability of a hike by September, priced by fed funds futures, jumped from 35% to 77% within 24 hours of the statement.
The Fed statement was completely overhauled. Warsh stripped out all forward guidance and hints of future rate cuts, replacing them with a neutral text of "just the facts." For a market accustomed to a decade of strict guidance, this deliberate ambiguity acts as its own form of monetary tightening by increasing the uncertainty premium in asset prices.
Additionally, Warsh refused to submit a rate projection for the "dot plot." By withholding his forecast, he signaled his view that these projections create a false sense of precision, causing markets to trade Fed predictions rather than actual data. His new task force to revamp Fed communications is the first major step toward a less predictable, more data-driven central bank.
EUR/USD: Dollar Resurgence, Euro Under Pressure
Following the FOMC decision, EUR/USD plunged from 1.1590 to a 10-week low of 1.1450 by June 18 a drop of roughly 140 pips. This pushed the pair into the lower half of its 1.14 - 1.20 range, while the US Dollar Index (DXY) broke above 100 for the first time in over a year.
The market driver was direct: a hawkish dot plot widened the policy divergence between the Federal Reserve and the European Central Bank. Although the ECB had raised rates by 25 basis points on June 11, its guidance remained neutral. With the Fed now open to further hikes while the ECB nears the end of its tightening cycle, the interest rate differential is widening again. This shifting rate differential remains the most reliable long-term driver pushing EUR/USD downward.
Bitcoin: Sell the (Hawkish) News
Ahead of the FOMC meeting, Bitcoin consolidated between $65,000 and $66,900 under "extreme fear." Following the Fed's hawkish rate hold, BTC fell 2.2% to $64,150, while Ethereum dropped 3.6%.
The sell-off reflects a higher-for-longer rate outlook and a stronger US Dollar Index breaking above 100, both of which increase the opportunity cost of holding crypto. However, losses were minimized by defensive market positioning and Kevin Warsh’s decision to withhold his individual "dot" forecast, which introduced market ambiguity. Bitcoin's immediate support rests at $62,000, with resistance at $67,000.
Gold: The Hawkish Real Yield Trap Continues
Following the June FOMC meeting, Gold fell 1.5% from $4,370 to around $4,280–$4,330. As of June 19, XAU/USD trades near $4,280 - $4,312, which now form a heavy technical resistance zone. Gold remains in a corrective phase, trading roughly 23% below its January 2026 all-time high of $5,597.
The drop confirms a familiar 2026 macro loop: War → oil → CPI at 4.2% in May (highest since April 2023) → Fed cannot cut → nominal yields elevated → real yields elevated → gold (which pays no yield) loses its relative appeal.
The Fed's hawkish dot plot reinforced this channel by signaling that real yields will stay restrictive for longer. While the structural bull case remains intact - driven by heavy central bank buying (244 tonnes in Q1 2026) and major bank price targets of $5,400 - $6,000 Gold's next major leg up requires either a geopolitical ceasefire that drops oil prices or an official Fed pivot. Neither happened on June 17.
The Triangle: How the Three Assets Are Interconnected
EUR/USD, Bitcoin, and Gold do not move in isolation. The June 17 FOMC illustrated how a single policy event moves all three through the same underlying mechanism - but in different magnitudes and with different nuances.
Dollar strength (DXY +0.6%) — EUR/USD: direct negative (higher USD → lower EUR/USD); BTC: indirect negative (dollar alternative appeal falls); Gold: direct negative (dollar-denominated commodity costs more).
Real yields rising (+10bp short) — EUR/USD: positive for USD (widens rate differential vs ECB); BTC: negative (higher opportunity cost); Gold: direct negative (core inverse relationship).
Removal of easing bias — EUR/USD: hawkish USD signal, medium-term; BTC: removes future liquidity narrative; Gold: extends real yield pressure timeline.
Warsh withheld dot — EUR/USD: ambiguity limited further USD gains; BTC: partial offset (some saw it as dovish); Gold: no offset (data-dependent policy extends uncertainty).
The key observation: EUR/USD fell the least in percentage terms but carries the most direct structural sensitivity to rate differentials. Bitcoin fell the most in terms of recent trading range disruption. Gold's decline was the most technically significant - it confirmed that the corrective phase from the January ATH is intact and that the $4,400 resistance zone is holding.
Key Events to Watch
Jun 27, 2026 — US PCE Inflation (May): The Fed's preferred inflation gauge. Above 3.5% strengthens the case for a September hike and hits all three assets; below 3.0% could trigger a relief rally across the triangle.
Jul 3, 2026 — US Non-Farm Payrolls (June): The second variable the Fed is watching. A strong print (200k+) with unemployment at 4.3% = no dovish pivot; a miss (<100k) could shift the balance toward a hold or cut.
Jul 8, 2026 — ECB Rate Decision: If the ECB holds while the Fed signals hikes, EUR/USD breaks further below 1.14; if the ECB signals an end to its cycle with a hike, the divergence narrows and EUR/USD finds support.
Jul 10, 2026 — US CPI (June): The most direct gold and BTC catalyst. May CPI was 4.2%; a June reading above 4% = further hawkish pressure, below 3.5% = the inflation narrative shifts and risk assets recover.
Aug 2026 — Jackson Hole Symposium: Warsh's first major speech as Fed chair outside a press conference. His address on the Fed communication overhaul will set the tone for Q3 and beyond — all three assets will react.
Sep 15–16, 2026 — Next FOMC Meeting: 77% probability of a hike now priced. If incoming data (PCE, CPI, jobs) validate the dot plot, a 25bp hike is the base case — directly bullish for USD, bearish for EUR/USD, BTC, and gold.
Iran peace deal — ongoing, no fixed date: A comprehensive Strait of Hormuz reopening agreement would collapse oil prices, ease inflation, open a path for rate cuts, weaken the dollar, and trigger a sharp simultaneous recovery in gold and crypto.
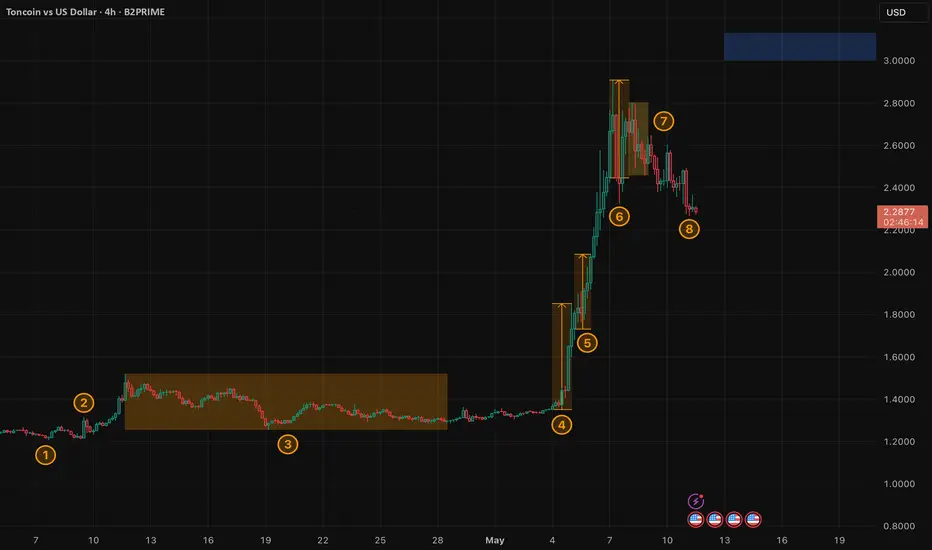
HYPE: +40% in a Week While Bitcoin Drifted. Here's Why.While Bitcoin hovered near $73,000 - $77,000 last week and the broader crypto market slid 3%, one token posted a 40%+ gain and hit a new all-time high: Hyperliquid's HYPE. From around $45 at the start of the week to an ATH of $69.97 on May 31, HYPE added over $11 billion in market capitalization in seven days, briefly overtaking Dogecoin to become the 9th-largest cryptocurrency by market cap. Year-to-date it is up 146%. The reasons behind the move are specific, dateable, and structural - this was not a meme rally.
The Week in Numbers
Early May 2026 (~$25-$40): HYPE recovers from April lows alongside broader crypto market.
May 14-15, 2026 (~$45): Bitwise (BHYP) and 21Shares (THYP) launch first spot HYPE ETFs - combined inflows exceed $109M with zero days of outflows.
May 18, 2026 (~$50): HIP-3 framework live: Trade.xyz launches SpaceX pre-IPO perpetual on Hyperliquid at $150 reference. Hits $203 within hours. $7.1M in volume on day one.
May 21, 2026 (ATH: $62.24): HYPE hits a new all-time high. Grayscale files third SEC amendment for GHYP ETF on Nasdaq.
May 24, 2026 (ATH: $64.27): Goldman Sachs discloses stake in Hyperliquid Strategies Inc. (PURR) worth $3.3M in 13F filing.
May 29, 2026 (ATH: $67.24): CFTC approves first regulated US perpetual futures (Kalshi BTCPERP). Validates Hyperliquid's core model. Brief dip to $62 on competition fears, then recovery.
May 31, 2026 (ATH: $69.97): Hyperliquid's all-time high. Market cap: $17.5B. 30-day trading volume: $188B - more than the next 10 perpetual exchanges combined.
Jun 1, 2026 (~$66-$69): Modest profit-taking. HYPE holds above $60 key support. Grayscale seeking $115M+ in pre-seed for GHYP fund.
Why It Happened: Four Catalysts in Ten Days
1. The first spot HYPE ETFs. Bitwise and 21Shares launched spot HYPE ETFs on May 14-15 (1). Combined inflows hit $109 million with no single day of net outflows. For the first time, regulated institutional capital could buy HYPE through a brokerage account. Grayscale's parallel progress - a third SEC amendment filed on May 22 for the GHYP ETF on Nasdaq, now exploring a staking component - signals a broader ETF product stack is forming around the token.
2. Pre-IPO synthetic markets - SpaceX, Anthropic, OpenAI. Hyperliquid's HIP-3 framework allows anyone to create perpetual futures by staking HYPE. On May 18 (2), Trade.xyz launched a SpaceX pre-IPO perpetual on the platform. SpaceX is targeting a $1.8 trillion valuation at its June 12 IPO. Within hours of launch, the contract moved from a $150 reference price to $203, generating $7.1 million in volume on day one. Hyperliquid is now the only venue where retail traders can gain synthetic exposure to SpaceX, Anthropic, and OpenAI without a brokerage account or accredited-investor status. No incumbent exchange - NYSE, Nasdaq, CME - offers this. The platform is running the unofficial pre-IPO market.
3. Real revenue, not speculation. Hyperliquid has generated $1.16 billion in cumulative protocol revenue, making it the 4th most profitable protocol in crypto - with fewer than 20 employees. Its 30-day trading volume of $188 billion exceeds the combined volume of the next 10 perpetual exchanges. In May, Coinbase and Circle committed to stake HYPE to activate AQAv2, redirecting approximately $80 million per year in stablecoin revenue from Circle/Coinbase to HYPE holders. These are measurable cashflows, not narrative.
4. CFTC validation - double-edged. On May 29 (3), the CFTC approved Kalshi's BTCPERP - the first regulated perpetual futures contract in the US. The initial market reaction was a 3% drop in HYPE, as traders priced in the risk of institutional liquidity moving from Hyperliquid to a regulated US competitor. The dip was brief. The market quickly repriced the CFTC decision as validation of the perpetual futures model itself - the exact business Hyperliquid built offshore precisely because US regulation didn't permit it onshore. Regulatory normalisation reduces HYPE's legal risk more than it creates competitive risk.
What Is Hyperliquid - and Why It's Different
Hyperliquid is a Layer-1 blockchain built around a single product: the world's largest decentralised perpetual futures exchange. Unlike most DeFi protocols - which run on Ethereum or Solana and share infrastructure with thousands of other applications - Hyperliquid built its own chain specifically to run a derivatives exchange at institutional speed. Block times are sub-second. There is no general-purpose VM tax on throughput.
The HIP-3 and HIP-4 frameworks, launched in May 2026, transformed the platform from a crypto derivatives venue into something closer to a global synthetic asset market: perpetual futures on SpaceX, Anthropic, OpenAI pre-IPO prices; RWA open interest exceeding $2 billion; oil contracts (Brent, WTI) on a decentralised exchange.
What Investors Should Watch
HYPE token unlock - June 6 (4). Hyperliquid will release 9.92 million HYPE tokens (approximately 2.54% of circulating supply, valued at ~$684 million at current prices) on June 6. The relative size is modest compared to other recent unlocks, but a $684 million supply addition into a token that just hit an ATH is a natural profit-taking trigger. Watch whether ETF inflows absorb the supply or whether price pulls back toward the $55-$60 zone.
SpaceX IPO - June 12 (5). The SpaceX IPO is the single nearest-term catalyst. If the IPO lands at or above the $1.8 trillion target valuation, the pre-IPO synthetic contracts on Hyperliquid will have proven their price discovery function. That is free marketing for every subsequent HIP-3 market. A delayed or lower-than-expected IPO would test whether the product has intrinsic staying power beyond the SpaceX hype.
Grayscale GHYP approval. Grayscale's third SEC amendment and its $115 million pre-seed round signal serious institutional intent. An SEC approval of GHYP would be the second major ETF gateway after BHYP/THYP, opening HYPE to wealth advisory channels - the same mechanism that re-accelerated Bitcoin's recovery in April. The staking component in the amended filing, if approved, would make GHYP the first ETF offering crypto yield on a non-Ethereum asset.
Competition from regulated venues. Kalshi's CFTC-approved BTCPERP is live. CME and ICE are reported to be accelerating their own perpetual futures products. Hyperliquid's structural advantage - speed, composability, open market creation - is real, but incumbents have regulatory moats and institutional distribution. The next 6 months will show whether Hyperliquid's head start is durable or whether regulated competition erodes its market share. Gold Doesn't Flinch. Why the Iran Strike Moved Nothing.What Happened
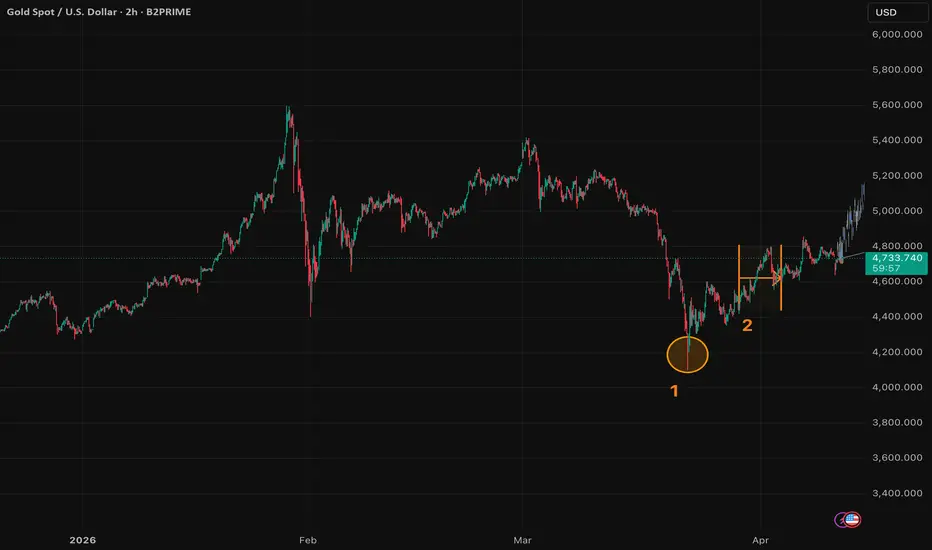
On May 26, US Central Command struck Iranian missile launch sites and mine-laying boats in the Strait of Hormuz. Iran downed a US drone and fired at a fighter jet. Israel simultaneously struck 100+ Hezbollah targets in Lebanon. Secretary of State Rubio acknowledged peace talks were stalled over "disagreements over a word, a sentence." XAU/USD barely reacted, trading near $4,730–$4,750. WTI crude actually fell 4% on the same day - traders chose to focus on the proximity of a deal, not the bombs.
In February, the opening strikes sent gold up 6% in days. The April collapse of Islamabad talks pushed XAU above $4,800. This time: nothing. Since the war began on February 28, gold is down ~13%. Oil is up 50%+. The divergence explains everything.
Why the War Became Gold's Enemy
The logic runs in one direction: war → Strait of Hormuz blockaded → Brent at $107 → CPI at 3.8%, PPI at 6.0% → Fed cannot cut rates → real yields stay elevated → dollar holds firm → gold, a non-yielding dollar-denominated asset, faces macro headwinds on every front simultaneously.
Gold's safe-haven premium assumes temporary stress and eventual easing. In 2026, the stress is itself the source of persistent inflation - which forces the Fed to hold. The war has trapped gold between a geopolitical bid and a macro headwind, and the macro is winning.
Four Reasons Gold Didn't Move
Geopolitical fatigue. The Strait of Hormuz has been disrupted for 13 weeks. Strikes framed as self-defense, targeting no new categories, are priced as status quo - not escalation. Markets price the marginal change, not the existing level of conflict.
Rate expectations dominate. CME FedWatch shows near-zero probability of a June cut. 30-year yields are above 5%. 2-year yields spiked above 4% this week. Every basis point added to real yields is a direct headwind for gold. The macro signal is louder than the geopolitical one.
Positioning is already long. Gold rallied from $4,100 in late March to above $5,000 in early May. The war's safe-haven premium was already embedded. At $4,750, there is no fresh buyer willing to chase.
Where Gold Can Move
Upside - $5,000–$5,100. A credible ceasefire with a Strait of Hormuz reopening timeline would collapse oil, ease inflation expectations, open the door for Fed cuts, weaken the dollar, and send gold sharply higher. Technical trigger: a sustained close above the 50-day SMA at $4,914.
Downside - $4,400–$4,580. A May CPI print above 4% (due June 11) would price a real probability of a Warsh-era rate hike. The 100-day SMA at $4,673 is the first line of defense. A break below $4,580 reopens the path toward the March lows near $4,100.
Base case - $4,700–$4,800. Talks alive, inflation sticky, Fed on hold, dollar flat. Gold oscillates between its moving averages, waiting for a decisive catalyst in either direction. The highest-probability scenario - and the least satisfying one for a metal that should be rallying on every headline this week.
Gold's muted reaction to May 26 is not a mystery. The war has become its own headwind: the longer it runs, the higher oil stays, the higher inflation prints, and the longer the Fed is pinned at restrictive rates. The safe-haven bid is being cancelled by the macro consequence of the very event that should trigger it. Gold needs the war to end to rally - not to escalate.
Cross Margin vs. Isolated Margin: Which One Is Best For You?Margin trading has cemented itself as one of the best trading mechanisms to level the playing field for small and medium-sized traders. With this popular mechanism, traders can acquire long and short trading positions without possessing significant investment funds. This mechanism has effectively filled the gap between the whale traders and common folk.
Despite the effectiveness of margin trading, it is a considerably complex practice. Traders who wish to adopt this strategy must understand its different subsets and significant risks tied to the practice.
Key Takeaways
Margin trading allows investors to multiply their profits by acquiring more buying power from brokerage firms.
Isolated margins are great options for traders wishing to hedge risks and isolate their trading strategies.
The cross-margin position provides more financing options for investors, letting them maximise their capital efficiency.
Selecting a superior option between the cross and isolated margins depends on your specific trading tactics and patterns.
Understanding the Margin Trading
Margin trading represents a unique opportunity for traders with limited budgets. It allows traders to take up positions way beyond their financial capabilities, thus increasing their potential buying power exponentially. The non-margin buying power of traders always equals their free cash reserves for investing purposes. So, if investor X holds $10,000 in their investment deposit, their buying power equals their immediate cash assets.
However, traders often need to go beyond their financial capabilities to reap significant profits on the forex or crypto markets. After all, nobody wants to waste their masterful trading strategies on minuscule profits. Thus, numerous investors convert their insufficient capital into a margin account, where they can effectively multiply their buying power several times over. Of course, this method comes with considerable strings attached.
Brokerages that provide a leveraged position for traders expect to be compensated in due time. They also put heavy restrictions on the open positions. Simply put, if traders keep a losing position that reaches a certain threshold, brokers can seize the trader's entire account balance. So, this trading mechanism is not without its substantial risks that interested traders should thoroughly analyse.
Essential Concepts and Terms in Margin Trading
As mentioned above, this practice is highly effective but has significant challenges and risks of losing an entire investment. Thus, it is important to understand the whole process inside-out to make diligent moves.
Starting with the Basics
To open a trading account, investors must provide an initial margin for a gateway capital investment to enter the initial position. Brokerages of different scopes and sizes require varying initial investments. For large-scale brokerages, the initial fees are pretty high, as they aim to accommodate wealthy traders. However, numerous digital brokerages offer relaxed initial requirements, allowing smaller traders to utilise this mechanism.
After setting up the account, it is crucial to understand the leverage ratio. Simply put, a brokerage firm will supply traders with leverage at least twice the amount of their initial investment. So, if you put down $10,000 as initial capital, your buying power will be at least $ 20,000. However, margin lines are risky if they provide a massive leverage ratio. As a rule of thumb, you should remember that a higher leverage ratio invites more trading risks into the equation.
Strategies, Maintenance, and Margin Calls
After acquiring leverage and increasing buying power, traders can open up margin positions, purchasing financial assets to receive a margin return. There are two popular strategies in this case - long and short. The former pertains to purchasing assets likely to increase in price, and the latter banks on the contrary.
All traders must keep a healthy maintenance margin regardless of the acquired positions. A maintenance margin refers to the minimum required deposit that must be put down as long as the open position exists. It effectively serves as collateral for brokerage firms that provide leveraged positions for traders. In some instances, brokerage firms have special margin requirements, often related to more volatile financial assets. Even a slight decrease in their valuation can trigger a margin call event, practically a game-over state.
But what is the margin call, anyway? It is a warning sign for traders who have gone over to the losing side of margin positions. Suppose investor X has opened a margin position to purchase and sell Crypto A in three months. Investor X is betting on Crypto A's appreciation in that period.
However, if Crypto A hits a growth slump and goes in the opposite direction, investor X will be left with a losing position. If the overall value of purchased assets exceeds the broker's threshold, investor X will receive a margin call. Once losses stack up and the threshold is crossed, brokers will issue a stop loss or IOC orders, seizing the entire margin trading account of the investor.
Thus, margin trading in crypto and conventional markets is a double-edged sword. It amplifies the profits from intelligent trading strategies and dramatically increases the potential losses.
Fast Fact
Both cross margins and isolated margins are extremely effective practices in their own right. The former accommodates traders who wish to acquire more trading leverage, and the latter supports investors who wish to mitigate their risks.
Cross Margin vs. Isolated Margin
Margin trading can be divided into two popular types - isolated margin trading and cross-margin trading. Both subsets have strengths and weaknesses, and choosing the superior option depends on your unique strategies. Cross and isolated margins represent two sides of the same coin, offering two mutually exclusive approaches to investors.
What is Isolated Margin?
As outlined above, this practice always includes amplified risks of portfolio losses through a stop-loss order. Naturally, many investors are uncomfortable with losing an entire account balance due to a single losing position. Additionally, numerous traders would love the option to utilise their leveraged buying power for different strategies that don't have overlapping margin call risks tied to them. For such investors, an isolated margin is a perfect choice.
The isolated margin mode allows investors to open up several leveraged positions on the market without shared risks. Suppose that investor X wants to short Crypto A but also wishes to acquire a long position on Crypto B. With isolated margins, both strategies can be achieved by dividing the leveraged capital. If one isolated margin position goes under, the other can still provide profits without experiencing a stop-loss order.
Thus, isolated margins provide the freedom of choice with leveraged capital, letting investors diversify their strategies without compounding the stop-loss order risks.
What is Cross Margin?
While isolated margins provide diversity and many options, they have one considerable drawback. By dividing their leveraged buying power into several positions, traders will likely experience razor-thin margin call ratios. Each position will have much less wiggle room before the brokers notify the investors with a margin call.
Thus, brokerage firms developed an updated offering - the cross-margin mode. This variation also allows investors to pursue different positions with a single leveraged account. However, with cross margins, every position is accumulated into a single amount when calculating the margin call ratios.
So, while traders get to place their trading positions separately, brokers will evaluate their margin call thresholds in aggregate. With this method, traders will have less trouble obtaining liquidity to finance their new trading strategies. However, the cross margin is not a Pareto improvement over its isolated counterpart, as it contains significant default risks for the entire portfolio. Since the brokerage firm views the cross-margin account as singular, a stop-loss order will result in the seizure of the entire portfolio instead of the relevant fractions.
Even if a particular trader has several winning positions, they might lose their account assets if the overall margin ratio is low enough. Thus, cross-margin substantially increases the financial capabilities of investors, but it also invites the risk of portfolio-wide losses.
Comparing the Two Trading Methods
As discussed above, both cross and isolated margins have their own merits. Determining a better option between these two is impossible without considering your unique trading strategies.
Cross margins are great options to open up many trading positions without capital constraints. They also allow traders to utilise their winning positions to finance new ones. However, the cross mode can become extremely costly if the unfortunate margin call occurs.
Conversely, isolated margins let investors mitigate risks and execute trading strategies in a vacuum. With this method, new trading positions will not influence the old ones, allowing investors to take bigger risks without fearing a portfolio-wide margin call. So, isolated margins enable traders to experiment with new strategies without endangering their cash cows and reliable trading positions.
Choosing between these options must follow your distinct trading approach and philosophy. For some traders, it is vital to acquire substantial buying power to reap sufficient profits. Others prefer to build their portfolio up patiently and employ risk-averse strategies. Thus, investors must analyse their trading practices to decide which method complements their efforts flawlessly.
Smart Cross Margins - The Next Logical Step in Margin Trading?
Finally, the newest variation in this niche is the smart cross margin, which allows traders to offset the initial capital requirements if their positions are on opposite sides. Suppose investor X wants to open a long position on Crypto A. They also have numerous positions open on different crypto assets. Investor X also opens a short position on Crypto A to mitigate their risks. In standard conditions, the broker would demand separate initial investments on both long and short options from investor X.
However, with smart cross margins, the broker platform realises that the above positions cancel each other out. Thus, smart cross margins will considerably lower the total initial investment. This novel approach allows investors to hedge their bets without requiring additional capital. Considering that the standard cross-margin trading is famous for its amplified risks, the smart version is a marked improvement over the conventional cross-margin system.
Is Margin Trading a Good Idea?
After diving into the nature of margin trading and exploring its subtypes, it is time to answer the main question - is it a great strategy overall? The answer depends on your preferences as a trader. Margin trading generally improves the potential earnings from successful strategies but also proportionally increases the risks. For wealthy traders, acquiring the margin positions might be unnecessary, as their existing portfolio can produce lucrative returns without artificially increasing the buying power.
However, if a given investor only has a limited budget, say $10,000, at their disposal, this mechanism might be the only option to generate respectable returns in a calendar year. With this method, intelligent investors will not be constrained by their immediate cash reserves.
Suppose investor X is confident that crypto will experience a 20% price spike in the next two months. With only $10,000 in buying power, all they can receive from their foresight is $2,000 worth of returns. However, with amplified buying power, they can potentially earn multiple times the profit. However, if the prediction is ultimately proven wrong, investors can lose much more than they would in non-margin conditions.
Thus, the double-edged nature of margin trading persists, and it is vital to have enough experience to utilise this complex mechanism successfully. Additionally, traders should carefully consider the broker options on the market. Numerous brokerage firms offer different terms, including initial investments, maintenance margins and leverage ratios.
While acquiring the best margin rates is always good, traders must evaluate the overall picture and ensure their broker is highly reputable. Finally, investors must evaluate how much margin ratios they require. Acquiring too much leverage can lead to needlessly amplified losses in the long term.
Final Thoughts
Margin trading is an excellent option for investors who wish to compound their potential profits and earn extra returns for their diligent strategies. Both cross and isolated margins serve unique purposes in this field, accommodating different investor tactics. Choosing between these subsets depends on the preferred investment decisions and trading patterns. Both options come with considerable advantages and downsides. Thus, traders must correctly evaluate their strategies and determine which option will fit their needs like a glove. Understanding Latency Arbitrage in Forex TradingThe quest for profit has driven traders to explore increasingly sophisticated strategies. One such strategy used in the Forex market is latency arbitrage. This technique has the potential to generate substantial gains, but it also carries considerable risks.
In this article, we will delve into the intricacies of latency arbitrage and examine its benefits and drawbacks.
Key Takeaways
Latency arbitrage is a trading strategy that exploits time delays between different brokers’ price feeds.
This strategy requires significant technological and infrastructure investments, including high-speed connection, powerful computing hardware, and Forex arbitrage software.
Industry participants and platforms implement measures and tools, such as advanced trading algorithms and averaging functions, to mitigate the effects of this practice.
What Is Latency?
Latency refers to the time it takes to transmit information across a network.
In Forex, this delay is the difference between a trader receiving a price quote and the actual execution of a trade. The lower the latency, the faster the signal reaches its destination and the more advantageous the trading position.
Why Is Low Latency Important?
Institutional investors, such as hedge funds and investment banks, have recognised the importance of low latency in trading. These players invest heavily in high-end programs and hardware, including fast internet connection, co-location services, and powerful computing hardware, to minimise the time it takes to receive and act on market data.
By reducing latency, they gain a significant edge over their competitors, particularly retail traders, who may be hampered by slower internet speeds and less advanced technology.
The Latency Arbitrage Strategy
Latency arbitrage is a technique utilised to capitalise on time-delay variances between brokers or exchanges. The possible profit margin, albeit small, is derived from these minuscule price discrepancies as trades are quickly deployed.
The process of latency arbitrage typically involves the following steps:
Surveillance of multiple price feeds: Through the use of advanced software and algorithmic solutions, traders are equipped to persistently observe different brokers or exchanges for any inconsistencies in their price feeds.
Recognition of price gaps: The moment traders spot a difference in price among two or more sources, they swiftly move to implement a trade, thus taking advantage of the disparity.
Trade execution: In order to fully exploit the discovered price difference, traders must implement the trades with utmost speed, often in a matter of milliseconds, before the disparity evaporates.
Pros
The primary advantage of latency arbitrage is its ability to generate consistent profits. Additionally, this practice can be used as a risk management tool, as traders can limit their losses by using stop-loss orders.
Cons
Even with its potential rewards, latency arbitrage trading is not without its risks. The strategy requires a large amount of investment in technology and equipment, as well as a thorough knowledge of market dynamics and trading algorithms. Additionally, the fleeting nature of price discrepancies means that traders must act quickly and decisively, leaving little room for error.
Fast Fact
A 2020 research conducted by the Financial Conduct Authority (FCA) in the United Kingdom revealed that latency arbitrage contributes to a dip in the total volume of transactions on worldwide stock markets. Consequently, the practice is responsible for a loss of up to $5 billion annually on global exchanges.research conducted by the Financial Conduct Authority (FCA) in the United Kingdom revealed that latency arbitrage contributes to a dip in the total volume of transactions on worldwide stock markets. Consequently, the practice is responsible for a loss of up to $5 billion annually on global exchanges.
Latency Arbitrage in Action
To better understand the concept, consider this Forex latency arbitrage example:
A trader analyses several price feeds for a EUR/USD currency pair and sees a discrepancy. One broker is offering a bid price of 1.1000, while another has an ask price of 1.0995. The difference between these prices may seem negligible, but for high-frequency traders, it presents an opportunity.
The investor quickly executes a buy order at the lower asking price and simultaneously sells to the other broker at the higher bid price, pocketing a profit of 0.0005 per unit within milliseconds.
Over time, HFT firms using this strategy can generate significant profits by executing a high volume of trades with small margins.
Technology in Latency Arbitrage
The success of a latency arbitrage strategy is heavily dependent on the technological capabilities of a trader. Sophisticated software, fast connection, and powerful computing hardware are all essential components of an effective execution of the method.
Data Centers and Co-location
As mentioned earlier, being close to exchange servers is a crucial factor in reducing latency. Traders who can co-locate their servers within the same data centres as the exchanges they trade on have a substantial advantage over their peers.
Forex Arbitrage Software
Specialised Forex latency arbitrage software is another essential tool for successfully implementing the strategy. These programs continuously monitor multiple price feeds, detect price discrepancies, and execute orders automatically at lightning speed.
Virtual Private Servers
To further reduce latency, traders often use virtual private servers (VPS). These are servers hosted in the same data centres as the trading servers, minimising the distance the signal has to travel and increasing the speed of trade execution.
Plugins and Robots
Plugins and automated trading systems can also be used to enhance the effectiveness of Forex arbitrage strategies. Using tools like Latency Arbitrage EA for MT4, traders can access additional information about price quotes and automate the trade execution process, reducing the time it takes to identify and capitalise on price discrepancies.
The Dispute Over Latency Arbitrage
Latency arbitrage is considered a controversial trading technique among brokers and other market participants.
Brokers' Perspective
Brokers often perceive latency arbitrage as unsavoury, terming it as "toxic flow", and typically do not endorse the practice. In an attempt to alleviate the effects of latency exploitation across varying trading platforms, brokers have created intricate tools and strategies. Numerous brokers have gone as far as explicitly forbidding the strategy on their websites and may even suspend the accounts of those traders suspected of employing latency arbitrage tactics.
Some platforms have implemented counter measures to temper the impact of latency manipulation. These efforts span from enforcing delays between order submissions and processing to the utilisation of refined analytics and algorithms intended to detect and neutralise arbitrage activity.
Regulatory Apprehensions
Is latency arbitrage legal? The legality of latency arbitrage has raised eyebrows among regulatory bodies. Their fear stems from the strategy's potential to manipulate market prices and compromise the integrity of the trade environment. As a remedy, some governing bodies have implemented measures, including the imposition of minimum rest times for orders or enacting trading pauses to curb swift price fluctuations.
Ongoing Ethical Discourse
The ethical ramifications of employing latency arbitrage strategies continue to fuel debate. Some latency arbitrage traders defend the strategy as a lawful way to capitalise on market inefficiencies. Others, however, perceive it as an unfair leg-up that destabilised the credibility of the financial markets.
Combating Latency Strategies
Popular Forex trading platforms like MetaTrader 4 (MT4) and MetaTrader 5 (MT5) have become increasingly aware of the impact of latency arbitrage on the fairness and integrity of their platforms. As a result, they have implemented measures to combat this practice and level the playing field for all traders.
One of the ways platforms like MT4 and MT5 combat latency arbitrage is through their advanced algorithmic technology. These algorithms can identify and flag suspicious trading patterns, including delay arbitrage activity. This allows the broker to take action in order to prevent any potential market manipulation.
In addition, popular trading platforms also offer tools and features that can help market participants identify and respond to latency-induced price discrepancies. For example, the averaging function on MT4 smooths out price fluctuations, making it more challenging for traders to exploit small differences in prices between various markets.
Conclusion
Latency arbitrage is a complex topic within the world of Forex trading. Some view it as a legitimate means of profiting from market imperfections, while others see it as market manipulation or unfair advantage. Overall, the industry is continually evolving to balance the playing field and provide fair trading opportunities for all participants.
FAQ
What are anti-latency arbitrage mechanisms?
Anti-latency arbitrage (ALA) mechanisms are proactive strategies implemented to prevent opportunistic profit-seeking through exploiting delays in market data. This helps promote fair and equal access for all traders, reducing the advantage of high-frequency trading tactics.
What is time arbitrage?
Time arbitrage is a strategy used by investors to take advantage of the short-term fluctuations in stock prices, while keeping a long-term perspective on the company's prospects.
How does HFT work?
High-Frequency Trading, frequently abbreviated as HFT, is a trading approach that employs sophisticated algorithms and progressive technology to carry out an enormous volume of trades in a brief timeframe. Financial establishments and institutional investors often adopt this strategy to hasten the buying and selling of securities.  Education
Wrong Time to Be a DoveKevin Warsh was confirmed 54–45 by the Senate on May 13 - the most partisan Fed chair vote in US history. Trump nominated him amid market expectations of potential rate cuts. The problem is the data. April CPI came in at 3.8%, the highest since mid-2023. PPI surged 6.0%. Oil is above $107 per barrel with the Strait of Hormuz still blocked.
The Main Challenge He Cannot Ignore
Inflation versus the mandate. The Fed has missed its 2% target for more than five years. The Middle East energy shock has pushed headline inflation to 3.8%, with shelter costs doubling in April and producer prices at their fastest pace since December 2022. Warsh's official line - that the shock is temporary - is plausible but fragile. Every week the Strait of Hormuz stays blocked makes it harder to argue.
Four Scenarios for Rates - and the Dollar
Hawkish Hold
Conditions: Inflation > 3.5%; Strait of Hormuz blocked; FOMC shifts toward tightening.
Rate Path: Rates held at 3.5–3.75% through 2026; possible hike to 4.0% in Q4.
USD Impact: USD strengthens; higher-for-longer attracts capital. DXY may test 107–110; EM currencies face pressure.
Base Case: Cautious Hold
Conditions: Inflation moderates to 3.0–3.2% by Q3; oil retreats to $85–90 on partial ceasefire; Warsh builds consensus for 1–2 cuts in H2.
Rate Path: First cut in September or November; fed funds at 3.0–3.25% by year-end.
USD Impact: USD weakens modestly; DXY drifts toward 100–102. Gold and commodities benefit; orderly adjustment.
Dovish Acceleration
Conditions: Ceasefire holds; oil drops to $75; CPI falls to 2.5% by Q3; Warsh pushes 2–3 cuts.
Rate Path: Cuts begin early (June/July); fed funds reach 2.75–3.0% by year-end.
USD Impact: USD weakens sharply; DXY tests 95–97. Gold rallies; dollar credibility risk rises if cuts seem politically driven.
Stagflation Trap
Conditions: Energy shock persists; growth slows < 1%; inflation > 3.5%; FOMC paralyzed between mandates.
Rate Path: Rates unchanged; no consensus; committee splits publicly.
USD Impact: USD volatile and directionless; bond market dysfunction risk. Challenges Fed credibility and reserve currency status.
The scenarios above are illustrative and based on current available information. Actual outcomes may differ materially. This does not constitute investment advice.
What It Means for the Dollar
The DXY has been range-bound near 101–104 since March - a market that has priced out both aggressive easing and aggressive tightening. That equilibrium is fragile. A clear signal of even one cut in H2 may push the dollar lower, potentially benefit gold, and may relieve pressure on emerging markets. A forced hold or hawkish pivot may strengthen the dollar and could keep global financial conditions tight.
The deeper risk is structural. With the US running an estimated $1.7 trillion annual deficit (CBO, FY2025 projection) and Treasury issuance at record levels, markets are already asking questions about long-term dollar demand. If Warsh is seen cutting for political reasons - or paralysed by a committee he cannot lead - the result may not be a straightforwardly stronger or weaker dollar, but rather a dollar that some investors may begin to reassess as a reserve asset. That is the slow-moving risk beneath every rate scenario, and it is the one that neither Warsh nor the White House can afford to trigger.
Warsh was nominated to ease. The data is telling him to hold. His June 16–17 meeting may provide an early indication:: hawkish discipline may support the dollar, dovish capitulation may weaken it, and any sign of political interference could erode the Fed credibility that underpins both. For macro and FX traders, the Warsh era opens with significant uncertainty around Fed direction not seen since 2022.
Reading the Market Depth ChartTrading in the financial markets entails carefully analysing price actions, market inputs, movements and more data. Traders use every possible tool and chart to narrow their research and identify potential trading opportunities.
Reading charts can be an important part of a trader's workflow, combining various investment strategies with technical indicators and assessing potential price movements or assess market efficiency.
Understanding the market depth chart enables traders to evaluate the market and its efficiency in executing buy/sell orders, especially with assets with changing volume and liquidity levels. Let’s get into the details of the market depth chart and how you can use it.
Key Takeaways
The market depth chart is a graphical representation of the order book, depicting the pending buying and selling orders on a specific asset.
The depth chart is split between buy and sell walls, which represent the demand and supply changes and patterns.
Understanding the market depth chart can support trading decisions and the assessment of liquidity and market sentiment.
What is Market Depth?
Analysing market depth is a commonly referenced part of analysing financial markets, which is done before making trading decisions, especially for executing significantly large buy or sell orders.
Previously, brokers on trading floors would shout and raise their hands to execute market orders, manually processing their buying and selling transactions through telephones.
However, since everything has become digitalised, buying and selling orders are being listed on electronic trading platforms. Today, traders and brokers can take a look at the order book to analyse the market depth and evaluate liquidity patterns and changes.
Analysing market depth level can be relevant, especially in markets with high liquidity levels, such as Forex, commodities and stocks, where a slight change in the liquidity pattern can impact the asset price.
By looking at the market depth numbers, a market is “deep” when there are many buying and selling orders placed and pending fulfilment.
However, it is vital to note that a fair balance must be maintained between the buying and selling activities, which affect the supply and demand dynamics and, therefore, the market prices.
Market Depth Chart Explained
The market depth chart is a graphical representation of the order book, showing the price trends and patterns that change as pending orders and liquidity fluctuate.
The chart shows the demand and supply levels, marked on two axes, X and Y. The X-axis represents the market prices, while the Y-axis represents the amount of pending orders.
The chart enables the trader to understand the price changes and fluctuations in the demand and supply patterns. Thus, traders can evaluate the efficiency of investing in the given security.
The chart is split between two sides, left and right, representing the demand and supply of different price levels. In the best scenarios, both sides of the chart would be balanced or almost symmetrical.
Any uneven tendencies will be depicted as the graph skews to either side, representing a market shortage or excessive liquidity.
Importance of Market Depth Price Chart
This analysis may be used to assess current and potential market directions and identify support and resistance levels, which assist investors in creating their trading strategies.
If the depth chart is tilted to the left, it means that the asset is illiquid, and the price may increase if demand continues to exceed supply. On the other hand, if the chart is tilted to the right, it means the asset is sufficiently liquid, and prices may stabilise or decline where supply exceeds demand.
Traders can use this information to place suitable market orders. For example, if the chart is skewed to the left, it means there are more buying orders than selling, resulting in a lack of liquidity. Thus, the product is becoming illiquid and is more likely to increase.
Some traders may assess whether placing a buy order aligns with their approach, given the potential for upward price movement.
Elements of Market Depth Chart
This chart type is very straightforward, clearly depicting what the trader is looking for. However, understanding its elements and dynamics is important. Here’s what you can find in the depth chart.
Buy wall: depicted on the left side of the vertical axis. The buy wall represents the cumulative value of buy orders placed on the given security at different price levels. The buy line is highlighted in green and has a declining trend from the left to the right.
Sell wall: depicted on the right side of the vertical axis. This sell wall represents the cumulative value of the sell order placed on the given asset at different prices. The sell line is highlighted in red and has a declining trend from the right to the left.
Vertical Y-axis: This axis represents the price level at which the pending buy/sell orders have been placed.
Horizontal X-axis: This axis represents the volume of the pending buy/sell orders that have been placed.
Mid-market price: The mid-market price is the middle price point between buying and selling or the average between the highest bidding price and the lowest asking price.
Market Depth Chart Indicator
The market depth indicator works by hovering over the chart, which reflects the number of assets that can be bought or sold at a given price point at that specific time. This indicator also shows the cost of executing the market order and the implications on the market value.
Fast Fact
The market depth represents level 2 data (previously Nasdaq Quotation Dissemination Service), which is a subscription-based model allowing companies to access the bidding and asking market prices.
How to Read a BTC Market Depth Chart
Reading the Bitcoin depth chart is important since the crypto market is highly speculative and volatile, and investors’ decisions and overall sentiment highly impact the market orders. Here’s how the BTC buy and sell walls work.
Buy Wall
The height of the buy wall changes according to the number of unfulfilled purchased orders for Bitcoin at a selected price. When the buy line is significant, it indicates that buyers believe that the BTC price will not fall below a certain level.
Traders may increase their buying activity when they observe a bullish market depth chart, which could contribute to further upward price movement.
Sell Wall
Similar to the buy wall. The high sell wall rises according to the number of unfulfilled selling orders for Bitcoin at a certain price. A low sell wall indicates that most crypto traders are holding on to their assets and are not selling now because they anticipate the Bitcoin price will increase.
A large sell wall may help limit sharp upward price movements and could contribute to price stabilisation.
Market Depth vs Order Book
The order book and the market depth chart meanings are almost the same. Both provide insights into the pending market orders. However, they differ in how they represent data and their implications on the traders’ decisions.
Data representation: Depth charts graphically represent order book data, providing an overview of demand and supply patterns. On the other hand, order books offer a detailed view of every pending buy/sell activity at various price points.
Accessibility: The depth charts are available at most trading platforms, and any user can apply the price chart, while order books are only accessible to a selected type of traders, such as liquidity-providing firms and market makers.
Use cases: The market depth chart usually works for short-term investment decision-making by looking at price patterns and changes. The order book is more detailed, enabling traders to understand the market dynamics profoundly and look at different supply and demand patterns over time.
Conclusion
The market depth chart is a visual representation of the order book, depicting the changes in supply and demand patterns and assisting traders in understanding market dynamics and anticipated liquidity shortage or surplus.
The depth chart shows the number of buying and selling orders placed by market participants at different price levels, helping traders in decision-making by analysing possible bullish or bearish market movements.
Analysing the depth chart is crucial regardless of the studied asset class. However, it is mainly applied to markets with high liquidity, such as the commodity and currency markets.
Education 
April CPI Preview: Three Scenarios for the $97/Barrel EconomyCross-Asset Scorecard
Brent Crude: $104.01 | WoW: -3.7% | MTD: -3.4% | YTD: +73.3% | S: $97.00
WTI Crude: $97.97 | WoW: -3.9% | MTD: -3.7% | YTD: +65.2% | S: $92.00
Gold: $4,700 | WoW: +2.1% | MTD: +0.9% | YTD: +23.7% | R: $4,800
BTC: $80,704 | WoW: +0.4% | MTD: +0.4% | YTD: +17.5% | R: $85,000
ETH: $2,400 | WoW: +0.8% | MTD: +0.8% | YTD: -7.6% | S: $2,250
EUR/USD: 1.1750 | WoW: +0.2% | MTD: +2.8% | YTD: +8.0% | S: 1.1600
USD/JPY: 158.50 | WoW: -0.5% | MTD: -1.5% | YTD: +3.0% | S: 156.00
DXY: ~97.8 | WoW: -0.3% | MTD: -2.6% | YTD: -6.3% | S: 96.50
S&P 500: ~7,250 | WoW: +0.7% | MTD: +2.4% | YTD: +6.8% | S: 7,000
10Y Yield: 4.38% | WoW: +3bps | MTD: +5bps | YTD: — | R: 4.60%
S = Support | R = Resistance Sources: CNBC, Bloomberg, BLS (May 8, 2026), Reuters. Data as of May 10–11, 2026
Risk Dashboard
10Y Yield: Value: 4.38% (+3bps WoW) | Notes: Fed hold: 95.9% probability (June).
10Y Real Yield (TIPS): Value: ~1.93% | Notes: 4.38% nominal – 2.45% breakeven (Fed H.15, May 8).
DXY: Value: ~97.8 | Notes: Weakening — two-month low since April.
FedWatch June: Value: 95.9% hold | Notes: Rate hike by Apr 2027: ~40%.
Oil Geopolit: Value: Fragile ceasefire | Notes: US-Iran fire exchange Strait of Hormuz, May 8.
CPI Event: May 12, 08:30 ET | HIGHEST IMPACT of the week.
Positioning Snapshot (vs prior week)
FedWatch: June 95.9% hold | Hike probability rising (~40% by Apr 2027)
BTC ETFs: +$630M first day of May | Apr total: +$2.44B (AMBCrypto)
Gold: Net long elevated after +3% bounce from $4,600 lows
Oil: Brent at $104 after 7%+ plunge on May 6 Iran deal reports, then recovery
PTJ (CNBC, May 7): "No chance Warsh will get Fed to cut rates"
What Moved What
Iran deal reports (May 6) → WTI: -7% to below $97 — Axios: US believed closing in on deal; oil erased week's gains in one session
NFP April +115K (May 8, BLS) → USD: mild firming; equities: steady — Beat Dow Jones consensus of +55K (Bloomberg); broader est. 62K (FXStreet). Wages: 3.6% YoY (miss vs 3.8% est.)
Hormuz fire exchange (May 8) → Oil: +2.7% reversal to $97.97 WTI — Ceasefire violation cast doubt on Iran deal timeline; risk premium returned
Week Ahead: May 11–17, 2026
Mon 11: No major US releases; Impact: Low.
Tue 12 (08:30): US CPI April (headline YoY); Consensus: +3.7–3.8%; Impact: Very High.
Tue 12 (08:30): US CPI April (core YoY); Consensus: +2.7%; Impact: High.
Wed 13 (10:00): US Retail Sales April; Impact: High.
Thu 14 (08:30): US PPI April; Impact: High.
Thu 14 (08:30): Initial Jobless Claims; Impact: Medium.
Fri 15: Various Fed speakers; Impact: Medium.
Key event: Tuesday CPI (08:30 ET). Any deviation from 3.7–3.8% consensus resets Fed expectations for 2026–2027.
When Oil Runs Macro Policy
The most important number of the week lands Tuesday at 8:30 am ET. The Bureau of Labor Statistics releases April CPI data — and for once, the market already knows roughly what to expect. The question is whether reality matches the forecast, and what it does to a Federal Reserve that just held rates with its most divided committee since 1992.
April's headline CPI is consensus-forecast at 3.7–3.8% year-over-year (Wall Street consensus via Kiplinger and HeyGoTrade, May 2026), up from March's 3.3% (BLS, April 10, 2026). That would be the fastest rate of annual consumer price growth since May 2024. Core CPI expected at 2.7% YoY.
This matters because the print lands in an unusually crowded macro context: oil that fell more than 7% in a single session on Iran deal reports, then recovered; a labour market that added 115,000 jobs in April (BLS, May 8) — well above the 55,000 Dow Jones consensus (Bloomberg) — but with wage growth that missed estimates (3.6% YoY vs 3.8% expected); and a Fed with four dissenters at its April 29 meeting — the highest level of internal disagreement since 1992.
Why April's Print Is Structurally Different
The shelter anomaly. The October 2025 government shutdown delayed the inclusion of certain rent growth data into the CPI calculation. The Cleveland Fed Inflation Nowcasting model (updated May 2026) notes that April's CPI will mechanically show elevated monthly housing cost contribution — not because rents accelerated, but because a prior undercount is being corrected. This creates artificial upward pressure in the monthly MoM figure. Analysts expect the anomaly to normalise by June–July.
Energy's direct weight. Oil at $97–104/barrel (WTI and Brent as of May 10, per CNBC) still translates to US regular gasoline well above $4.50/gallon (NBC News, May 2026). March CPI of 3.3% (BLS) was already elevated by geopolitical oil prices; the April consensus of 3.7–3.8% implies energy transmission may be the dominant new input — not services or shelter drift.
Together: a high April reading is not necessarily evidence that the underlying economy is overheating. It may be a mechanical combination of the shelter catch-up and an oil shock already showing signs of easing (Brent fell from $108 to $98 in one week on Iran deal hopes, CNBC, May 6).
Three Scenarios
🔴 Scenario A — Bear Print: Headline above 4.0% YoY
What causes it: Energy contributes more than modelled (April data collection captured peak oil above $105–108). Shelter anomaly larger than Cleveland Fed estimates. Services inflation (medical, insurance) remains sticky.
Probability: ~20% (Robinhood prediction markets, Octagon AI, May 2026)
Market impact:
Treasuries: 10-year yields could spike from 4.38% toward 4.55–4.65%. Short-duration yields may move harder as rate cut probabilities collapse to zero
USD (DXY): Strengthening impulse toward 99–100 on hawkish repricing. Rate hike probability for 2027 (~40% now) could rise toward 55–65%. EUR/USD may test 1.16 support
Gold (XAU/USD): Gold may face selling pressure, potentially testing $4,600–4,620 support. Watch 10-year real yield in the 30 minutes post-release: a spike above 2.10–2.15% may suggest persistent selling pressure; compression below 1.90% — gold may attract renewed buying interest
Equities (S&P 500): Likely gives back 1–2%. Growth/tech most vulnerable on duration sensitivity. Dow 50,000 becomes key psychological support
Bitcoin: Downward pressure if equities sell off. However, BTC has at times shown 24–48h decoupling when a hot print is interpreted as dollar-debasement. Traders may monitor IBIT ETF flow data (published late afternoon, Bloomberg) — April's $2.44B structural demand unlikely to reverse on one print
Oil: Paradoxically muted — high CPI from oil confirms what the market already priced
🟡 Scenario B — Base Print: Headline 3.6–3.8% YoY (in-line)
What causes it: Wall Street consensus correct. Energy and shelter contributions as modelled.
Probability: ~55–60% (Kiplinger, HeyGoTrade, Cleveland Fed Nowcasting, May 2026)
Market impact:
Treasuries: Limited movement. 10-year yields stay in 4.30–4.45% range. Fed hold thesis through June intact
USD: Mild firming or neutral. EUR/USD may hold the 1.17–1.18 range. DXY near 97.5–98.5
Gold: Choppy. Base case already priced — gold at $4,700 may reflect both geopolitical premium and rate-hold thesis
Equities: Relief rally. S&P 500 may grind higher toward 7,300+ after brief morning volatility
Bitcoin: Consolidation in $78,000–$83,000 range. ETF inflow trajectory may continue if risk appetite holds
Oil: Ceasefire dynamics dominate regardless of CPI. Fortune (May 10): "Trump with military option" language has returned
🟢 Scenario C — Bull Print: Headline below 3.5% YoY
What causes it: Energy contribution smaller than modelled — April's oil spike largely occurred in May (ceasefire swings were May 1–8, partially outside April's data collection period). Services disinflation accelerates. Mutual of America projects 3.4% YoY (per Kiplinger).
Probability: ~20–25%
Market impact:
Treasuries: Bond rally. 10-year yields may test 4.15–4.20%. First cut probability repriced for 2026 discussions — potentially 10–15% for June (from near-zero now). Yield curve may steepen
USD (DXY): Could break below 97, testing 96-handle. EUR/USD may test 1.18–1.19 resistance. GBP/USD and AUD/USD could benefit from broad dollar softness
Gold: may face upward pressure. Rate cut repricing + dollar weakness could trigger a gold rally toward $4,800+
Equities: Risk-on scenario. S&P 500 could move toward 7,400+. Duration-sensitive growth stocks may benefit most
Bitcoin: A notable potential beneficiary. If $83,000–$85,000 resistance were to break on volume post-print, the next technical cluster may be near $90,000. April's $2.44B ETF accumulation may provide structural demand support
Oil: Complex. Dollar weakness mechanically bullish, but lower CPI reduces "inflation from oil" narrative. Net effect likely limited
The Fed's Unusual Internal Division
Four dissenters at a single FOMC meeting is a significant signal — the April 29 decision saw Stephen Miran advocate for a rate cut, while Hammack, Kashkari, and Logan voted to hold but opposed any easing bias in the statement. This committee is being pulled in opposite directions: resilient employment (+115K April NFP), rising headline inflation (3.3% March → consensus 3.8% April), softening wages (+3.6% YoY, below estimates), and a geopolitical energy shock distorting every transmission mechanism.
Paul Tudor Jones (CNBC, May 7): "There's no chance Warsh will be able to get the Fed to cut rates." CME FedWatch prices 95.9% probability of hold at June meeting, ~40% probability of hike by April 2027.
Tuesday's CPI may narrow the range. A print above 4.0% may significantly reduce dovish voices at the Fed; a print below 3.5% could reopen the rate cut debate. A print between 3.6–3.8% may extend the current stasis — which is itself the condition traders are navigating.
Cross-Asset Connections for the Week Ahead
The setup for May 11–17 may be shaped by a single transmission chain: oil price → US CPI → Fed reaction function → dollar → all risk assets.
For Gold/USD traders: The critical question is not what CPI prints, but how the market interprets a high number — stagflation (bullish gold) or hawkish repricing (bearish gold). The anchor: 10-year real yield (TIPS yield) currently ~1.93% — calculated as 4.38% nominal minus 2.45% TIPS breakeven (Fed H.15, May 8). Traders may monitor this in the 30 minutes after 8:30 ET: a spike above 2.10–2.15% may suggest downward pressure on gold (only 17–22bp away on a hot print); compression below 1.90% may support the stagflation-premium interpretation and could suggest upward potential toward $4,800+ for gold.
For USD pairs (EUR/USD, GBP/USD, USD/JPY): EUR/USD at 1.1750 is mid-range. Current daily range is 70–90 pips in the elevated volatility regime (in place since February 2026); on a CPI surprise day, expect expansion to 90–130 pips — Traders should be aware that elevated volatility on a significant deviation from consensus may make tight position sizing more challenging. Sizing decisions should reflect individual risk tolerance and objectives. USD/JPY: watch for BoJ response language if USD/JPY threatens 162+.
For Crypto (BTC, ETH): April's $2.44B in net BTC ETF inflows represents a structural demand floor that dampens CPI-related downside. The larger sensitivity this week may be to equity market direction (S&P 500 correlation with BTC has run ~0.55–0.65 in Q1–Q2 2026) rather than the CPI print directly.
For Oil CFDs (WTI, Brent): The dominant driver this week may remain the US-Iran ceasefire status, rather than CPI. The Strait of Hormuz fire exchange on May 8 (CNBC) reversed the 7% plunge from May 6's deal reports. Brent at $104 may reflect the market pricing in a prolonged no-resolution scenario. A signed deal could send oil sharply lower regardless of CPI; a full ceasefire collapse may push WTI toward $110+.
What This Means for Active Traders
Tuesday's 8:30 ET window may generate elevated intraday liquidity across EUR/USD, Gold, US Index CFDs, and Treasury-correlated assets. Traders may consider gap risk when determining position sizes ahead of the release: a deviation of 0.3% or more from 3.7–3.8% consensus may be sufficient to materially reset rate expectations and contribute to significant moves across multiple asset classes simultaneously.
The structural advantage of a unified cross-collateral account is most visible in sessions like this. When a single data print simultaneously moves rates, dollar, gold/oil, and equities in connected but non-identical ways, the ability to rebalance across all four asset classes from a single account — without fund transfers, currency conversions, or settlement delays — is operationally meaningful.
This content is for informational and educational purposes only and does not constitute investment advice or a personal recommendation. Past performance is not indicative of future results. Trading leveraged products involves significant risk and may not be suitable for all investors. The value of investments can fall as well as rise.
This content contains forward-looking statements that involve risks and uncertainties. Actual results may differ materially from those anticipated. Forward-looking statements are based on current expectations and assumptions that are subject to change.
For educational purposes only — not investment advice.
One Post. +110%. The Durov Effect on TON.For most of April 2026, Toncoin was drifting. The token sat near $1.21 - its lowest level since late 2023, down more than 75% from its 2024 peak of $8.25, largely ignored by a market focused on Bitcoin's Iran war recovery and Ethereum's institutional story. Then, on May 4, Pavel Durov posted four sentences on X. By May 7, TON had gained 110% from its April low. It was reported as one of the largest three-day moves among top-20 cryptocurrencies in 2026.
The Last Two Weeks: Price at a Glance
April 7, 2026 ($1.21): Cycle low. TON hits its weakest level since late 2023 as altcoins suffer from global "risk-off" sentiment due to Middle East conflicts.
April 9, 2026 (~$1.30): Catchain 2.0 update activated. Block time reduced from 2.5s to 400ms, achieving ~1s transaction finality.
Late April 2026 (~$1.40–$1.55): Fees reduced 6x to 0.00039 TON (~$0.0005). Agentic Wallets launched April 28. Network hits record 67M monthly transactions.
May 4, 2026 ($1.43 → $1.92): Pavel Durov posts on X (7:57 AM): Telegram to replace TON Foundation as the largest validator. TON jumps +36% in a day; $191.83M staking inflow.
May 5, 2026 (~$1.90–$2.21): Rally continues, +63% in 3 days. Monthly perpetual futures volume in Telegram Wallet reaches $1B.
May 7, 2026 ($2.53–$2.89): +32% in 24h. Market cap hits $7.6B, briefly entering Top 20 and overtaking LINK. RSI at 91–93 (extreme overbought).
May 8, 2026 (~$2.50–$2.73): Rally hits resistance near $3.00. Partial pullback due to profit-taking; still +110% from April 7 low.
May 11, 2026 (~$2.73): Current status. Support at $2.50, Resistance at $3.13. RSI cooling down, but momentum remains strong.
The Four Sentences That Moved the Market
On May 4 at 7:57 AM UTC, Pavel Durov posted on X (@durov):
"Fees in TON have dropped 6× - to nearly zero. Next step - Telegram replaces the TON Foundation as the driving force behind TON and becomes its largest validator. The focus shifts to tech superiority. New ton.org, new dev tools, new performance upgrades."
The post received 4,700 reposts and 700 replies within hours. TON moved +6% while Durov was still trending. By end of day it was up 36%. The concision was deliberate - Durov has 4 million followers on X and a documented history of market-moving posts. The market did not wait for details. It bought the name.
Brief History: Why Durov and TON Have Unfinished Business
The relationship between Durov and TON is not simple. In 2018, Telegram raised $1.7 billion in one of crypto's largest-ever ICOs to build the Telegram Open Network. In 2020, the US SEC blocked the project entirely, fining Telegram $18.5 million and forcing it to return $1.22 billion to investors. Durov stepped away. An independent community revived the chain as The Open Network under the TON Foundation.
TON grew without its founder: it peaked at $8.25 in mid-2024, driven by Telegram mini-app integrations and a wave of play-to-earn games. Then it fell - losing 75% through a bear market that lasted into early 2026. The Foundation's independent governance was seen as both a legal shield and a strategic liability. May 4 was the moment Durov closed the loop he opened in 2018.
The Bigger Lesson: Crypto Markets Are Still Deeply Influencer-Driven
TON's two-week rally is one of the clearest recent examples of a pattern that defines crypto markets in a way that no traditional asset class experiences: a single person's public statement can move a multi-billion-dollar market by 30–100% within hours.
The current example is not unique. Elon Musk's posts have historically moved Dogecoin by 30–80% in a single session. Trump's crypto executive orders moved BTC and ETH within minutes of signing. Michael Saylor's Bitcoin purchase announcements have at times been associated with BTC price increases of 1–3% on the day, though results have varied.
The mechanism may appear predictable, even if the timing is not. Crypto assets tied to a single identifiable founder or key person carry an embedded 'influencer premium' - a portion of their valuation that reflects not the technology, but the market's belief in that person's continued engagement. When the person goes quiet, the premium deflates. When they speak, it reinflates. Traders who positioned ahead of Durov's announcement - several on-chain analysts flagged unusual staking inflows in the 48 hours before the post - captured 30–40% in a single day.
The risk is symmetric. The same mechanism that inflates prices on positive founder posts can collapse them on negative signals.
Where TON Stands Now
As of May 11, 2026, TON trades near $2.73 - up 126% from its April 7 low of $1.21, and still 67% below its 2024 all-time high of $8.25. The RSI has come off its extreme overbought peak of 93 but remains elevated. The $3.00–$3.13 zone is the immediate resistance; $2.50 is a support level that some analysts are monitoring; a sustained move below it may indicate weakening momentum.
The near-term catalysts are specific and dateable, though their market impact - if any - cannot be predicted. This is provided for informational purposes only and does not constitute investment advice.. A TON Foundation transition audit report is expected in June 2026. This document may provide further clarity on whether Telegram has absorbed the Foundation's responsibilities and what governance implications may follow. Telegram's Q3 Stars revenue-sharing rollout - which would allow advertisers to pay in TON - may represent a significant potential catalyst for further adoption, and its execution or delay may be an important indicator of whether the May 4 announcement reflected long-term strategy or short-term sentiment.
For educational purposes only — not investment advice.
Past performance is not indicative of future results. The value of investments may fall as well as rise.
This content contains forward-looking statements that involve risks and uncertainties. Actual results may differ materially from those anticipated. Forward-looking statements are based on current expectations and assumptions that are subject to change.
Top 5 ICT Trading Strategies for New and ProsSince 2010, Michael J. Huddleston—known online as the Inner Circle Trader (ICT)—has shown thousands of traders how to read markets through the lens of institutional liquidity.
His ICT trading method exploded in popularity between 2023 and 2025 as price-action communities proved its versatility across forex, equity indices, and crypto assets. Professional desks use ICT concepts to time risk transfers, while retail traders gain clear entry points and balanced reward-to-risk profiles.
This article explains the most relevant ICT principles—market structure, liquidity pools, order blocks, breaker blocks, fair-value gaps, and kill-zones—and then weaves them into five step-by-step strategies you can apply today, ensuring you grasp what ICT means in trading and how to use it.
Key Takeaways
ICT trading reads institutional liquidity, not indicators, to pinpoint high‑probability price turns.
Entry precision comes from combining liquidity sweeps, order blocks, and fair‑value gaps inside kill zones.
Systematic risk limits plus rigorous journaling convert ICT setups into a repeatable statistical edge.
The ICT framework is market‑agnostic, scaling from intraday scalps to long‑term hedges across forex, futures, and crypto.
What is ICT in Trading?
ICT stands for Inner Circle Trading—a price-action framework that interprets every chart as a story of liquidity engineered by institutions, hedge funds, and large dealers (which are called smart money).
The core philosophy states that markets move to fill orders, not to obey indicators. Liquidity pools above highs or below lows act as magnets; price accelerates toward them, collects stops, and only then expands in its intended directional narrative.
Therefore, ICT trading meaning centres on identifying where smart money must transact. Instead of overlaying oscillators, practitioners mark structure breaks, order blocks, and fair-value gaps—the footprints institutions leave while building and releasing inventory around obvious resting orders.
Huddleston teaches viewing price through three layers:
High-time-frame bias,
Intra-day liquidity runs,
Execution-time confirmations.
This multi-zoom process keeps traders aligned with the prevailing narrative while avoiding the noise that tempts premature entries and emotionally driven exits.
Comparing ICT to classic Supply-and-Demand or Wyckoff strategies shows clear contrasts. Wyckoff maps accumulation cycles, while supply-demand boxes often ignore time-of-day nuances. ICT folds session kill-zones and specific imbalance rules into its map, yielding more precise trade timing and clearer invalidation points.
Fast Fact
The original ICT mentorship library contains over 200 hours of free video, enough to binge for eight straight days—yet most profitable students rewatch the first 20 hours multiple times before risking live capital.
Foundational Concepts Every ICT Trader Must Master
Before executing any ICT trading strategy, you must speak the native language. The framework stands on seven core concepts that map how institutions structure liquidity and nudge prices. Master them once, and every chart starts telling an orderly, surprisingly predictable story.
Market Structure — BOS & CHOCH
Market structure tracks the sequence of swing highs and lows. A Break of Structure (BOS) confirms trend continuation; a Change of Character (CHOCH) warns of a reversal. Marking these shifts keeps you aligned with dominant flow and steers you clear of counter-trend traps.
Liquidity Pools & Sweeps
Liquidity pools form where retail stops cluster, typically just above equal highs or below equal lows. Smart money drives price into these pools to trigger orders, then snaps the market in the opposite direction. Spotting the sweep tells you when volatility is engineered, not organic.
Order Blocks
An order block is the final bullish or bearish candle before an impulsive move. It represents bulk institutional positioning. When price revisits that zone, unfilled orders often remain, creating a high-probability launchpad with clearly bounded risk and logical invalidation.
Breaker Blocks
A breaker block begins life as an order block that fails. Price pierces it, closes through, and later retests from the opposite side. The flip reveals trapped traders and provides a clean reversal level that pairs well with liquidity sweeps and market-structure shifts.
Fair-Value Gap (FVG)
A fair-value gap appears as a large three-candle imbalance where trades are never printed in the middle. Institutions usually refill that gap before continuing the prevailing move. Entering the FVG lets you buy wholesale in bullish trends or sell premium in bearish ones.
Killzones
Killzones are high-volume windows—London Open, New York Open, and the 2 p.m. New York reversal hour—when liquidity is thick enough to sponsor institutional moves. Planning entries inside a killzone filters the false breaks that often occur during thin Asian trading.
Power-of-Three (Accumulation – Manipulation – Distribution)
Power-of-Three frames an entire session. Expect accumulation during the Asian range, manipulation via a killzone liquidity sweep, then distribution toward the daily objective. Recognising this cadence keeps expectations realistic and stops you from abandoning winning trades too soon.
Together, these seven elements form the grammar of ICT trading. They interlock naturally: a killzone sweep into an order block inside an FVG, following a CHOCH, builds a compelling narrative. The strategies in the next section formalise that narrative into repeatable rules.
Five Best ICT Trading Strategies
These five ICT trading strategies convert theory into action. Each model follows one cycle: locate liquidity, wait for displacement, and trade from a logical zone with measured risk. Master one at a time before adding the next.
1. Liquidity Sweep → Order-Block Entry
This ICT trading strategy begins with a visible double top or bottom where stops gather. Price spikes through, sweeping liquidity and printing an impulsive candle the other way. That displacement confirms smart-money intent and highlights the relevant order block.
Mark the last up-candle before the reversal as your bullish order block (or down-candle for shorts). Place a limit order at its midpoint, stop below the block, and target two to four times risk toward the next liquidity pool.
Checklist: Confirm BOS in trade direction, measure order-block range, ensure entry aligns with a session killzone, use a structured one-percent risk, and journal execution speed after the sweep-and-return setup.
2. Breaker-Block Reversal
A breaker block forms when an order block fails, meaning the price smashes through and closes beyond it. That flip traps counter-trend traders, leaving their stops vulnerable when price retests the zone from the opposite side.
Wait for a decisive close beyond the old block, then draw the breaker as the original candle body. Enter on the first pullback, stop goes behind the breaker, and aim for the nearest market-structure level or unfilled FVG.
NASDAQ futures often print reliable breakers around 10:30 a.m. New York. A bearish breaker after a news spike can yield a swift two-per-cent intraday drop while risking only 0.5% of account equity.
Trade management tip: Scale half at one-to-one, move stop to breakeven, and trail above one-bar highs or lows. The breaker usually completes during the same session, so avoid overnight exposure.
3. FVG Continuation Model
When a trend is established, fair-value gaps act like refuelling stations. A three-candle imbalance shows aggression; institutions typically refill that void before driving price further in the prevailing direction.
Identify a clean FVG on the one-hour chart that aligns with daily bias. Set limit orders inside the gap, stop beyond the far side, and scale out at one, two, and three times risk as price expands.
Risk considerations: An FVG trade fails when the price closes beyond the gap’s opposite edge. Predefine that invalidation and limit attempts to three per day to keep psychological fatigue under control.
4. Power-of-Three Day Model
Power-of-Three frames in ICT trading the entire session: Asia accumulates, London manipulates, and New York distributes the move. The objective is to capture the manipulation leg toward distribution, locking profits before liquidity dries up.
Define daily bias from higher-time-frame order flow. During the London killzone, watch for a false break opposite that bias. Enter when price snaps back through the Asian range, stop beyond the sweep, and hold until New York delivers the objective.
GBPUSD often shows this pattern on CPI release days. A 15-pip London sweep sets up a 70-pip New York expansion, producing a four-to-one reward without over-trading tiny intraday swings.
Patience pays: If the manipulation leg never appears, skip the trade. Forcing entries outside kill zones erodes the edge and can erase a week of careful execution in one impulsive click.
5. Daily Bias + Killzone Scalping
Scalpers can marry big-picture bias with lower-time-frame precision. First, mark daily bullish or bearish direction using structure and order blocks. Then drop to the one-minute chart inside a killzone for refined executions.
Look for micro liquidity sweeps into micro order blocks that agree with the daily map. Risk a quarter-per-cent per trade, exit partially at one-to-one, and trail the remainder until structure breaks.
USDJPY during the New York reversal hour routinely offers three to five such micro setups. A disciplined scalper can collect 1.5% account growth in an hour while keeping exposure tightly controlled.
End-of-session review: Screenshot each scalp, annotate the liquidity sweep, order block, and exit. Quantify average hold time and slippage to refine size and maximise the high-frequency character of this model.
How to Implement These Strategies
This implementation guide turns concepts into daily habits. Follow the bullet points below and treat them as a pre‑flight checklist; skipping any step statistically degrades edge, increases variance, and keeps your equity curve stuck in random mode.
- Choose your battleground: Trade one or two highly liquid instruments first—EURUSD, NASDAQ, BTCUSDT. Liquidity compresses spreads, fills order‑block entries cleanly, and lets you back‑test thousands of identical patterns without data‑quality surprises.
- Frame the chart hierarchy: Mark daily bias, navigate to one‑hour for structure, and execute on five‑minute or one‑minute. This three‑tier view keeps signals aligned and prevents the lethal error of buying into a higher‑time‑frame breaker.
- Run the confluence checklist: Require at least three of four signals: killzone timing, liquidity sweep, order‑block or FVG, and displacement candle. Confluence filters marginal setups and preserves psychological capital during flat or noisy sessions.
- Control risk with math, not hope: Cap single‑trade loss at one percent or less. Calculate position size before entry, use stop‑loss automation, and never widen stops. As equity grows, lower risk of flattening drawdown volatility.
- Journal like an engineer: Screenshot before‑and‑after charts, note checklist hits, emotions, and execution time. Review weekly to spot recurring mistakes and code them out. Without a data‑driven review, progress stalls regardless of strategy quality.
- Back‑test then forward‑test: Replay twelve months of data at trading speed, log win‑rate, average R, and max consecutive losses. Once metrics satisfy at least 1.8 expectancy, trade micro‑lots live for thirty sessions before scaling size.
Common Pitfalls & How to Avoid Them
Even sound ICT playbooks crumble when traders repeat avoidable errors. Here are the biggest traps and present practical counters, so your edge survives long after the honeymoon phase ends.
- Chasing price after the sweep: The liquidity sweep is the entry clue; jumping on the displacement candle gifts your stop to smart money. Wait for the orderly retest of the highlighted order block and commit risk only then.
- Sloppy order‑block labelling: If the candle you mark did not precede a decisive break of structure, it is not an order block. Validate every zone against displacement or risk anchoring trades to decorative rectangles.
- Over‑leveraging and widening stops: ICT levels are precise; averaging down converts a planned scratch into a portfolio dent. Keep exposure below one percent and accept the small, predefined loss without negotiation.
- Ignoring high‑impact releases inside killzones: A CPI surprise can invert liquidity maps in seconds. Check the calendar each morning and stand aside during releases that overlap your chosen session.
Conclusion & Further Learning
ICT trading demystifies market movement by mapping where institutional liquidity must transact. When you pair that map with disciplined risk limits, you stop gambling on candlestick patterns and start executing deliberate, statistically repeatable trades.
But mastery is earned, not granted. Rewatch chart replays, journal every decision, and audit metrics weekly. Screen‑time reveals subtle context shifts that no article can encode, turning textbook models into an instinctive, fluent language.
For structured study, start with Huddleston’s free YouTube mentorship playlists. Always trade a demo while learning; past performance is no guarantee of future returns, and capital preservation remains paramount.
Disclaimer: This article is for educational purposes only and does not constitute financial advice. Trading carries risk; always consult a licensed financial professional before committing capital.  Education
Bitcoin in May: Three Scenarios for the $80,000 CrossroadsCross-Asset Scorecard
Gold: Price $4,615, WoW -2.0%, MTD -2.1%, YTD +21.3%, R: $4,661
BTC: Price $80,060, WoW +3.5%, MTD +4.9%, YTD +16.7%, R: $80,621
ETH: Price $2,382, WoW +0.8%, MTD +1.4%, YTD -8.2%, S: $2,299
EUR/USD: Price 1.1729, WoW +0.4%, MTD +2.6%, YTD +7.8%, S: 1.1600
USD/JPY: Price 159.30, WoW -0.2%, MTD -1.1%, YTD +3.4%, S: 157.00
DXY: Price ~98.1, WoW +0.0%, MTD -2.4%, YTD -6.1%, S: 97.50
S&P 500: Price ~7,200, WoW +0.5%, MTD +2.2%, YTD +6.3%, S: 7,000
10Y Yield: Price 4.35%, WoW -4bps, MTD -6bps, R: 4.50%
BTC/ETH: Crypto.com live data, 05:17 UTC May 4, 2026. Gold: TradingView/Investing.com. Macro: BLS.gov, FRED, TradingEconomics.
Positioning Snapshot
FedWatch: Next FOMC: June 16–17, 2026 (no May meeting — confirmed Fed schedule)
June cut probability: ~15% (25bp) | ~85% hold (CME FedWatch, May 4)
BTC ETFs: April total: ~+$2.43B (first net-positive month in 2026)
IBIT: ~+$4.7B inflows since April 9 (Bloomberg/CoinTelegraph)
Other US spot BTC ETFs: mostly flat or outflowing in May
March NFP: +178K (BLS, April 3, 2026) | Unemployment: 4.3%
April NFP: Due May 8, 2026 (Fri, 08:30 ET) | Consensus:
What Moved What (Top 3 Stories)
Fed holds at 3.50–3.75% (Apr 29) → BTC +2.4% off $74,929 base. Soft-landing narrative reinforced; rate-sensitive risk assets recovered.
IBIT only US BTC ETF with consistent inflows → BTC +3.5% WoW. Structural institutional demand absorbed sell pressure at $78K support.
Gold slips $4,709→$4,615 (–2.0%) while BTC rallies +3.5%. Correlation break: BTC showing crypto-specific bid, not just USD weakness.
Week Ahead — Key Events
Mon May 4: ISM Services PMI (April), Consensus ~52.0, Impact: HIGH
Tue May 5: Trade Balance (March), Impact: MEDIUM
Wed May 6: Fed speakers (no meeting), Impact: MEDIUM
Thu May 7: Initial Jobless Claims, Impact: MEDIUM
Fri May 8: April NFP (BLS), Consensus ~170K, Impact: HIGH
Fri May 8: April Unemployment Rate, Consensus ~4.3%, Impact: HIGH
Note: NO FOMC meeting this week. Next FOMC is June 16–17, 2026. Key event: April NFP (May 8) — hot print (>220K) re-prices rate cuts and is the primary downside risk for BTC's $80K breakout.
This content is for informational and educational purposes only and does not constitute investment advice or a personal recommendation. Past performance is not indicative of future results. Trading leveraged products involves significant risk and may not be suitable for all investors.
The Setup: $80,000 Is No Longer Just a Number
At 05:17 UTC on May 4, 2026, Bitcoin traded at $80,060 — breaching the $80,000 level for the first time since late 2025. The intraday high reached $80,621 (Crypto.com data). After six weeks of trading between $65,686 (Liberation Day low, April 2) and $79,492 (April 22 high), the market is forcing a decision: is this breakout real, or is $80K about to reassert itself as a ceiling?
The answer matters structurally. $80,000 is not only psychological — it is documented as the level where a significant concentration of short-side liquidity sits (per Bitget technical analysis, May 2026). A clean daily close above it may trigger forced covering and could accelerate the move toward $84,000–$85,500. The question is whether the macro and flow conditions support the follow-through.
The evidence on May 4 suggests they might. Here is the case, and the three scenarios that follow.
What Changed in April: The Recovery That Matters
Bitcoin's April trajectory tells an instructive story. The month opened at $68,290 (April 1, Crypto.com), declined to an intraday low of $65,686 on April 2 ("Liberation Day" — global tariff announcements), then staged a recovery of +21% to reach an intraday high of $79,492 on April 22 (Crypto.com data). April closed at $76,350 on April 30.
Three converging forces drove that recovery:
1. Fed stops tightening — hold confirmed. The FOMC meeting on April 29, 2026 delivered the universally-expected rate hold at 3.50%–3.75%. The 10-year Treasury yield responded, pulling back from ~4.50% in early April to 4.35% by May 4 (source: FRED/TradingEconomics). Lower yields reduce the funding-cost headwind for risk assets including crypto.
2. ETF structural absorption by IBIT. BlackRock's IBIT absorbed approximately $4.7 billion in net inflows between April 9 and early May 2026 (Bloomberg, CoinTelegraph). Critically, IBIT was the only US spot BTC ETF with consistent positive flows during this period — other funds including Grayscale's GBTC were flat or outflowing. This concentration of buying in a single vehicle may create asymmetric supply dynamics: IBIT demand has not been materially offset by competing ETF selling in the observed period.
3. First net-positive ETF month of 2026. April became the first month in 2026 where US spot BTC ETFs saw net positive aggregate flows, at approximately $2.43 billion. The January–March 2026 period had seen net ETF outflows, creating a structural overhang that April's flows began to clear.
These three factors combined to produce a BTC recovery from the April 29 intraday low of $74,929 to the current $80,060 — a +6.8% move in five trading days.
Three Scenarios for May 2026
Bitcoin is now at the bifurcation point. What happens next depends primarily on two variables: the April NFP data (May 8, 2026, BLS — Friday) and whether ETF inflows continue. There is no FOMC meeting this week — the next Fed decision is June 16–17.
🟢 Scenario 1 — BREAKOUT CONFIRMED
Estimated probability: ~40%
Trigger conditions:
BTC posts a daily close above $80,000 this week
April NFP (May 8) prints soft — below 170,000 — consistent with gradual labor market cooling
IBIT inflow streak continues at $200M+/day
No hawkish Fed signals between now and June 16–17 FOMC
Price structure: A confirmed break above today's intraday high of $80,621 opens a technical path toward $84,000–$85,500, the next meaningful resistance cluster identified by Bitget, 247 Wall St., and CoinCodex analysis for May 2026. The short-squeeze dynamic is directionally significant: each forced short cover above $80K adds incremental buying pressure. Beyond $85,500, the $88,000–$90,000 zone becomes plausible as a May endpoint if momentum builds.
What to watch:
IBIT daily flows (CoinGlass): sustained $200M+/day = structural support intact
10Y yield: hold at 4.30%–4.40% = constructive macro backdrop
NFP print below 150K would be meaningfully dovish ahead of June 16–17 FOMC
Entry note: Some traders may assess a confirmed NY-session daily close above $80,621 as a potential signal for directional positioning. An intraday breach alone may not be considered sufficient confirmation by all approaches. BTC 14-day ATR: ~$2,300 (2.9% of price, Barchart May 3); NFP-day prints historically amplify intraday range 1.5–2×, implying a ~$3,500–$4,600 move window around 08:30 ET on May 8. Position sizing should be assessed individually based on each trader's risk tolerance and account parameters.
OI confirmation: A breakout above $80,621 accompanied by rising CME BTC open interest = genuine directional break. The same price move with declining OI = short-covering only; the rally fades.
Invalidation: This scenario may be reassessed if Bitcoin records a daily close below $78,000.
🟡 Scenario 2 — RANGE CONSOLIDATION
Estimated probability: ~40%
Trigger conditions:
$80,621 resistance holds; BTC cannot sustain daily closes above $80,000
April NFP (May 8) prints near consensus (~170K) — ambiguous, not strongly directional
Mixed ETF flows: IBIT positive but offset by GBTC outflows; net-flat aggregate
Price structure: BTC oscillates in a $76,500–$82,000 range through mid-May, with $78,000 as the pivotal support. This is the digestion scenario: the recovery from the April lows was sharp (+6.8% in five days). Sharp recoveries are frequently followed by consolidation periods before the next directional move.
For context: after BTC's March 2024 break above $70,000, the asset spent approximately six weeks ranging between $60,000 and $73,000 before resuming its uptrend. A similar consolidation period above $76,500 in May 2026 would establish a healthier base for a sustained breakout. Note: past price patterns are historical observations only and are not indicative of future results.
Invalidation: This scenario may be reassessed if Bitcoin records a clean break above $82,000 or below $74,000.
🔴 Scenario 3 — MACRO RESET
Estimated probability: ~20%
Trigger conditions:
April NFP prints above 220,000 AND average hourly earnings remain elevated
Market re-prices rate cuts lower; June cut probability drops toward zero
DXY recovers from ~98.1 toward 100+; 10Y yield spikes back above 4.55%
IBIT inflow streak breaks; institutional bid steps back
Price structure: BTC rejects at $80,000–$82,000 and reverses. First target: $75,600–$76,000 (the April 29–30 bounce zone). In a more severe scenario: $73,800–$74,000, the area of the 100-day moving average (per TradingEconomics analysis for this period).
This scenario reconnects the "BTC as risk asset" correlation that was beginning to loosen in April (when BTC rose as gold fell, suggesting crypto-specific demand rather than pure macro beta).
What would increase this probability:
A geopolitically significant commodity shock (e.g., a structural oil supply disruption)
Hot April NFP print pushing June 16–17 FOMC toward hawkish outcome
Large BTC exchange inflow spike (on-chain signal of impending sell pressure)
Invalidation: BTC holds $78,000 on NFP day → macro shock scenario neutralized
The Gold Signal: Correlation Break in Progress
Gold's price action since April 27 carries analytical weight. Gold declined from its April peak of $4,709 (April 27, Crypto.com/TradingView data) to $4,615 on May 4 — a –2.0% week-over-week decline — even as BTC gained +3.5% over the same period.
This divergence is structurally interesting. In the February–March 2026 risk-off episode, both gold and BTC declined together as dollar strength dominated and the correlation with macro risk-off held. The current divergence — gold selling off while BTC rallies — suggests the BTC move is not simply a dollar-weakness trade. It has a crypto-specific engine: ETF structural buying driving IBIT inflows.
This may suggest the BTC bull case is not solely dependent on DXY weakness. However, a strong NFP print would hurt BTC through the risk-asset channel (higher yields, stronger dollar, risk-off) while gold might recover its safe-haven bid. The two assets are currently playing different roles. Position sizing across both from the same account requires treating these as partially-decorrelated exposures.
There is a second cross-asset signal worth noting. VIX has collapsed from its April distress peak of 31.65 to 16.88 (FRED, May 1) — a –38.5% decline in equity volatility. When cross-asset vol normalises from distress levels back toward neutral, risk appetite historically broadens into crypto: equity traders reduce hedges, capital re-allocates into higher-beta assets, and BTC tends to outperform. The VIX compression is the equity-side confirmation of Scenario 1's macro backdrop — not a correlation in the traditional sense, but a vol-regime transmission channel. S&P 500 holding above 7,000 (noted support in the scorecard) alongside VIX below 18 is the equity environment most consistent with BTC sustaining above $80K.
The 10-Year Yield as the Silent Variable
The 10-year Treasury yield at 4.35% on May 4, 2026 is doing quiet work for BTC's bull case. In April, yields briefly touched 4.50%+, creating a funding-cost headwind for growth and risk assets. The pullback to 4.35% removed that headwind.
The critical scenario: if April NFP (May 8, BLS) prints hot enough to push 10Y back above 4.50%, the headwind returns. If NFP is soft and 10Y holds below 4.40%, the BTC breakout above $80K may have more supportive macro conditions.
This yield transmission channel is why May 8's NFP is a key macro input for BTC this week.. There is no FOMC meeting — the next Fed decision is June 16–17, 2026 (confirmed Fed schedule).
The dollar channel reinforces the same directional setup. DXY at ~98.1 — 7-month lows — removes a structural headwind for Scenario 1. Historically, DXY holding below 98.5 has correlated with BTC risk-on momentum as dollar weakness expands risk appetite across crypto and EM. DXY support sits at 97.50; a break below could be an additional tailwind for the breakout scenario. Conversely, a hot NFP print that pushes DXY back above 100 could serve as a dollar-channel signal consistent with Scenario 3, amplifying the yield shock through the FX transmission mechanism — EUR/USD reversal below 1.1600 may be assessed as a concurrent signal by some traders.
Key Levels Dashboard
Resistance 3: $88,000–$90,000, Extended breakout target
Resistance 2: $84,000–$85,500, Next structural resistance zone
Resistance 1: $80,621, Today's intraday high (Current Test)
Current Price: ~$80,060, As of 05:17 UTC, May 4, 2026
Support 1: $78,000–$78,277, Today's intraday low / May 2–3 base
Support 2: $75,600–$76,000, April 29–30 bounce zone
Support 3: $73,800–$74,000, 100-day MA area (TradingEconomics)
Source: Crypto.com MCP live data + Bitget/247WallSt/TradingEconomics. Data as of May 4, 2026 05:17 UTC.
What This Means for Active Traders
The $80,000 test happening today is not a one-day event — it is the beginning of a multi-day resolution window. The market will likely require multiple daily close attempts (or a decisive rejection) before the scenario above is confirmed. The NFP print on May 8 is an important exogenous input that may significantly influence the outcome this week.
For traders managing positions across asset classes, this week's structure represents a bifurcation: two roughly equal-probability outcomes (breakout or consolidation) with a low-probability but high-impact downside scenario. Position construction across BTC, EUR/USD, and Gold simultaneously requires thinking about which assets hedge which outcomes.
Past performance is not indicative of future results. The value of investments can fall as well as rise.
Conclusion: The Crossroads Test
Bitcoin enters May with the structural case intact — ETF flows clearing the January–March overhang ($2.43B April net), VIX normalising at 16.88 from the April peak of 31.65, Fed on hold at 3.50–3.75% (BLS: 178K March NFP, 4.3% unemployment). The $80K resolution window is May 4–8: breakout and consolidation together account for ~80% probability; Scenario 3 is the 20% tail that determines pre-NFP position sizing — with BTC ATR at $2,300 and a 1.5–2× event amplifier on May 8, the risk is quantifiable even if the outcome is not.
All analysis is for informational and educational purposes only. This content does not constitute investment advice or a personal recommendation. Trading leveraged instruments involves significant risk of loss. Past performance is not indicative of future results. Not investment advice.
This content contains forward-looking statements that involve risks and uncertainties. Actual results may differ materially from those anticipated. Forward-looking statements are based on current expectations and assumptions that are subject to change.
Ethereum 2026: “Buy the Infrastructure, Survive the Volatility”Ethereum entered 2026 with more institutional backing than at any point in its history - spot ETFs, staking products, corporate treasuries, and a tokenization thesis backed by BlackRock. It then fell 47% from its January high to a February trough of $1,840. The pattern captures ETH's dual nature: it carries one of the more frequently cited structural cases in digital assets, and one of the most volatile short-term price profiles.
Price: The Year So Far
Aug 24, 2025 — ATH: $4,952. All-time high driven by ETF inflows and corporate treasury accumulation.
Early Jan 2026 — ~$3,400–$3,500. Brief recovery alongside Bitcoin. ETH starts year on fragile footing.
Feb 6, 2026 — Low: ~$1,755. Steepest weekly decline of the year. BTC drops below $71K; ETH falls harder.
Feb 28, 2026 — ~$1,840. US-Israel operation against Iran begins. ETH drops alongside BTC as crypto is the only liquid weekend market. Possible cycle low.
Mar 12, 2026 — ~$2,200. BlackRock launches ETHB — first staked Ethereum ETF on Nasdaq.
Apr 20–26, 2026 — $2,300–$2,350. Trump extends Iran ceasefire. ETH rises with BTC. Ethereum Foundation stakes 70,000 ETH.
Dependent on Bitcoin and the Geopolitical Mood
Geopolitical events have reinforced this throughout 2026. When the US-Israel operation against Iran began on February 28 - a Saturday, with traditional markets closed - ETH dropped alongside BTC as crypto was the only available liquid asset. Several ceasefire announcements in April appeared to coincide with coordinated rallies in both assets.. Periods of failed negotiations generally coincided with simultaneous reversals in both assets.. ETH has often moved in the same direction as BTC, just with greater amplitude in both directions.
The Corporate Treasury Wave
A notable structural development in Ethereum's 2026 story is the emergence of publicly listed companies holding ETH as their primary treasury asset - modelled on Strategy's Bitcoin playbook, but with a yield twist: staking the holdings to generate income while providing shareholders leveraged ETH exposure through equity.
Bitmine Immersion Technologies (NASDAQ: BMNR), holds approximately 4.976 million ETH - around 4.12% of total circulating supply - with 73% of it staked, generating an estimated $264 million in annualized staking revenue. The company has continued buying through the drawdown despite sitting on substantial unrealized losses, adding over 100,000 ETH in a single week in late April 2026.
SharpLink Gaming (NASDAQ: SBET), holds approximately 740,760 ETH (~$3.15 billion). It pivoted from sports betting marketing in May 2025 following a $425 million investment round led by Consensys. Around 14 publicly listed companies now hold ETH in their corporate treasuries.
The collective effect is structural supply compression. Approximately 30% of total ETH supply is staked and locked across the network. The proportion of ETH sitting on exchanges available for trading has dropped to its lowest level since 2016. Every ETH committed to a corporate treasury or staking contract is removed from the liquid float - this dynamic may provide some degree of support to the price, though market conditions and sentiment can still drive significant downside.
Beyond ETFs, Ethereum is the primary infrastructure for the tokenization of real-world assets - the process of representing stocks, bonds, real estate, and funds as on-chain tokens. Goldman Sachs is building parallel infrastructure through GS DAP. BNP Paribas has issued a tokenized money market fund on Ethereum. Ethereum currently processes more tokenized assets than any competing network.
Price Forecasts for 2026
Standard Chartered — $7,500. Revised down from $12,000 in Jan 2026; corporate treasuries absorbing ~3.8% of supply.
Fundstrat — $7,000–$9,000. ETH as settlement layer for tokenized securities; BlackRock and Robinhood integrating on-chain settlement.
Arthur Hayes — $10,000. Price discovery following bear market; ETH as financial infrastructure layer.
CoinShares — $4,500–$4,900. Conservative base; L2 fee compression a headwind, ETF-driven recovery in H2 2026.
CoinCodex — $2,200–$3,900 range. Post-halving dynamics and ETF flows; 200-day MA at $2,345 the key technical line.
The above price targets are analyst projections published by third parties and are reproduced for informational purposes only. They do not constitute investment advice or a recommendation to buy, sell, or hold any asset. Forecasts may not be achieved.
Key Risks
Layer-2 fee compression. Ethereum's mainnet fee revenue faces structural pressure from cheaper Layer-2 networks (Base, Arbitrum, Linea) that handle transactions at a fraction of mainnet cost, reducing the economic demand for ETH as a gas token. The upcoming Glamsterdam protocol upgrade aims to partially address this.
Concentration risk. With Bitmine alone targeting 5% of total supply, and ~30% already staked, Vitalik Buterin has flagged concentrated staking as a potential systemic risk. A forced unwind by a large corporate holder would create significant supply-side pressure.
Regulatory uncertainty. The Clarity Act - establishing a digital asset market-structure framework - has stalled in Congress. Staking tax treatment remains unresolved, creating friction for institutional participants. The SEC-CFTC resolved ETH's regulatory classification in March 2026, a positive step, but broader clarity may not arrive until late 2026.
For educational purposes only - not investment advice.
Past performance is not indicative of future results. The value of investments may fall as well as rise.
This content contains forward-looking statements that involve risks and uncertainties. Actual results may differ materially from those anticipated. Forward-looking statements are based on current expectations and assumptions that are subject to change.  Long
Long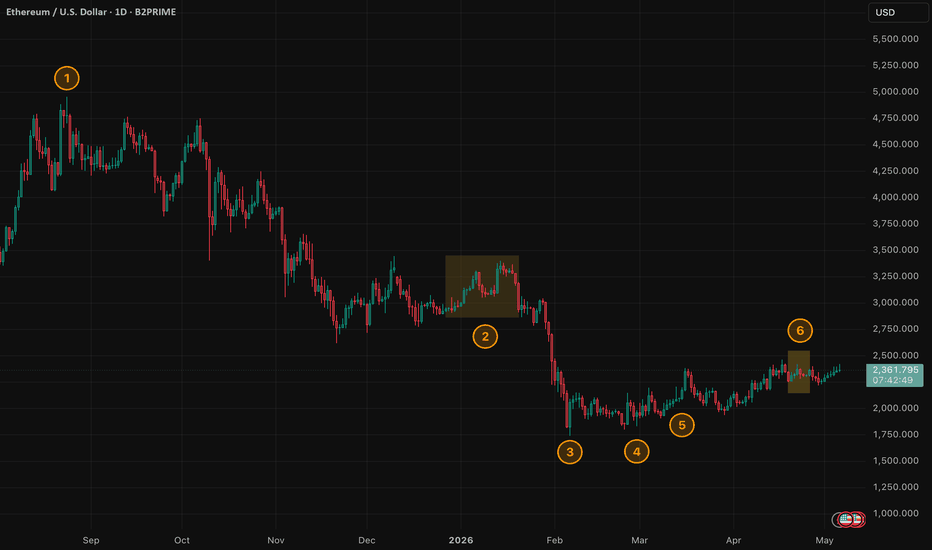
Policy Crossroads — A Scenario Framework for Fed WeekThe DXY has fallen 6.1% year-to-date (from ~104.8 at year-end 2025 to 98.36 as of April 20, 2026; Trading Economics). The Federal Reserve meets April 28–29, with a rate decision at 3.50%–3.75% widely expected to hold. But "hold" is not "nothing happens." Everything this week hinges on what Powell signals Wednesday and what GDP/PCE confirms Thursday.
The Dollar Backdrop: Six Months of Structural Softening
The dollar's weakness has a direct cross-asset fingerprint:
Gold +24.6% YTD to $4,709/oz (April 24; Trading Economics)
Brent crude +19.3% YTD to $104.40/barrel (April 24; Barchart) — Iran geopolitical supply risk
BTC +14.1% YTD — alternative-asset thesis, despite Fear & Greed at 33 ("Fear"; CoinGape)
EUR/USD: +7.8% YTD to 1.1729. The 2s10s yield curve has steepened from inverted (Q3 2025) to +45bps — the market pricing the Fed's next move as down, not up.
The FOMC: Three Scenarios for Wednesday
Fed rate: 3.50%–3.75%, held since March 18, 2026 (Fed.gov). March dot plot: one rate cut in 2026 per median (CNBC, Schwab, Fed.gov). Polymarket: 99.9% probability of no change on April 29.
Scenario A — Hawkish Hold (~15–20% probability)
Powell pushes back on September cut pricing. Notes sticky core PCE (2.7% 2026 forecast, March SEP) and oil at $104 Brent.
Likely reaction: DXY bounces toward 100 | USD/JPY rises | Gold corrects (real-rates compression) | 2Y yield up, 2s10s narrows | BTC/risk soften but orderly
Invalidated if: EUR/USD holds above 1.1600 within 24h of hawkish statement — structural DXY downtrend overrides rate narrative.
Scenario B — Neutral Hold (~75–80% probability)
Powell reiterates March language. No new forward guidance.
Likely reaction: DXY ±0.3% then reversion | BTC consolidates below $80K | All eyes to Thursday GDP/PCE
Confirmed if: DXY stays within ±0.5% of 98.36 by end of Wednesday's US session.
Scenario C — Dovish Hold (~5–10% probability)
Powell acknowledges Q1 growth risk (Atlanta GDPNow: 1.2%; Atlanta Fed, April 21) and signals bar for June/July cut is lower.
Likely reaction: DXY breaks below 97.50 | EUR/USD toward 1.19–1.20 | Gold breaches $4,730 | S&P extends toward 7,300+ | BTC clears $80K
Invalidated if: Gold fails to clear $4,730 within 2 sessions of dovish statement — COT crowding (162.5K) absorbing rally, not extending it.
Thursday's Binary: GDP + PCE
Q1 GDP advance estimate (BEA, April 30, 08:30 ET):
Atlanta Fed GDPNow: 1.2% (updated April 21; Atlanta Fed — official)
NY Fed nowcast: 2.4% (April 24; NY Fed)
Q4 2025 final GDP: 0.5% (BEA, April 9, 2026 — government shutdown subtracted ~1.0pp)
| GDP Print | Market Read | DXY | Equities | Gold |
|-----------|--------------------------|----------|------------|--------|
| < 1.5% | Hard landing → cut urgency| Weaker | Volatile | Rally |
| 1.5–2.2% | Soft landing intact | Stable | Mild rally | Stable |
| 2.4% | Resilience → cut delay | Stronger | Rally | Soften |
Core PCE prints simultaneously (consensus ~2.8–3.0%). GDP <1.5% + PCE >2.8% = stagflationary signal — the most difficult macro setup for positioning.
Gold: $4,709 and the Real-Rates Framework
10Y TIPS real yield: 1.89% (April 24; FRED DFII10, Fed.gov) Break-even inflation: 2.42% (Nominal 4.31% – TIPS 1.89%)
At +1.89% real yield, gold's mechanistic baseline is materially below $4,709 spot. The premium represents: (1) Iran geopolitical flight bid, (2) COT crowding at 162.5K non-commercial longs (CFTC, April 17).
A hawkish FOMC that pushes real rates 10–15bps higher directly compresses this premium. The 162.5K non-commercial long is the most exposed crowded trade — unwind in Scenario A amplifies gold correction beyond what the DXY move alone implies.
Key level: $4,600 support — breach on high volume with DXY bounce signals short-term exhaustion.
BTC: Institutional Demand vs Retail Fear
Price: $78,335 (April 27; LatestLY)
ETF inflows: 9-day streak, $2B+ cumulative (CoinGape, April 27)
BTC dominance: 58.2% | ETH dominance: 10.5% (CoinGape) — single-asset institutional demand
Fear & Greed: 33 ("Fear") — retail lags institutional
Retail-institutional gap = next marginal buyer is retail if macro resolves constructively (Scenario B or C). $80,000 = resistance with significant options OI. Clean break targets $83,000. Hawkish FOMC failure: watch $75,000 support.
Forex: Dollar's Critical Week
EUR/USD 1.1729 | Support 1.1600 | MUFG year-end target 1.2400 (MUFG Research)
USD/JPY 159.30 | Down 1.1% MTD | Support 157.00 | MUFG year-end 146.00
GBP/USD 1.3500 | Falling-wedge breakout | Key floor 1.3484
Volatility Sequencing: Position Sizing Context
VIX at 18.71 implies ±1.17%/day baseline (VIX/16). FOMC days carry 30–50% event premium above VIX-implied baseline — ±1.5–1.8% intraday S&P swings on April 29 statement window (14:00–15:00 ET).
GDP/PCE Thursday adds a second repricing layer within 18 hours. For positioning: a trader holding gold long + S&P short faces correlated macro sensitivity on both trades across the same 20-hour FOMC–GDP window. Allow FOMC dust to settle (~15:30 ET Wednesday) before re-sizing into Thursday's GDP print.
Key Levels to Watch
| Asset | Level | Scenario / Market Context |
|------------|--------------------|-------------------------------------------|
| DXY | 97.50 Support | Break -> Broad USD weakness, EUR/BTC bid |
| Gold | $4,600 Support | Breach -> $200 flush (Scenario A confirm) |
| Gold | $4,730 Resistance | Scenario C Dovish confirmation level |
| EUR/USD | 1.1600 Support | Scenario A Hawkish Fed watch level |
| USD/JPY | 157.00 Support | Potential BOJ intervention zone |
| BTC | $80,000 Resistance | Major breakout target (Scenario C) |
| S&P 500 | 6,950 Support | GDP miss + Hawkish Fed = risk of test |
| 10Y Yield | 4.35% Resistance | Break -> USD rally, Equities pressure |
WEEK AHEAD CALENDAR
| Date | Time ET | Event | Consensus | Impact |
|--------|---------|-------------------------------|------------|--------|
| Apr 28 | 10:00 | Consumer Confidence (Apr) | ~98.0 | HIGH |
| Apr 29 | 14:00 | FOMC Rate Decision (1) | No change | HIGH |
| Apr 29 | 14:30 | Fed Chair Press Conference (2)| — | HIGH |
| Apr 30 | 08:30 | Q1 GDP Advance Estimate (3) | ~1.5–2.4% | HIGH |
| Apr 30 | 08:30 | Core PCE Price Index (Q1) (4) | ~2.8–3.0% | HIGH |
| May 1 | 08:30 | Nonfarm Payrolls (Apr) (5) | ~175K | HIGH |
| May 1 | 08:30 | Unemployment Rate (Apr) | ~4.1% | HIGH |
This content contains forward-looking statements that involve risks and uncertainties. Actual results may differ materially from those anticipated.
Past performance is not indicative of future results. The value of investments may fall as well as rise.
This content is for informational and educational purposes only and does not constitute investment advice or a personal recommendation. Trading leveraged products involves significant risk and may not be suitable for all investors. The value of investments can fall as well as rise.
Bitcoin in 2026: War, Washington, and the 80k WallBitcoin entered 2026 riding the tailwinds of its best year since 2020. The 2024 halving, the launch of US spot ETFs, and Trump's return to the White House had combined to push BTC to an all-time high of $126,198 on October 6, 2025. The macro thesis was simple and compelling: a pro-crypto administration, institutional capital flowing through regulated products, and a weaker dollar all suggesting upward momentum. However, in 2026, a number of adverse factors emerged simultaneously.
Key Price Milestones, 2025–2026
Date | Price | Event
--------------------|--------------------|-------------------------------------------------------------
(1) Oct 6, 2025 | ATH $126,198 | Halving cycle peak; ETF inflows; Trump re-election euphoria
(2) Nov 2025 | ~$100,000 | Correction begins. Spot ETF outflows: $3.48B in Nov alone
Early Feb 2026 | Cycle low ~$60,000 | BTC ETF outflows cumulative: >$6B from Nov 2025 to Feb 2026
(3) Feb 5, 2026 | Below $71,000 | BTC erases all post-election gains; -20% YTD; ETF outflows $4.5B
(4) Feb 28, 2026 | Flash to ~$63,000 | US-Israel op vs Iran begins Saturday; $300M liquidations in 1h
(5) Mar 12-15, 2026 | Range $64K-$71K | BTC +7% from Feb 28 open, outperforms S&P 500, gold, Asian eq.
(6) Apr 10, 2026 | $72,155 | Temporary US-Iran ceasefire; risk-on rally
Apr 20-21, 2026 | Breaks $78,000 | Trump extends ceasefire indefinitely; Strategy buys 34,164 BTC
(7) Apr 22-26, 2026 | $77,000-$79,000 | ETF April inflows ~$1.87B; Strategy overtakes BlackRock: 815,061 BTC
The US Government Factor
Trump signed the Strategic Bitcoin Reserve (SBR) executive order on March 6, 2025. It directed the Treasury to consolidate all federally held BTC into a single reserve, prohibited sales of seized assets, and instructed agencies to find budget-neutral acquisition strategies - explicitly barring the use of taxpayer funds for new purchases. The US currently holds approximately 328,372 BTC (~$25 billion), the largest known state holding in the world.
Congress has not codified the SBR into law. Without legislation, it remains a presidential directive revocable by the next administration. A potential legislative vehicle is the National Defense Authorization Act (NDAA) expected in late 2026. The Clarity Act - establishing a market-structure framework for digital assets - has also stalled, partly due to a government shutdown conflict. The GENIUS Act (stablecoin rules) did pass and was considered a positive first step.
Jerome Powell’s current term as the Chair of the Federal Reserve is set to expire on May 15, 2026. His successor, if more dovish, could represent a potential catalyst for risk asset repricing, though the outcome remains uncertain. The White House crypto policy director acknowledged in January 2026 that "obscure legal provisions" continue to impede full SBR implementation.
The Iran War: Bitcoin as a Real-Time Geopolitical Indicator
The US-Israel military operation against Iran began on February 28, 2026 - a Saturday. With traditional markets closed, Bitcoin was the only large liquid asset available for trading. Within the first hour, BTC dropped approximately 8.5% to ~$63,000, triggering over $300 million in leveraged liquidations and $1.8 billion in sell volume.
Over the following two weeks, Bitcoin's behaviour surprised the market. From its February 28 open, BTC rose approximately 7% by March 12, outperforming the S&P 500, Nasdaq, gold, and Asian equity indices - all of which fell between 3% and 19%. Bitcoin was the first asset to price the war because it was the only liquid market open when the conflict started. It recovered more quickly than several other major asset classes during the same period.
The mechanism cuts both ways. Spot Bitcoin ETFs brought institutional capital into BTC, but that capital now behaves like any other institutional risk asset: algorithm-driven de-risking hits Bitcoin ETF positions alongside equities during geopolitical shocks. Sustained oil prices above $100/barrel translate directly into deferred Fed rate cuts, raising the opportunity cost of holding non-yielding assets like Bitcoin.
The ETF Engine: Structural Demand with a Cautious Owner Base
US wealth advisors collectively manage trillions of dollars but currently allocate less than 0.5% of client assets to crypto. Bitcoin ETFs are an approved, regulated vehicle - but the asset remains too volatile for most compliance frameworks to justify a meaningful allocation. That is the central tension of the ETF story: the plumbing exists, but the capital is parked just outside the door.
The flow data illustrates the caution. Between November 2025 and February 2026, spot Bitcoin ETFs lost over $6 billion in net outflows.
The reversal came in March: $1.32 billion in net inflows, the first positive month of 2026. April accelerated further - nine consecutive days of inflows from April 14–24, with weekly figures of $786 million, $996 million, and $823 million. Total April inflows by April 25: approximately $1.87 billion. Over the eight weeks from late February to late April, Bitcoin ETFs pulled in approximately $3.7 billion in aggregate.
April 27, 2026: The State of Play
Bitcoin is trading near $77,000–$78,000, approximately 38% below its October 2025 all-time high of $126,198 and approximately 23% above its February 2026 cycle low of ~$60,000. The $80,000 level - roughly coinciding with the short-term holder realized price of ~$80,700 - represents a significant near-term level that some analysts are monitoring.
The macro backdrop remains the binding constraint. CME FedWatch shows a 98% probability of rates held at the April 29 FOMC meeting. For a potential move above $90,000, some analysts suggest three conditions may need to align simultaneously: a ceasefire that durably removes geopolitical risk, oil prices returning to $80 or below, and softer-than-expected inflation data opening a path to Fed easing.
Bottom Line
The structural case for Bitcoin - ETFs, institutional accumulation, the halving supply shock, a pro-crypto White House holding 328,372 BTC - has never been stronger. The macro environment - war-driven inflation, deferred rate cuts, and a Congress that has not codified any of Trump's crypto executive orders into law - remains challenging. Between those two forces, Bitcoin has held its ground, fallen less than feared, and is slowly rebuilding the institutional bid that may help determine whether $80,000 acts as resistance or support.
For educational purposes only — not investment advice.
Past performance is not indicative of future results. The value of investments may fall as well as rise.
This content contains forward-looking statements that involve risks and uncertainties. Actual results may differ materially from those anticipated. Forward-looking statements are based on current expectations and assumptions that are subject to change.
 Long
Long
Oil Shock, Stagflation Signals, and the Fed TransitionCross-Asset Scenario Analysis - Week of April 20-27, 2026
Cross-Asset Scorecard
"Asset | Price | WoW | MTD | YTD | Key Level"
+ "----------------|-----------|---------|--------|--------|----------"
+ "Oil Brent | $95.42 | +5.6% | -4.5% | +44% | R: $100"
+ "Oil WTI | ~$89.00 | +6.0% | +1.0% | +42.7% | R: $92"
+ "Gold | $4,784 | -1.0% | +14% | +59% | S: $4,600"
+ "BTC | $74,228 | -1.75% | +4.3% | -2.8% | S: $73,703"
+ "ETH | $2,268 | -2.71% | -1.6% | -18.3% | S: $2,251"
+ "SOL | $84.04 | -1.68% | -5.5% | -28.4% | S: $82.92"
+ "EUR/USD | 1.1791 | +2.7% | +2.2% | +7.0% | S: 1.1524"
+ "USD/JPY | 158.32 | -1.2% | -1.3% | -5.0% | R: 159.00"
+ "DXY | 98.31 | -2.7% | -2.7% | -5.1% | S: 97.50"
+ "S&P 500 | 7,126 | +3.6% | +3.6% | +2.1% | S: 6,800"
+ "NASDAQ | 24,468 | +5.2% | +9.3% | +7.0% | S: 24,000"
Sources: Crypto.com, Trading Economics, CNBC, Yahoo Finance. Data as of April 20, 2026.
Risk Dashboard
VIX: 17.48 (down 2.56%) | Elevated but easing
Implied Move: S&P ~1.09% daily (VIX/16)
10Y Yield: 4.31%-4.48% range | Ceiling: 4.50%
2s10s Spread: +50bps (FRED) | Normal curve
DXY: 98.31 | Down 5.1% YTD
BTC Funding: Near neutral (CoinGlass) | Balanced
Positioning (CFTC/Saxo, week ending Apr 7)
COT EUR: Net short -7.5K — first in 14 months. Down from +180K Feb. A EUR23.5B swing.
COT Gold: Net long at 25-month low. Profit-taking after +59% YTD.
COT Oil: Net long near 4-year high. Full supply disruption conviction.
FedWatch: May 89% hold | Sep/Nov first cut likely | 32% odds 2 cuts in 2026
BTC ETFs: +$1.1B weekly (CoinShares). IBIT +$871M. IBIT holds ~785K BTC, approaching 800K.
What Moved What
Iran reverses Hormuz reopening - Brent/WTI: +5.6%/+6.0%. Supply disruption premium re-escalated.
March CPI +3.3% YoY / +0.9% MoM (BLS, Apr 10) - 10Y yield 4.48% ceiling; cuts deferred to Sep/Nov.
NFP March +178K vs 60K exp (BLS, Apr 3) - Labour resilience constrains Fed dovish pivot.
Macro Overview
The week opens with two simultaneous shocks: Middle East escalation driving crude oil sharply higher, and persistent US inflation preventing the Fed from easing. A stagflation setup - rising energy costs, sticky CPI, resilient labour market - constraining monetary policy.
March CPI: 3.3% YoY, 0.9% MoM (BLS, Apr 10). Gasoline +21.2%, accounting for three-quarters of the monthly increase. Core CPI: 0.2% MoM / 2.6% YoY — below headline, indicating energy-driven rather than broad-based inflation.
March NFP: +178,000 vs 60K consensus (BLS, Apr 3). Healthcare +76K, construction +26K, transport +21K. Federal government -18K. Unemployment: 4.3%.
Fed rate: 3.50-3.75%. FedWatch: 89% May hold. First cut Sep-Nov. Powell's term expires May 15 — Kevin Warsh (more hawkish) nominated. Confirmation blocked by Sen. Tillis (CNBC, Apr 13-14). If not confirmed by May 15, Powell serves as chair "pro tempore."
Forex Markets
EUR/USD - 1.1791 . Up 2.7% WoW - biggest weekly gain in a year, third consecutive advance. Highest since before the Iran conflict. Support: 1.1524. Resistance: 1.19+.
The COT paradox: EUR has flipped to -7.5K net short (first in 14 months, from +180K in Feb = EUR23.5B swing). Price rallying while specs sell = real money flows, not speculative conviction. More durable but vulnerable to dollar catalyst.
USD/JPY - 158.32 . In the historical BoJ intervention zone. Japan intervened at ~152 in 2022 (JPY9.2T) and ~157-160 in 2024 (JPY9.8T/$62B). Intervention risk elevated.
DXY - 98.31 . Testing Fib support 97.94-98.01. Down 5.1% YTD. Break above 100 = trend change. Break below 97 = acceleration. Friday Core PCE is the catalyst.
Crypto Markets
Bitcoin - $74,228 . Down 1.75% intraday. Range: $73,703-$76,261. Support $73,703 - below = test $70K.
ETF floor holding : $1.1B weekly inflows (CoinShares, strongest since Jan). IBIT +$871M. IBIT holds ~785K BTC (end Q1), approaching 800K. Funding rates near neutral (CoinGlass). OI controlled — not at flush levels ($800M-$1.2B).
BTC Scenarios:
Re-escalation : Iran deepens, oil $100+ — BTC $70,000-$72,000
Stabilisation : Iran flat, PCE ~0.2% — BTC $72,000-$78,000
De-escalation : Breakthrough, oil below $88 — BTC $80,000-$85,000
Ethereum - $2,268 (-2.71%). ETH/BTC ratio 0.0305, approaching cycle lows (0.028-0.032). Below 0.029 = BTC dominance. Above 0.034 = ETH catching up.
Solana - $84.04 (-1.68%). Support $82.92. Resistance $87-88.
Analytical frameworks, not predictions. Past performance is not indicative of future results.
Indices and Commodities
S&P 500 — 7,126 . Record close Apr 17 (+1.20%, FactSet). 7,000 milestone hit Apr 15. Weekly +3.6%, MTD +3.6%, YTD +2.1%. Support 6,800. Q1 earnings: Goldman, Netflix start Apr 22.
NASDAQ — 24,468 . 12-day winning streak — longest since July 2009 (TheStreet, Reuters). Weekly +5.2%, MTD +9.3%.
Gold — $4,784 (+59% YTD) . Pulled back 1% Apr 19 despite oil surge — had already priced geopolitical premium. Structural drivers intact: WGC reports 863t CB purchases in 2025, 95% plan to increase. COT managed money at 25-month low = profit-taking. Real yield +1.0-1.2% (below +2% headwind threshold).
Crude Oil — Brent $95.42 / WTI ~$89 (+5.6%/+6.0%) . Iran reversed Hormuz reopening (Trading Economics, Apr 20). Brent $100 = the week's test. Binary: resolution (oil retreats, risk-on) vs escalation ($100+, may suggest stagflation conditions are developing, gold benefits).
Week Ahead
"Date | Time ET | Event | Consensus | Impact"
+ "-----------|---------|--------------------------------|--------------|-------"
+ "Wed Apr 23 | 09:45 | S&P Global Flash PMI (Apr) | ~52.0 | MED"
+ "Thu Apr 24 | 08:30 | Durable Goods Orders (Mar) | +0.5% | MED"
+ "Thu Apr 24 | 08:30 | Initial Jobless Claims | ~220K | MED"
+ "Fri Apr 25 | 08:30 | Core PCE Price Index (Mar) | +0.3% MoM | HIGH"
+ "Week | Various | Q1 Earnings (mega-cap US) | Mixed | HIGH"
Key event: Core PCE Friday. The Fed's preferred inflation measure. Above 0.3% = may suggest stagflation conditions are developing, cuts to Q4. Below = may be followed by a may be followed by a relief rally across risk assets.
What to Watch
Gold vs Oil: Both rise = broadening inflation (bad for equities). Gold up, oil flat = contained risk.
BTC $73,703: Below on daily close = test $70K. Above $76,261 = dip-buying interest may persist.
EUR/USD paradox: Price up, specs short = real money. Durable but vulnerable to dollar catalyst.
Warsh/Tillis: Any confirmation movement before May 15 = may prompt cross-asset repricing.
Friday Core PCE: Above 0.3% = a significant potential risk-off catalyst for the week.
Traders accessing Forex, Crypto, Gold, and Indices through a unified cross-collateral account can monitor and rebalance from a single screen without moving funds between platforms.
This content is for informational and educational purposes only and does not constitute investment advice or a personal recommendation. Past performance is not indicative of future results. Trading leveraged products involves significant risk and may not be suitable for all investors. The value of investments can fall as well as rise.
STAGFLATION PLAYBOOK: BITCOIN AT $70K IN THE IRAN OIL SHOCKHow 3.3% CPI and Fed Paralysis Are Shaping Three Distinct Q2 2026 Scenarios
Cross-Asset Scorecard
"Asset | Price | WoW | MTD | YTD | Key Level"
+ "------------------|------------|---------|---------|---------|----------"
+ "Gold (XAU) | $4,748 | -0.4% | -0.4% | +18.2% | S: $4,701"
+ "BTC | ~$70,800 | +3.1% | +4.3% | -2.8% | S: $68,000"
+ "ETH | $2,187 | +1.4% | -1.6% | -18.3% | S: $2,000"
+ "SOL | $81.68 | -2.1% | -5.5% | -28.4% | S: $78"
+ "DXY | ~99.0 | -0.9% | -2.7% | -5.1% | R: 101.0"
+ "10Y Yield | 4.25% | -12bps | -8bps | -21bps | W: 4.50%"
Source: Crypto.com, Reuters/CNBC. Data as of April 13, 2026.
Risk Dashboard
CPI (Mar 2026): 3.3% YoY | +0.9% MoM | Highest since May 2024
Fed Rate: 3.50-3.75% | FOMC April 28-29 (next decision)
FedWatch: 40% chance ZERO cuts all of 2026 (Wells Fargo: 0)
BTC ETF Flows: +$471M (Apr 6) | +$269.3M IBIT (Apr 10, 5-wk high)
DXY: ~99.0 | Weakening trend (war + trade uncertainty)
What Moved What
Iran War, Energy, CPI 3.3% (gasoline +21.2%, fuel oil +44.2%) — Fed on hold. Zero cut probability rose to 40%.
CPI Shock, Gold, $4,748 as stagflation hedge demand surged. Gold up 18.2% YTD.
ETF Inflows, BTC, $70K hold despite macro stress. $471M on Apr 6 + IBIT $269.3M on Apr 10.
The Stagflation Environment
When US inflation came in at 3.3% year-over-year for March 2026 — the highest reading since May 2024 —it has significantly constrained the Federal Reserve's policy options, creating a challenging environment for market participants over recent weeks.
The March CPI print, released April 10, showed monthly price growth of 0.9% — the steepest single-month gain since June 2022 (BLS). Gasoline surged 21.2% and fuel oil rose 44.2% in a single month. Energy costs overall rose 10.9%, accounting for nearly three-quarters of the headline price increase. Core CPI — excluding food and energy — rose just 0.2% monthly and 2.6% annually, both 0.1 percentage point below forecast, indicating that underlying inflation remained contained.
For professional traders, the question that defines Q2 2026 is not "will the Fed cut?" — prediction markets assign a 40% probability of zero cuts all year, with Wells Fargo formally removing its rate-cut forecast on April 6 (Reuters). The real question is: what happens to risk assets when both the bull case (Fed cuts) and the bear case (Fed hikes) are off the table?
Why Bitcoin Holds $70K Despite Macro Headwinds
Bitcoin has diverged from typical macro correlation patterns. BTC/USDT trades at approximately $70,800 (Crypto.com), essentially flat on the week. Perpetual futures open interest remains controlled — not at the elevated levels (typically $800M-$1.2B notional) that historically precede sharp corrections.
Three structural factors may help explain the resilience:
1. Institutional ETF demand may be acting as a support level. On April 6, US spot Bitcoin ETFs recorded $471 million in net inflows — the highest single-day figure since late February (CoinDesk, Benzinga). No single ETF registered negative flows that day. BlackRock's IBIT posted $269.3 million on April 10, a five-week high (Bloomberg, CoinGlass). The institutional cohort now represents 67% of total spot BTC ETF AUM (The Block). Total ETF assets: approximately $90 billion with $56 billion cumulative net inflows.
2. The digital commodity classification has changed the regulatory risk premium. On March 17, 2026, the SEC and CFTC jointly classified 16 major cryptocurrencies — including BTC, ETH, XRP, SOL, DOGE, ADA, AVAX, LINK — as digital commodities (SEC/CFTC Joint Interpretive Guidance). A primary source of regulatory uncertainty that historically compressed crypto valuations may have been substantially reduced.
3. DXY weakness is supporting hard assets. The US Dollar Index has slipped toward the 98.88-100 zone, down 5.1% year-to-date, as trade war uncertainty and deficit concerns put downward pressure on the dollar. A weaker dollar may be supportive of Bitcoin, which is priced globally in USD.
The Three Scenarios for Q2 2026
SCENARIO A — BASE CASE (55%): "The Grind"
Fed holds at 3.50-3.75%, guidance stays hawkish, no cut signal
BTC: Range-bound $68,000-$75,000 through May. ETF inflows may provide some support; an absence of a liquidity catalyst could limit upside potential.
Gold: Continues to outperform. $4,700 holds as support; potential test of $5,000.
ETH: Underperforms BTC. $2,000 is key support.
DXY: Stays weak in 98-101 range.
SCENARIO B — BULL CASE (25%): "The Pivot Signal"
Fed acknowledges disinflation if energy reverses; cut signal by June
BTC: A break above $75,000 may become more probable. Reference: during the September 2024 Fed pivot, BTC rallied 34% in 8 weeks. Past performance is not indicative of future results.
ETH: Outperforms BTC. ETH/BTC ratio strengthens.
Gold may consolidate if safe-haven premium eases.
DXY could see downside toward 97.
SCENARIO C — BEAR CASE (20%): "The Hike Whisper"
CPI re-acceleration forces hawkish pivot
BTC: Test of $60,000-$62,000 support. Context: BTC corrected 33% in June-July 2022 when the Fed hiked 75bps.
ETH: Could test $1,800.
Gold: May remain bid — stagflation historically positive for gold (1970s precedent).
DXY: Sharp reversal to 103+.
These scenarios are illustrative. Past performance is not indicative of future results.
Cross-Asset Connections
BTC/ETH divergence: BTC flat-to-up, ETH down 1.1%. Capital concentrating in assets with stronger institutional demand during periods of uncertainty. This pattern has historically been associated with institutional risk-on sentiment in uncertain environments.
Gold dominance: +18.2% YTD versus BTC's -2.8%. The market is asking: which store of value survives stagflation best?
Controlled BTC open interest: OI not at flush levels ($800M-$1.2B). Market in equilibrium, not a crowded long. Reduced cascade risk may support the $68,000-$70,000 zone.
Week Ahead
+ "Date | Time ET | Event | Consensus | Impact"
+ "--------|---------|----------------------------|------------|-------"
+ "Apr 14 | — | Markets closed (Easter) | — | L"
+ "Apr 16 | 08:30 | US Retail Sales (Mar) | +0.4% MoM | H"
+ "Apr 17 | 08:30 | Initial Jobless Claims | 225K | M"
+ "Apr 22 | — | Earnings: Goldman, Netflix | — | H"
+ "Apr 28 | 14:00 | FOMC Rate Decision | HOLD | H"
+ "Apr 29 | 08:30 | Q1 2026 GDP (advance) | +1.2% | H"
Conclusion
Bitcoin at ~$70,800 is holding because the institutional bid is real ($1.5B March ETF inflows), the regulatory overhang has diminished (March 17 classification), and USD cash is unattractive in a 3.3% inflation environment. The FOMC on April 28-29 may clarify which scenario is more likely to materialise. Until then, $68,000 may be assessed as a key BTC support level, gold's $4,700 as a potential base, with the ETH/BTC ratio as one indicator to monitor for directional assessment.
This content is for informational and educational purposes only and does not constitute investment advice or a personal recommendation. Past performance is not indicative of future results. Trading leveraged products involves significant risk and may not be suitable for all investors.
Sources: BLS, The Block, CoinGlass, CoinDesk, Bloomberg, CNBC, Reuters, Wells Fargo Research, CME FedWatch, SEC/CFTC Joint Guidance.
Risk Warning: Trading leveraged products involves significant risk. You may lose some or all of your capital. Gold: The Ultimate Speculation Tool in a Macro-Driven WorldGold has long been considered a safe-haven asset — a store of value when markets turn turbulent. But in early 2026, the precious metal delivered a stark reminder that in today's hyper-connected financial world, it is widely regarded as one of the most actively speculated instruments. Macroeconomic forces — interest rates, the dollar, inflation expectations, and geopolitical shocks — may now significantly influence gold's price swings with greater speed and intensity than in previous cycles. A historic crash in March was followed by a rapid rebound in April, and the full arc of this episode illustrates how significantly global macro dynamics may influence gold prices.
The Crash: A Fall Steeper Than 2008
In March 2026, gold suffered its worst monthly decline since October 2008. The metal fell more than 11%, closing the month at $4,672 per troy ounce — after plunging as low as $4,099 on March 23 (1) , a level not seen since late November 2025. Measured from its all-time high of $5,595 on January 30, the peak-to-trough drawdown reached nearly 27%.
The trigger was geopolitical: on the final day of February, the United States and Israel launched a full-scale military operation against Iran. The consequences were immediate and severe. Even ignoring oil prices, global equity markets reeled. European indices fell 6 - 11% over the month; Asian markets dropped 11 - 19%, with South Korea's KOSPI losing 19% and Japan's Nikkei shedding 13.3%. The wave of selling forced leveraged investors, including hedge funds to close margin positions and raise cash quickly. Gold, as one of the most liquid assets around after its record-breaking rally in early 2026, was an obvious source of funds.
The Macro Mechanism: Why Gold Lost to the Dollar
Beyond the immediate liquidity crunch, deeper macroeconomic forces were at work. The energy shock reignited inflation fears - and with them, a sharp repricing of Federal Reserve expectations. In February, markets had priced in two rate cuts by year-end, bringing the fed funds rate down to 3.0 - 3.25%. By the end of March, those cuts had been fully priced out, with most participants expecting rates to stay in the 3.5 - 3.75% range through December.
The numbers confirmed the exodus. According to Bloomberg, total assets held by gold exchange-traded funds fell by more than 94 tonnes in March — to 3,040 tonnes, the lowest since December 2025, and the sharpest ETF outflow since autumn 2023. Data from EPFR, as compiled by Bank of America, showed net sales of gold fund shares totalling $13.5 billion over the four weeks ending March 25. Over the same period, net inflows into US Treasury bonds reached $30 billion.
The Rebound: Investors Return to Gold
By early April, the narrative had reversed. After one of the sharpest corrections in recent memory, gold began to recover and investors came back fast. According to EPFR data compiled by Bank of America, net inflows into gold funds reached $3.5 billion in the week ending April 4 (2) nearly four times the prior week's figure and the highest weekly inflow since late February. Over two weeks, cumulative net inflows totalled $4.4 billion.
Gold ETF assets ticked up again: by April 8, total holdings had climbed to 3,065 tonnes, adding more than 20 tonnes since the start of the month. Gold prices recovered to $4,750 - 4,850 per ounce recovering to mid-March levels, with a two-week gain of nearly 5.7%.
The Three Macro Levers That May Influence Gold
The March crash and April recovery together illustrate a key dynamic in modern gold markets: the metal's price may be increasingly influenced by three macro variables, each of which can swing violently and quickly.
1. US real interest rates. When Treasury yields rise faster than inflation expectations, gold suffers - it pays no coupon, and every basis point added to real rates is a basis point of opportunity cost for holding bullion. Conversely, when rates fall or look set to fall, gold may rally.
2. The US dollar. A stronger dollar makes gold more expensive for non-dollar buyers, reducing global demand. Dollar weakness - driven by doubts about US fiscal sustainability, massive deficits, and the country's $36 trillion debt load - was a significant driver of gold's performance in 2025. That structural backdrop remains a focus for market participants. Debt levels remain elevated.
3. Geopolitical risk and the global risk appetite. War, energy shocks, and financial market volatility create both demand for gold (as a safe haven) and forced selling (as a source of liquidity). The March episode showed that these forces can cancel each other out - and even overwhelm - the safe-haven bid in the short term.
Near-Term Outlook: Ranges, Risks, Catalysts
The April 28–29 (3) FOMC meeting may be a significant event. Markets currently assign a very high probability to rates staying in the 3.5 - 3.75% range, but incoming data on PCE inflation and the labor market will be closely monitored. The longer the Strait of Hormuz remains disrupted, the greater the inflationary pressure — and the more the Fed may face significant policy constraints.
The Structural Bull Case: Why the Big Banks Stayed Bullish
Despite the March carnage, the major investment banks did not abandon their bullish gold forecasts. J.P. Morgan called the sell-off "technical positioning" rather than a fundamental shift, and kept its full-year target unchanged: an average price of $5,530 per ounce in Q2, rising to $5,900 in Q3 and $6,300 in Q4 2026. Goldman Sachs held its year-end target at $5,400, explicitly noting that it saw only short-term pressure but continued to build its base case around ongoing reserve diversification, normalisation of speculative positioning, and eventual Fed easing.
Conclusion: Gold's New Reality
This is gold in 2026: a prominent macro trade. Its price is shaped less by physical supply and demand, and more by central bank policy expectations, dollar dynamics, inflation trajectories, and the shifting winds of geopolitics. For speculators, this means extraordinary opportunity - and extraordinary risk. For long-term investors, the structural case is intact: as long as US fiscal imbalances persist, global de-dollarisation continues, and the world remains geopolitically fragmented, gold will remain the anchor asset of an uncertain era.
For educational purposes only — not investment advice.
This content contains forward-looking statements that involve risks and uncertainties. Actual results may differ materially from those anticipated. Forward-looking statements are based on current expectations and assumptions that are subject to change.
Long 
The Jobs Number That Broke the NarrativeMarch NFP Tripled Expectations — But the Story Underneath Is More Complicated Than the Headline
Cross-Asset Scorecard
| Asset | Price | WoW | MTD (Mar) | YTD | Key Level |
|-----------|----------|--------|-----------|--------|------------|
| Oil Brent | $118.35 | +5.1% | +63% | +67% | R: $120 |
| Oil WTI | $101.00 | -1.5% | +51% | +53% | S: $100 |
| Gold | $4,563 | +3.0% | -17% | -18% | S: $4,375 |
| BTC | $69,230 | +2.5% | -7% | -45% | R: $71,000 |
| ETH | $2,134 | +3.8% | -3% | -38% | R: $2,200 |
| EUR/USD | 1.1550 | +0.4% | -2.1% | +7.1% | S: 1.1440 |
| S&P 500 | 6,575 | +3.6% | -5.4% | -5.0% | R: 6,700 |
| NASDAQ | 21,841 | +5.0% | -5.8% | -7.2% | R: 22,500 |
| DXY | 99.80 | -0.4% | +1.2% | -5.1% | S: 99.00 |
| VIX | 27.50 | -11% | — | — | Declining |
Risk Dashboard
VIX: 27.50 (▼ from 31+) | Easing but elevated
10Y Yield: 4.31% (▼ 17bps WoW) | Powell calmed hike fears
2s10s: +48bps | Stable
FedWatch: Apr 29: 95% hold | Hike odds 2.2%
BTC Funding: Negative → neutral | Longs flushed
BTC ETFs: +$2.5B gross Mar, -$296M last week
For informational and educational purposes only — not investment advice.
+178,000 Jobs. The Market Couldn't React. And That's the Story.
Friday, April 3 delivered the kind of number that would normally move everything. March Non-Farm Payrolls came in at +178,000 — three times the +60,000 consensus (FXStreet, FactSet). After February's -133,000 jobs (revised from the initially reported -92,000), this was the strongest rebound since the pandemic recovery.
But here's what makes this NFP uniquely strange: nobody could trade it.
Markets were closed for Good Friday.The data was released at 08:30 ET while equity markets were closed. FX and crypto traded through the weekend, equities were locked until Monday morning. This created a rare disconnection — by the time equity traders could react, crypto had already priced in two days of sentiment shifts, and the initial shock had faded.
The result: Monday (today) opened with a relief rally — S&P +3.6% for the week, NASDAQ +5.0% — but the rally was driven less by the NFP itself and more by two other catalysts that arrived simultaneously: the WSJ report that Trump may end the war without reopening Hormuz, and Powell's Harvard speech signaling no rate hike.
This matters for positioning. The NFP was genuinely strong, but it landed in a market that had already re-priced dramatically over the weekend. Traders who set up positions based on the data couldn't execute for 72 hours. Those who traded crypto over the weekend caught the move — BTC rallied from ~$66,000 to $69,230 by Monday.
Past performance is not indicative of future results.
Under the Hood: Why +178K Isn't What It Looks Like
The headline screams recovery. The details tell a different story.
Healthcare: +76,000. This single sector contributed 43% of the total gain. But the majority of those jobs — an estimated 55,000-60,000 according to BLS footnotes — were Kaiser Permanente and UNAC/UHCP strike workers returning to payrolls. They weren't new jobs. They were the same jobs that disappeared in February's -28K healthcare print now showing up as a positive. This is arithmetic, not economic strength.
Stripping out the strike effect: +178K minus ~55K strike rebound = ~123K underlying job growth. That's better than February's adjusted figure, but still below the 180K monthly average that economists consider healthy for a labor market of this size.
Where the weakness persists:
- Federal government: continued contraction, now in its fourth consecutive month of job losses
- Manufacturing: -8K, reflecting both tariff uncertainty and the oil-driven input cost squeeze
- Information sector: -6K, tech hiring freeze deepening
The wage signal: Average hourly earnings came in at +3.5% YoY, down from +3.8% in February. This is the first deceleration since October 2025. For the Fed, this is actually into a void — it suggests that wage-driven inflation pressure is easing even as energy-driven inflation surges. Two different inflation stories, moving in opposite directions.
This is the core tension: the labor market is recovering from a strike distortion, not accelerating. Wages are cooling. But oil is at $118 and the next CPI print (April 10) may show headline inflation above 3.4%. The Fed is watching two movies at once.
Powell's Harvard Address: What He Actually Said
Monday's rally wasn't just about NFP. It was about Fed Chair Powell's March 30 speech at Harvard, which fundamentally reset rate expectations.
Three key messages traders extracted:
1. No hike. Markets had priced a 50%+ probability of a rate hike by December just days earlier. Powell's "wait and see" posture killed that trade. Hike odds collapsed from 50% to 2.2% within hours (CNBC). This was the single biggest driver of the Treasury rally — 10Y yields fell 17bps from 4.48% to 4.31% by week's end.
2. "Energy shocks tend to come and go pretty quickly." This is textbook Fed playbook: look through temporary supply shocks, don't tighten into them. Powell explicitly referenced the 1970s mistake of over-tightening into an oil shock. The message: even if CPI hits 3.4% in March, the Fed views it as transitory (they're using that word carefully this time).
3. "A critical, essential aspect... is you have to carefully monitor inflation expectations." This is the guardrail. Powell will tolerate higher headline CPI as long as expectations remain anchored. The University of Michigan 1-year expectations jumped to 3.8% in March — the biggest monthly increase since April 2025. If the next reading pushes above 4.0%, Powell's "wait and see" shifts to "we need to act." That's the line in the sand.
What this means for multi-asset traders: The yield-driven regime that crushed gold (-17% in March) and pressured crypto may be fading. If real yields stabilize or decline from here, Gold and BTC could find a floor. But the floor depends entirely on whether the next inflation data confirms Powell's "transitory" thesis or blows it up.
Trading leveraged products involves significant risk. The value of investments can fall as well as rise.
The Cross-Asset Regime Shift Nobody Is Talking About
March was dominated by one trade: long oil, long dollar, short everything else. April may look different. Here's why.
The war premium is fragmenting. In March, every asset moved on the same catalyst (Hormuz). Now different catalysts are pulling different assets. The WSJ report about Trump ending the war pushed equities up but oil down. Powell pushed yields down but gold up. BTC rallied on weekend liquidity while equities were closed. The monolithic "risk-off" trade is breaking apart.
Three divergences to watch:
1. Gold vs. Real Yields — correlation breaking? Gold rallied 3% last week despite 10Y yields still at 4.31%. In March, gold sold off violently as yields rose. Now yields are flat-to-lower and gold is recovering. If this pattern holds, it suggests gold has absorbed the yield shock and is re-coupling with its geopolitical safe-haven role. JP Morgan (target $6,300), UBS ($6,200), and BNP Paribas ($6,000) all maintained their year-end targets through the selloff. Managed money COT positioning was flat for four weeks at ~168K contracts — traders weren't capitulating, they were waiting. That patience may now be rewarded if yields decline further.
2. BTC vs. Equities — timing gap creates opportunity? BTC rallied from $66K to $69,230 over the Good Friday weekend while equities were frozen. When equities opened Monday, they rallied 3.6% — catching up to what crypto had already priced. This is the structural advantage of 24/7 markets: crypto acts as a real-time sentiment proxy when traditional markets are closed. BTC ETFs saw $2.5B gross inflows in March despite the late-month outflows (-$296M in the final week). The funding rate turned negative, indicating longs were flushed — a setup that preceded a 22% rally in January 2026.
past performance is not indicative of future results
3. EUR/USD vs. Oil — the feedback loop easing? In March, the mechanism was clear: oil up → imported energy costs → EUR down. EUR/USD fell from ~1.18 to 1.15. But if Trump genuinely moves toward ending the war (WSJ), oil drops → energy import costs drop → EUR recovers. The COT data shows EUR net longs collapsed from 174K to 21K — the fastest selling since 2018. This extreme positioning means even a modest de-escalation could trigger a sharp short-covering rally in EUR. The inverse is also true: if Hormuz escalates further, EUR has less downside cushion because most sellers have already sold.
Oil Markets in the Crossfire1. A Year in Two Halves
Through most of 2025 and into early 2026, crude oil traded in a relatively contained range. WTI hovered in the mid-$60s per barrel, weighed down by expectations of an OPEC+ supply surplus and soft global demand growth. Brent tracked closely, with a modest premium. Geopolitical risk was present - U.S.-Iran nuclear talks were stalling, and tension in the Gulf was rising - but the market had largely priced in a "high tension, no escalation" baseline. That baseline was shattered on February 28, 2026.
2. Five Moves That Moved Markets
① U.S. and Israel launch strikes on Iran (Feb. 28) Joint airstrikes on Iranian military and government sites, triggered an immediate market response. WTI surged 8.6% to $72.79/bbl within days; Brent jumped 9% to $79.41/bbl, a seven-month high. The market began pricing a risk premium it had long been reluctant to assign.
② Iran closes the Strait of Hormuz (March 2 - 4) Iran's IRGC issued warnings prohibiting vessel passage through the strait. Tanker AIS signals went dark, war-risk insurance became commercially unviable, and traffic ground to a halt. With roughly 20% of global seaborne oil flowing through this 21-mile chokepoint, the market shifted from pricing geopolitical risk to pricing a real supply disruption. Brent pushed toward $82, then $94.
③ Gulf infrastructure comes under fire (March 9 - 19) Retaliatory Iranian drone and missile strikes hit oil storage facilities in Saudi Arabia, port infrastructure in Qatar, and Kuwait's oil headquarters. With the world's largest spare-capacity producer unable to reroute exports, and with Middle East production shut-ins estimated at 7 - 12 million barrels per day by mid-March, Dubai crude hit a record $166/bbl on March 19. The IEA called it the largest supply disruption in the history of the global oil market.
④ Strategic reserve release fails to cap prices (March 11–23) IEA member nations agreed to release a record 400 million barrels from strategic stockpiles — the U.S. alone contributing 172 million barrels from the SPR. Oil prices barely blinked. Brent crossed $100/bbl and held there.
⑤ Ceasefire signals whipsaw prices (March 23 – April 6) Trump's alternating threats and diplomatic overtures have become a key short-term market driver. A single Truth Social post announcing "productive talks" and a 5-day pause on energy infrastructure strikes sent Brent crashing 11% from $114 to $100 in one session. Days later, fresh ultimatums pushed WTI back above $111.
By March's end, Brent had posted its largest monthly gain since records began in the 1980s — more than 60% in a single month.
3. Futures Contracts: What the Market Is Pricing
Contract | Price (approx.) | Signal
-----------------------|-----------------|----------------------------------
WTI May '26 (front) | ~$112/bbl | Active war premium, Hormuz standoff
Brent May '26 | ~$109/bbl | Unusual inversion vs. WTI
WTI June '26 | ~$102-105/bbl | Partial Hormuz reopening priced in
Brent Q3 '26 (EIA) | ~$80/bbl* | Gradual resolution assumed
Brent Q4 '26 (EIA) | ~$70/bbl* | Return toward pre-conflict levels
*EIA Short-Term Energy Outlook, March 10, 2026. Highly scenario-dependent.
The curve suggests that near-term contracts reflect the reality of disruption; while further-dated contracts reflect the market's expectation that this crisis may eventually resolve. The spread between them reflects uncertainty about how long the disruption will last.
4. What Would Change the Trends?
Scenarios that could push prices sharply lower:
A confirmed ceasefire and Hormuz reopening agreement - WTI could fall to the mid-$80s quickly
U.S. military seizure of the strait and forced resumption of tanker transit
A political transition in Iran that removes the current regime's incentive to maintain the blockade
Scenarios that could push prices sharply higher:
A massive strike on Kharg Island and destruction of supply infrastructure, which handles ~90% of Iran's crude exports; destruction could remove 1.5–2 mbd of supply for years, potentially pushing Brent past its 2008 record of $147/bbl
Formal mining of the Strait of Hormuz
Widening of the conflict to draw in additional actors (Houthi forces have already launched their first missiles toward Israel)
A sustained 10-week+ closure forcing demand rationing globally — GoldmanSachs warns this could see Brent exceed all-time highs; some analysts are stress-testing $200/bbl scenarios
The asymmetry matters: the downside scenarios are sharp but recoverable. The upside scenarios carry the potential for a structural, multi-year energy shock.
5. Final Thoughts
Oil markets are volatile - profoundly so by historical standards. Yet that volatility is operating within a range the market has, so far, been able to define and contain. Major headlines move prices by 5–10%. Each side is extracting maximum leverage from the current standoff: Iran holds the Hormuz card; the U.S. holds the threat of further escalation and the economic pressure that rising energy costs place on global growth.
The market appears to be pricing this as a severe but potentially finite crisis, as long as it stays within the boundaries of the current conflict. The scale of volatility is determined by the market's own assessment of resolution probability, and that will only shift materially with significant escalation or significant de-escalation. Until one of those triggers arrives, the whipsaw may continue.