The Tether Funding Trade: Collect Yield or Bet on a DepegTL;DR
There's a trade on BitMEX that pays a delta-neutral yield of roughly up to 43% a year; the same structure could also turn into a cheap bet that pays off big if Tether ever loses its $1 peg.
Both come from one gap: the difference in funding (the “cost to hold”) between BitMEX's two Bitcoin perpetuals – XBTUSD (margined in Bitcoin) and XBTUSDT (margined in Tether). They track the same Bitcoin price, but the two charge different fundings, and that difference makes up the whole trade:
Trade 1 – Farm the Yield: Collect the funding difference between the two contracts. It's market-neutral (you don't care whether Bitcoin goes up or down) and has paid about 4% a year with no leverage, or ~13% at 10× leverage. The catch: this position quietly leaves you holding Tether, so you lose if Tether ever breaks its peg.
Trade 2 – Bet on a Depeg: Do the exact opposite. You pay that small funding difference as a running cost, and in return you get paid a lot if Tether ever falls below $1. Your loss is capped at the small cost but your payout is not.
Recap: XBTUSD <> XBTUSDT
BitMEX offers two distinct Bitcoin perpetuals, each serving a different trading crowd. The divergence in their funding rates creates the trading opportunities we've explored:
XBTUSD (Inverse): Margined in Bitcoin, PnL is in Bitcoin. Favored by long-term holders and hedgers who want pure Bitcoin exposure without the stablecoin risk.
XBTUSDT (Linear): Margined in Tether, PnL is in Tether. The industry-standard format favored by stablecoin traders who tend to lean long.
While both track the same Bitcoin spot price, they maintain separate order books and funding rates. Because the stablecoin crowd leans long, XBTUSDT typically commands a higher funding cost. This delta, the difference in the “cost to hold”, is the source of our yield farming and depeg hedging strategies.
It's a BitMEX Trade
Thanks to multi-asset-margin on BitMEX, you can execute this strategy seamlessly in one place:
Unified Margin: Open both positions (long/short XBTUSD and the inverse on XBTUSDT) using only USDT collateral within a single account.
Efficiency: Capture the funding spread directly. There is no need to move collateral between exchanges or manage counterparty risk.
This integrated environment allows you to manage the entire trade—whether you’re farming yield or betting on a depeg—with maximum operational efficiency.
Trade 1 — Farm the Yield
XBTUSDT has cost more to hold than XBTUSD for most of the last 4.6 years.
While returns are market-dependent—averaging 4.33% over the long term—recent windows have been tighter, with 1.33% over the last year and 0.53% over the previous quarter. Interestingly, XBTUSDT only carries a higher premium 46.5% of the time; the yield is driven by the magnitude of these spreads rather than their frequency.
That said, profits arrive in aggressive bursts rather than a steady stream. Execution involves a short on XBTUSDT paired with an equal long on XBTUSD. This delta-neutral structure eliminates Bitcoin price risk, allowing you to harvest the funding gap.
Amplifying Returns with Leverage
Because this trade is delta-neutral and insulated from directional price risk, you can apply leverage to amplify your funding capture. This strategy effectively transforms modest single-digit returns into substantial double-digit gains of 13%-43.2% with 10x leverage.
The Risk: Tether Depeg
Behind the attractive yield lies a hidden risk factor: once your Bitcoin exposure is neutralised, you are essentially holding a long position on Tether's stability. Think of the funding you harvest as compensation for absorbing Tether risk. Should USDT falter, this trade absorbs the blow—and leverage multiplies the damage.
Trade 2 — Bet on a Depeg
Execute the reverse: short XBTUSD and go long XBTUSDT. Your Bitcoin exposure is again neutralised, but you are now positioned to profit if Tether breaks its $1 peg.
The mechanics are simple: monitor the XBTUSD / XBTUSDT ratio, which represents the market's implied valuation of Tether. While the peg is secure, the ratio hovers near 1.00. Should Tether slip to $0.98, the ratio follows; your long on XBTUSDT appreciates relative to the short, capturing the spread as pure profit. This is effectively a direct wager against Tether's stability, executable via two standard BitMEX orders without requiring specialised accounts or additional counterparties.
The Cost:
You pay the funding divergence described in Trade 1—historically between 1.3% and 4.3% annually. View this as a modest, recurring premium for a high-convexity payout.
The Payout:
The payout mirrors Trade 1 in reverse – where every loss is now inverted into a gain.
Your loss is limited to the small fee you pay (plus minor moves if Tether trades slightly above $1). Your payout would be substantial if Tether becomes insolvent.
Tether Depegs in the past
In normal conditions, the depeg bet generates no returns. Payouts occur only under periods of intense stablecoin stress. To evaluate the trade’s viability, we analysed 1-minute historical data to capture the precise maximum spread during actual crises. Below is the record of the divergence between XBTUSD and XBTUSDT during three major market shocks. The depeg bet harvests this divergence; the yield farmer absorbs the corresponding loss.
Note that tick data may differ; these figures are used for illustrative purposes to demonstrate the concept.
Terra May 2022 (win) : The contracts diverged by +5.6% at the peak of the panic—XBTUSD traded at ~$25,900 while XBTUSDT hit ~$27,300, effectively pricing Tether at ~$0.95. This move delivered a +56% return at 10× leverage for depeg bettors.
FTX Nov 2022 (win): The spread widened to +2.0%, netting a ~20% gain at 10× leverage.
USDC / Silicon Valley Bank Mar 2023 (loss) : The gap inverted to -1.2% as capital rotated from USDC into Tether. Because this trade is a specific short on Tether, a flight to Tether’s perceived safety results in a ~12% loss at 10× leverage.
Crucially, this position is effectively a short on Tether’s stability. While systemic shocks to rival stablecoins can temporarily drive Tether to a premium, its long-term resilience is noteworthy; USDT has not slipped more than 0.4% below par over the last 4.6 years.
Farm the Yield, or Own the Tail
Farm the Yield if you believe the stablecoin crowd will continue paying a premium to maintain long exposure (a trend persisting for four years), while the funding divergence maintains its 4% average and Tether continues to weather systemic shocks. This delivers a consistent, equity-like yield without directional Bitcoin exposure—provided your leverage is calibrated to survive volatility.
Bet on a depeg to secure a high-convexity position with capped downside; you pay a nominal annual premium for a massive payout during a legitimate Tether solvency crisis. The primary caveats: yield compression occurs during stagnant periods. It may work against you if capital rotates into Tether during a rival stablecoin's collapse, as seen in the USDC depeg in early 2023.
Why Soaring Bond Yields Point to a Bitcoin SupercycleRising global borrowing costs have triggered panic across traditional fixed-income markets. In our view, this is not a systemic crash to flee from. It is the necessary precursor to a massive structural shift. Driven by fractured supply chains, astronomical AI infrastructure spending, and an unsustainable debt load, the legacy fiat system is buckling. Central banks are backed into a corner. They must choose between a sovereign debt collapse or debasing their currencies. For Bitcoin, the upcoming volatility will be chaotic in the short term, but it serves as the ultimate structural tailwind for a long-term supercycle.
TL;DR
Sovereign debt markets are approaching a breaking point. The 30-year US Treasury yield surging past 5.14%, alongside Japan's ten-year JGB hitting 2.80%, is draining global liquidity and threatening the plumbing of the traditional banking system.
The Federal Reserve can no longer engineer a Volcker-style rate hike. Sustaining high interest rates to fight inflation is mathematically impossible. The resulting interest expense on $39 trillion of national debt would immediately bankrupt the US Treasury.
Central banks will default to stealth liquidity. To prevent a sovereign debt crisis without publicly announcing Quantitative Easing, policymakers will manipulate regulatory plumbing to artificially cap yields. Expect bank leverage exemptions and unannounced Treasury buybacks.
Traders must survive short-term liquidations to capture long-term upside. As traditional finance dumps liquid risk assets to cover bond losses, Bitcoin will experience acute, sharp drawdowns. However, as backdoor liquidity floods the system, Bitcoin will violently re-rate higher as the premier inflation hedge of the market.
Yield Panic: High Inflation and Heavy Borrowing Demand
The current spike in long-term yields is a structural repricing of global sovereign risk. It is not a random market fluctuation. As of May 2026, the 30-year US Treasury yield has broken past 5.14%, while the ten-year yield sits dangerously close to 4.62%. This is the violent collision of two massive tectonic plates in the global bond market.
The End of the Japanese Carry Trade: For decades, Japan served as the cheapest ATM in the world, allowing global macro funds to borrow cheap yen to buy higher-yielding Western assets. That era is definitively finished. The Bank of Japan is watching its ten-year Japanese Government Bond yield trade at 2.80%. We have not seen this level since the late 1990s. Persistent domestic inflation drives this reality. Japan is historically the largest foreign holder of US debt. As domestic Japanese yields become attractive and the central bank acts to defend a weakening yen, Japanese institutions are rapidly repatriating capital. By dumping US Treasuries to bring cash home, they remove the anchor buyer from the US debt market. Western liquidity is bleeding.
The $39 Trillion Debt and the AI Inflation Spiral: Just as foreign buyers step back, Washington is issuing debt at a parabolic rate. The US national debt has officially crossed the $39 trillion threshold, and recent Treasury auctions meet visibly weak institutional demand. The technology sector acting as an economic black hole exacerbates this. The top four hyper-scalers are on track to spend a combined $725 billion on AI infrastructure in 2026 alone. This unprecedented demand for data centres, high-end semiconductors, copper, and massive gigawatt grids is colliding with geopolitical energy shocks. The resulting structural inflation forces bond markets to realise the Federal Reserve is behind the curve. Investors demand a massive term premium to compensate for holding long-duration paper while inflation destroys its future purchasing power.
The Dilemma of the Fed: Trapped by Math and Politics
In a vacuum, the textbook central bank response to structural inflation is to hike rates and destroy demand like 1979. In 2026, the Federal Reserve is trapped.
The political mandate in Washington relies on a booming domestic stock market, industrial reshoring, and aggressive economic growth. If the Fed attempts to engineer a severe recession to combat commodity and AI-driven inflation, it will face overwhelming, immediate political retaliation.
Even if the political will existed, the math simply does not work. With the national debt at $39 trillion, keeping rates at these levels means the annualised interest expense of the government will soon consume the entire federal tax base. A sovereign debt crisis is a mathematical certainty if long-term yields rise unchecked.
Because the Fed cannot hike rates further without bankrupting the Treasury, and the government will not stop deficit spending, the pressure falls entirely on the currency. When bond yields threaten the commercial banking system, policymakers will pivot. They will not announce a massive Quantitative Easing programme on live television. Instead, they will utilise stealth liquidity.
The Backdoor Bailout: Stealth Liquidity
If the Fed cannot hike rates further without bankrupting the Treasury, and the government cannot stop issuing debt to fund the AI race and military obligations, the fiat currency itself must give.
When sovereign bond yields reach a breaking point that threatens to collapse the commercial banking system, policymakers will pivot. They will choose to manipulate the regulatory plumbing through stealth liquidity. Traders should expect backdoor interventions such as:
Exempting the eSLR (Supplementary Leverage Ratio): Allowing commercial banks to hold unlimited amounts of US Treasuries without needing to back them with core capital. This forces the banking sector to absorb excess government debt.
Treasury Buyback Programmes and Disguised Liquidity Facilities: Implementing targeted, unannounced interventions to cap long-term borrowing costs under the guise of market stability.
Yield Curve Control (YCC): Unofficially capping yields at a hard ceiling to prevent the debt servicing costs of the government from triggering a default spiral.
Faced with an impossible choice, authorities will always choose to save the bond market and fund the state at the direct, deliberate expense of the purchasing power of their currencies.
Trading the Chaos: Short-Term Pain Versus Long-Term Gain
For Bitcoin traders, navigating this market shift is all about timing. As we move from a bond market panic to a massive government bailout, the ride will be messy. You need to separate the short-term noise from the long-term reality.
The Short-Term Flush: When bond yields spike, traditional funds bleed cash. To cover their losses, they panic-sell whatever they can, including Bitcoin. Because the old guard still views Bitcoin as just another risky asset, it will get dragged down with the rest of the stock market. Expect some ugly, short-term drops and forced selling.
The Long-Term Boom: Eventually, the pain gets too severe, and central banks will be forced to quietly turn the money printers back on to save the system. That is when the game completely flips. Money will desperately seek out assets the government cannot print. With Wall Street ETFs draining supply, Bitcoin is the ultimate defence. It has zero debt risk and no single point of failure.
The Bottom Line
Surging yields are not the end of the world. They are the trigger that will force governments to devalue their own fiat currency just to survive.
For the smart trader, the strategy is simple. If you are long, do not get shaken out and sell into cash during the panic. Ride out the short-term volatility, aggressively buy the dips, and position yourself in the hardest asset available before the rest of the market realises the money printers are already running.  Long
Long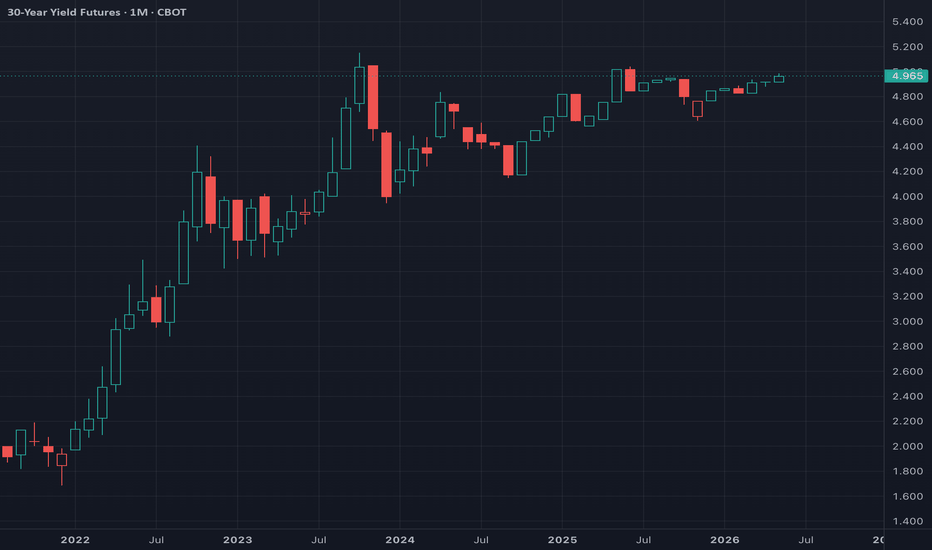
NEAR Protocol: Time to Buy the Dip?NEAR is back on everyone’s radar, and for three good reasons.
NEAR Intents demand
Privacy upside via Zcash flows
Founder-led AI narrative
The cleanest valuation point is no longer just that NEAR is cheaper than other cross chain bridges like LayerZero. With NEAR Intents fees in the picture, NEAR trades at roughly 56x annualised fees, making it cheaper than Ethereum, Solana, Aptos, Sui, Avalanche, and Injective on the same fee multiple framework.
The market is still pricing NEAR like a mid-tier L1, while the protocol is starting to look like a cross-chain execution layer with privacy and AI upside.
TL;DR
NEAR is showing a renewed setup driven by a live fee engine via NEAR Intents and two massive narrative call options in the form of privacy and AI.
Arthur Hayes has named NEAR his next favourite altcoin, highlighting its powerful combination of privacy and positive cash-flow potential.
NEAR Intents is generating roughly 18x LayerZero’s 30-day fees, yet NEAR trades at a fraction of ZRO’s fee multiple.
The tokenomics are improving. Inflation was recently cut to 2.5 per cent, and transaction fees actively burn supply, shifting NEAR towards a cash-flowing execution asset.
When combining base-chain gas and Intents fees, NEAR trades at a 56x annualised fee multiple, making it cheaper than Ethereum, Solana, and most major L1 peers. This presents a compelling valuation.
What is NEAR?
NEAR is no longer an old L1. It is evolving into a cross-chain execution layer equipped with two narratives – privacy and AI.
Privacy has already proven to be a powerful crypto use case through Zcash (ZEC). While NEAR does not directly compete with privacy coins, it benefits as the execution layer around privacy demand for such tokens. Zodl (previously Zashi), a Zcash network wallet, is a prime example. Zodl can be used to directly purchase Zcash without KYC and utilises Zcash seamlessly in payments. In payment scenarios, Near Intents can also help with converting Zcash to other crypto like USDC, making it much easier to purchase and spend while also protecting privacy. Users state the outcome they want and solvers compete to execute it
AI is the second call option. NEAR has a better claim here than most crypto AI tokens. Illia Polosukhin, NEAR’s co-founder, co-authored Attention Is All You Need, the Transformer paper behind modern LLMs. NEAR also began as an AI company before pivoting into the blockchain space. The real question is whether AI can create fees. NEAR AI is building towards that through AI Cloud, IronClaw, Agent Market, and Intents. AI agents will not manually bridge assets, manage gas, or compare routes across chains. They will express outcomes. NEAR Intents is built for that world.
Why Altcoin OGs Should Care
Arthur Hayes has made NEAR tradeable again. In The Butterfly Touch, he frames the next crypto leg as a liquidity-driven move tied to AI capex, war spending, infrastructure spending, and easier credit. He named NEAR as his next favourite altcoin after HYPE and ZEC. .
The important part is why. His claim isn’t all about AI. It’s that privacy on top of NEAR Intents can create a positive cash-flow setup for the NEAR protocol. This matters because the best altcoin trades need both narrative and numbers. NEAR now has both.
The On-Chain Signal
The market is still focused on LayerZero, Stargate, CCIP migrations, and bridge security. The current fee data points somewhere else entirely.
NEAR Intents is generating roughly 18 times LayerZero’s 30-day fees, but NEAR trades at about one-third of ZRO’s fee multiple. That is the first disconnect.
The caveat is important. Gross Intents fees are not the same as token holder revenue. Captured revenue is much smaller today, sitting around $149,000 over 30 days. The trade depends on whether NEAR can convert usage into more revenue capture, buybacks, burns, staking, locking, or other supply-management tools.
Why a Market Rerate is Still on the Cards
NEAR does not appear cheap when only looking at base-chain gas. However, that misses the thesis. The current NEAR trade is base-layer activity plus NEAR Intents, which is already generating meaningful cross-chain execution fees.
This is the strongest relative valuation point. NEAR is still priced like a mid-tier L1. If Intents are treated as part of the NEAR economic stack, the valuation looks more like a real execution business.
What to Watch Out For
For non-degens, this is not the cleanest trade like HYPE. The biggest risk is that the market prices the call options before the token captures enough economics. Even though NEAR’s multiples are low enough compared to other L1s, it is still a high multiple in the eyes of traditional investors.
The cleanest confirmation would be continued NEAR Intents fee strength plus visible buybacks or revenue routing on the NEAR revenue dashboard, which hasn’t started yet.
We would fade it if NEAR rallies only on Hayes, AI, or privacy headlines while Intents fees and NEAR’s actual AI developments stays tiny.
Final Take
NEAR now has one overlooked fee engine and two call options in privacy and AI.
The valuation setup is key. On a combined base-chain plus Intents fee view, NEAR trades around 56x annualised fees. That is cheaper than major L1 peers and much cheaper than LayerZero (ZRO) on a bridge-fee comparison. Arthur’s latest blog brought attention, but the data is what makes the trade sustainable. Long NEAR if we see new AI features, growing fees and updated revenue capture mechanism keep confirming the story.
MSTR Earnings Recap: Opening Up Arbitrage OpportunitiesCore Trading Summary (TL;DR)
This MicroStrategy (MSTR) earnings report has completely rewritten its playbook: moving away from the old strategy of "mindlessly printing stock to buy Bitcoin," the company has now established a transparent, official metric—a 1.22x mNAV (Net Asset Value) premium. This specific number will dictate whether MSTR buys or sells coins moving forward.
For MSTR:
Premium > 1.22x: Continue the old playbook. Issue high-priced shares and use the cash to buy BTC.
Premium < 1.22x (The Core Reversal): Issuing more stock is no longer cost-effective. Management has explicitly stated that if the premium drops below this level, they will sell BTC and use the cash to pay down debt or repurchase stock.
How to Arbitrage: If MSTR's premium drops below 1.22x, it triggers a conditional arbitrage opportunity to "Go Long on MSTR, Go Short on BTC." Because at this point, the company will personally step in to "sell Bitcoin and buy its own stock," and this selling action will close the spread. Management's explicit statement is the core underpinning for this arbitrage trade.
For STRC (Preferred Stock):
Previously, the market feared that an MSTR liquidation would turn this 11.5% dividend preferred stock into wastepaper. Now, the official stance of "selling Bitcoin to pay off debt when necessary" means STRC has a concrete safety cushion and is no longer a Ponzi-like gamble.
For the broader BTC market:
The myth of "MicroStrategy has diamond hands and will never sell" is shattered, leaning short-term sentiment bearish. However, the long-term upside is that the company is proactively willing to sell coins to deleverage, completely dismantling the ticking time bomb of a "forced cascade of liquidations" in a deep bear market.
1. No More Diamond Hands:
1.22x mNAV is the Life-or-Death Line and the Long/Short Watershed for Bitcoin
Over the past two years, there has been a lot of FUD (Fear, Uncertainty, Doubt) surrounding MSTR, especially regarding how they manage their leverage and interest expenses. Since Bitcoin is a non-yield-bearing asset, where would MSTR get the cash to pay the hefty interest on its financing? In this Q1 earnings call, management personally declared: they will sell Bitcoin if the premium falls below 1.22x mNAV.
This is equivalent to showing their "hole cards" and revealing their "automated execution program":
Above the Waterline (Capital-Absorbing Expansion Phase): The company is a die-hard BTC bull. As long as retail investors are willing to pay a premium above 1.22x, MicroStrategy can achieve "risk-free arbitrage balance sheet expansion." Issue stock to siphon funds -> aggressively buy BTC -> book assets increase -> drives stock price higher. This positive flywheel will keep spinning.
Below the Waterline (Contraction & Defense Phase): The flywheel slams on the brakes. If MSTR is trading at a steep discount relative to the Bitcoin it holds, issuing more stock would mean selling company assets on the cheap. Management rationally stated that selling BTC for cash at this point to pay dividends, manage debt, or directly repurchase MSTR common stock at low prices maximizes value for existing shareholders.
This means MSTR finally has a hard "valuation floor"—it is no longer a runaway train without brakes.
2. Arbitrage Opportunity: Long MSTR / Short BTC When Dropping Below 1.22 mNAV
What is the biggest fear in arbitrage? Finding an excellent price spread, only for the market to remain irrational for a long time (e.g., MSTR trading at a persistent discount), ultimately bleeding your hedged position dry through funding rates or interest.
But the 1.22x threshold provided by MSTR this time offers a highly certain arbitrage opportunity.
Deep Execution Logic:
Strict Trigger Condition: If and only if MSTR's mNAV drops below 1.22x to a certain extent.
Position Building: At this point, MSTR's price is "overly undervalued" relative to its underlying BTC assets. Traders would go long on MSTR and simultaneously open a short position on an equal market value of BTC.
The Winning Underlying Logic: Even if market participants don't force the spread to converge, MicroStrategy's management will. Once it drops below the threshold, management will initiate their promised self-rescue operation—"selling BTC and buying back undervalued MSTR stock"—to maximize their goal of "Bitcoin per share." Do you see it? Your long/short positioning perfectly aligns with the official market-making direction of MicroStrategy's tens of billions of dollars. You don't need to guess whether BTC will go up or down tomorrow; you just safely pocket the risk-free profit from the "spread convergence."
Market Monitoring Tip: Currently, MSTR's premium is fluctuating around 1.28x and has not triggered the arbitrage condition. Opening a position blindly now would be jumping the gun. However, it has entered a prime sniper radar zone—set your price alerts and strike when it drops below.
3. STRC (Preferred Stock) Safety Cushion Significantly Upgraded
STRC offers a massive dividend yield of 11.5%. In past bearish scripts, MicroStrategy was viewed as a gambler loaded with astronomical leverage. If a black swan event caused Bitcoin to be cut in half or worse, MicroStrategy's cash flow would snap, and preferred stocks like STRC would instantly become worthless.
But the Q1 earnings report completely opened up the company's real books, not only slapping bears in the face but also giving fixed-income investors a massive reassurance pill:
Astonishing Asset Depth: On the liability side, the company has $13.5 billion in preferred stock and $8.2 billion in convertible bonds, but its asset side holds a whopping $64 billion in BTC reserves. The net leverage ratio is a negligible 9%, which is considered an extremely robust balance sheet in traditional finance terms.
Extreme Abyss Stress Test: Even if the crypto market repeats a massive crash and BTC plummets 90% from here (smashing all the way down to $7,300), selling the coins on hand would still be more than enough to clear all net debt.
Cash Moat: Taking a step back, even if Bitcoin liquidity dries up in the short term and they can't sell, the company still has $2.25 billion in pure cash sitting on its books. Just earning demand deposit interest on this money is enough to blindly cover the debt interest and preferred stock dividends for the next 1.5 years ($1.5 billion annually). All things considered, as long as BTC inches up by 2.3% annually, STRC's interest bills will be perfectly covered.
The most core reversal in expectations is: Management has broken the dogmatic belief of "never selling coins." This means that before an extreme crisis hits, they will proactively sell Bitcoin in batches to protect the company's credit rating and ability to pay interest. STRC has completely torn off its "crypto Ponzi high-yield bond" label, and its risk pricing logic has moved closer to traditional high-quality corporate bonds. It is highly likely to see an influx of allocation buying from traditional institutional funds moving forward.
4. Impact on the Broader Bitcoin (BTC) Market: Losing the "Die-Hard Bagholder," Dismantling the "Cascade Liquidation Mine"
The emotional impact of this earnings call on the BTC spot market is two-sided, requiring traders to look at it across different timeframes:
Short-Term Pain (Bearish Sentiment): Retail investors previously treated MicroStrategy as a "black hole" that only absorbs and never sells, capable of always propping up the bottom. Now that management has personally admitted "we will sell coins if the valuation is wrong," this directly shatters the bulls' ideological totem. It's a significant blow to short-term bullish sentiment and speculative hype in the market.
Long-Term Benefit (Structural Base Upgrade): Any trader with a slight understanding of cyclical history knows why the last bear market (2022) crashed so brutally. It was because behemoths like LUNA, Three Arrows Capital, and Celsius all "held on to the bitter end" until liquidity completely dried up and they were forcibly liquidated, causing a stampede of cascading dumps.
The current MicroStrategy is no longer a "fanatic" swept up in the frenzy, but a "Wall Street veteran" who knows how to crunch the numbers. By setting a clear sell warning line, they know how to proactively adjust positions to deleverage in the early stages of a crisis. This is equivalent to prematurely dismantling the biggest "systemic liquidation nuclear bomb" hanging over the crypto market.
Summary :
MicroStrategy remains the ultimate "Commander-in-Chief of BTC Bulls" in the entire US stock market. However, it has evolved from a reckless brute who only knows how to blindly charge forward into a highly calculated actuary who knows when to advance, when to retreat, and even how to reverse-harvest market sentiment. BTC's Bull Signal: MicroStrategy’s Bid Cools, Market Holds FirmTL;DR
Strategy slashed its weekly BTC purchases from $2.54 billion to $255 million without tanking the market.
Global trading and steady ETF flows filled the demand gap, breaking the March sell-off pattern.
This is a strong bull signal for the sustainability of BTC, despite the structural risk of Strategy's 11.50% capital cost.
BTC’s Resilience: Holding the Range as Key Demand Cools
Last week, we noted BTC traded as if one buyer mattered more than the rest. When Strategy bought, BTC found support. When they stepped back in March, price action softened quickly. While the market observed MicroStrategy buy heavily into the April NASDAQ:STRC dividend window, the real question was “What’s happening next?”
We now have the answer to that question from the latest 8-K filing, and it bodes well for the market.
Euro and APAC Sessions Outperform: The Broader Market Steps Up
From the 20 April close to the 28 April close, BTC rose 1.3%, while the Nasdaq 100 rose 1.6%. The point is not that BTC decoupled and outperformed risk assets. BTC did not need another $2.5 billion Strategy purchase to avoid a sell-off.
A supportive ETF backdrop helped fill the gap. US spot BTC ETFs saw net flows of $1.85 billion between 14 April and 27 April. While it lacked daily blowouts, ETFs provided a steady positive bid as Strategy's buying cooled from extreme to moderate.
Global trading sessions also absorbed the sell pressure well. Strategy and ETFs represent primarily US-driven flows. As the US session cooled this week, other regions avoided a broad dump. Asian markets remained positive, and Europe gave back some gains without collapsing. If a concentrated US bid solely held up BTC, a weaker US session would cause much more damage.
A Healthy Correlation with a Cost of Capital Concern
Over the last 5 days, BTC declined by 0.8%, while MSTR fell by 3.1%. This 2.3 percentage point underperformance is consistent with MSTR's established beta to BTC, and there is no clear indication that Strategy aggressively sold MSTR stock to support its BTC holdings.
However, the long-term structural risk associated with Strategy's high cost of capital persists, despite recent positive market developments. The company's variable annualised dividend rate for its NASDAQ:STRC security is currently listed at an expensive 11.50% (as of April 2026), paid in cash monthly.
Strategy is now proposing a shift from monthly to semi-monthly NASDAQ:STRC dividend payments, a move aiming to reduce reinvestment lag, enhance liquidity, smooth out flow cyclicality tied to a single ex-dividend date, and boost price stability.
While a semi-monthly cadence might mitigate the timing of this buying pressure, the fundamental issue of the high cost of capital remains. The structure's viability is still ultimately dependent on a rising BTC price and capital markets willing to fund the mechanism.
The Bull Signal
Nobody gets paid for noticing Strategy bought a lot of BTC in mid-April. What matters is what happened when that buying slowed.
BTC held, ETF flows were adequate, international markets avoided a dump, and MSTR showed no desperate ATM pressure. This is not the ultimate bull signal yet. That requires BTC to hold or grind higher through multiple weeks of reduced Strategy buying. However, the first week was a strong start.
If BTC keeps holding while the NASDAQ:STRC ATM remains quiet, the market must respect the idea that April broke the March pattern. For now, the tape tells us something useful. BTC did not need another huge Strategy purchase to stay supported.
 Long
Long
The Ultimate Bull Signal: Can Bitcoin Rally Without Saylor’s BidBitcoin has spent the past month trading as if one buyer, Strategy, matters more than everyone else. When Strategy is in the market, BTC finds support. Conversely, when Strategy steps back, the tape softens quickly.
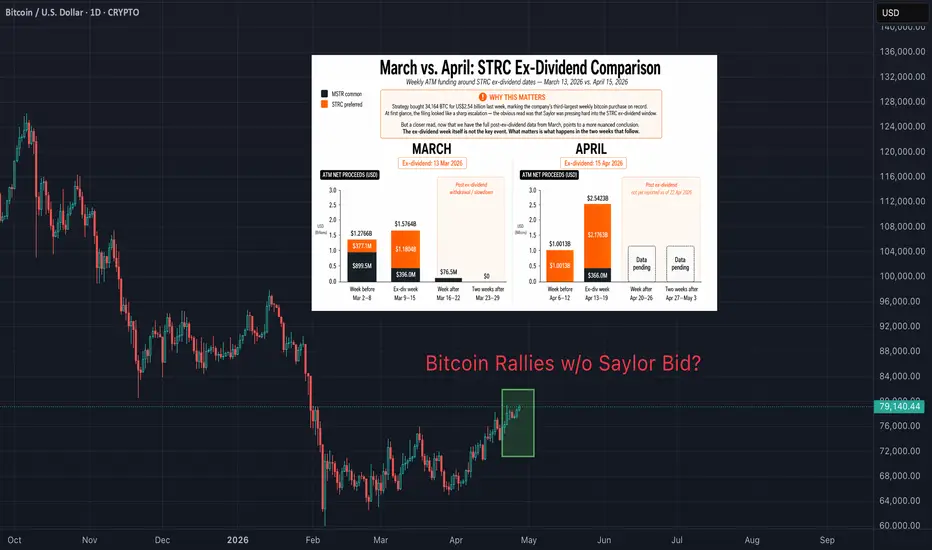
Last week, the company bought 34,164 BTC for $2.54bn, taking its total holdings to 815,061 BTC. Strategy’s Time-Weighted Average Price (TWAP) was real spot demand landing into a market that is still trying to decide whether this move can stand on its own at a critical resistance level near $80k.
In March, post ex-dividend week, Strategy significantly slowed down with its BTC purchasing, simultaneously dragging down BTC’s price. BTC has held its price because Strategy was there, and the next move depends on whether that bid is still there once the ex-dividend window has passed.
March already showed the risk. Strategy bought hard into the window, then backed off, and BTC lost altitude almost immediately. April is the same setup going into the post-ex-dividend weeks. The real question is whether Strategy keeps buying once the dividend window closes.
If April avoids the post-dividend fade we saw in March, the bull case for BTC becomes much stronger. If not, then this was simply a larger version of the same pattern.
TLDR:
Strategy is the largest margin buyer in the market, heavily driving Bitcoin returns in the last month proven by recent US-hours rallies.
The March Pattern: Strategy bought BTC heavily heading into the NASDAQ:STRC ex-dividend window, but BTC prices saw a sharp drop in the following two weeks.
The April Difference: So far, BTC has not suffered the post-dividend fade, holding strong around $77.5k as of 22 April.
The Signal: The upcoming 8-K filing (due 27 April) is crucial in determining whether Strategy actually keeps buying after the ex-dividend window closes.
The Long-Term Risk: Strategy’s 11.5% dividend rate is expensive. If capital markets tighten, they may eventually be forced to sell BTC or dilute stock to fund it.
Bitcoin's Biggest Marginal Buyer: Strategy
In the past month, almost all BTC returns were generated during US trading hours – partially coming from Spot ETFs, but mostly from Strategy’s buy pressure. The cleanest way to read this move is not as a vague “risk-on” rally, but as a concentrated US bid supported by ETF flows. Farside’s daily data show net inflows of about $1bn, highlighting meaningful demand.
However, this still doesn’t fully explain the tape on its own. Strategy’s $2.54bn buy in the week ending 19 April was larger than those ETF net inflows, lending support to the idea that the better read is not that “ETFs were absent,” but that both ETFs and Strategy were buying. Strategy’s bid was large enough to be one of the most important marginal bids in the market, which also fits the session chart. With almost all the returns landing in US hours, and one of the largest US buyers putting $2.54bn to work, Strategy’s relevance to BTC’s price is hard to understate.
The True Rally Test Comes After Ex-Dividend
In March, Strategy heavily bought into the NASDAQ:STRC ex-dividend window, but BTC’s price saw a sharp drop in the two weeks after. In the week ending 22 March, NASDAQ:STRC demand collapsed from $1.18bnto just $76.5m. MSTR’s common ATM activity dropped to zero as well. In the week ending 29 March, combined ATM proceeds fell to zero. Strategy bought no BTC at all for the first time in 13 weeks.
The two-week silence from Strategy accompanied by BTC dropping during the same time, remains the clearest example of why Strategy is instrumental to BTC’s price action. BTC drifted down into the low $70k region, printing roughly $70.4k on 20 March and $70.6k on 23 March. The tape reflected the reality: when STRC stops and MSTR common doesn’t backfill the gap, the bid weakens materially.
As such, the key question now is whether April repeats March’s hangover or breaks the pattern.
The next 8-K, due 27 April, covers the week ending 26 April. If STRC issuance drops again to a rounding error and MSTR common ATM stays near zero, April remains a larger version of March, not a regime change. However, if STRC remains active and MSTR common ATM comes in at a meaningful level — north of $150m — then the script has changed.
BTC Has Not Broken Yet: Why April Matters
15 April 2026 marked the NASDAQ:STRC ex-dividend date for April, with STRC dividends still running at an annualised rate of 11.50%. In the week ending 19 April, Strategy raised $2.5bn and bought 34,164 BTC, acting as an enormous burst of demand. However, the real narrative is what has happened to BTC since then: unlike March, BTC has not seen immediate price drops.
It can be argued that Strategy has changed the market dynamic. However, the upcoming filing matters a lot more than the previous one. If the usual post-dividend fade appears, then April may just be a replay of March price action. If not, then the market has to seriously consider that Strategy is not just buying into the window, but supporting BTC beyond it.
Will the BTC Buying Continue?
This is the part that actually matters for traders.
Nobody gets paid for noticing that Strategy bought a lot of BTC last week. What matters is whether that buying continues once the clean ex-dividend setup is gone.
March tells us that a huge ex-dividend week, by itself, is not enough. Strategy bought 22,337 BTC in the reporting period ending 15 March, then effectively vanishing for the next two weeks. BTC weakened accordingly.
April tells us that the door is still open for a different outcome, because Strategy bought 34,164 BTC, and the BTC tape has not yet followed March lower.
The setup here is straightforward. If the next 8-K shows meaningful post-ex-dividend buying, the market will have to assume the bid is still alive. If it shows another sharp drop in issuance, then March was the operating pattern and not an accident.
Why This Is Bullish Now — But Raises Concerns In The Future
As of April 2026, STRC is running at an annualised dividend rate of 11.50%, which is fine while the market is happy to fund the structure and while BTC is cooperating, but becomes much less comfortable if BTC stalls and the capital markets stop being generous.
While this is a medium-term issue, and not the immediate trading setup, it is still real. The flywheel works best when BTC is rising and investor appetite is strong.
As such, the cleanest framing is: Strategy is bullish for BTC while it is buying, but that does not mean the structure is risk-free. For now, the market only needs to care about the first half of that sentence.
Final Take
BTC has recently traded like a market with one unusually large marginal buyer driving it: Strategy. March was an example of what happens when that single buyer disappears. April’s price action is likely to follow a similar path when Strategy’s NASDAQ:STRC halts capital raise for the first two weeks after ex-dividend.
So the right way to read this market is not to obsess over the last headline purchase number, but to ask a much simpler question: is Strategy still bidding BTC once the obvious window is over? If the answer is yes, BTC likely keeps finding support. If the answer is no, then BTC is about to find out what it looks like without its biggest visible marginal buyer underneath it. Long 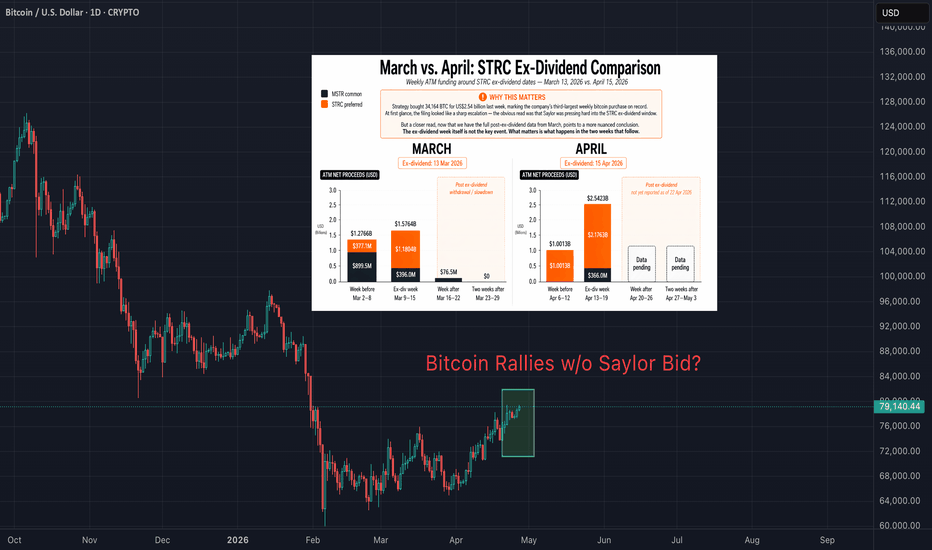
ZEC: The Last 1000x in Crypto?Last year, Zcash went on an undeniable run. Backed by Naval and several prominent industry voices, market FOMO drove the price from the $50 range to a peak near $700, making Zcash one of the very few 10x opportunities in this cycle among major altcoins. Then, pump-and-dump accusations followed. As the broader crypto market contracted, ZEC retraced to the $200 level.
But we believe its continuous protocol development, sustained community engagement, a better user experience, and strong on-chain signals prove this was not a one-time pump. The market consensus might still price Zcash like a zombie coin from 2017 that pumps and dumps each cycle, but it actually stands as the cleanest liquid trade on the unresolved privacy problem in crypto.
This article is for Bitcoin holders who already understand hard money, self-custody, and why monetary debasement matters. If you believe Bitcoin won because it paired digital scarcity with decentralised issuance, Zcash should be on your screen. Zcash keeps the same basic monetary spine – 21 million cap, proof-of-work, and a halving cycle. It adds something Bitcoin never solved. It adds real on-chain confidentiality.
TL;DR
ZEC is showing a second leg. It ripped from $251.72 on 6 April to a $323.39 close on 8 April, a 32.9% seven-day move with a market cap back above $5.2B.
Zcash has a fixed 21 million supply, halves about every four years, and now issues 1.5625 ZEC per block after the November 2024 halving, 3.95% annual inflation rate vs Bitcoin’s 0.82%.
Zcash’s on-chain privacy demand is real and growing. Currently 16.65 million outstanding supply and 5.18 million is shielded by ZEC. This is about 31.1% of the supply sitting inside the shielded side of the ledger.
The user experience on Zcash is materially better and useful with the Zodl wallet, which recently raised $25M from Paradigm and a16z. Its NEAR Intents integrations also make private on-ramps, off-ramps, and cross-chain payments live instead of hypothetical.
The valuation is still tiny versus Bitcoin. Using current market caps, ZEC sits at roughly 0.37% of the market cap of Bitcoin.
What Zcash Actually Is
The cleanest way to think about Zcash is not just as a privacy coin, but rather as Bitcoin-shaped money with shielded settlement. The monetary template is familiar, featuring a fixed 21 million cap, proof-of-work security, and a halving schedule that closely mirrors Bitcoin.
Zcash adds the ability to transact without broadcasting your financial life to the world. The shielded mode keeps transaction details private. Zero-knowledge proofs let the network verify validity without revealing balances or transaction history. This is the core distinction. Bitcoin gives you hard money on a public ledger. Zcash tries to give you hard money without the public balance sheet problem.
Bitcoin transactions are public and anyone can view them. As the asset gets more institutional, more regulated, and more integrated into mainstream finance, that transparency stops looking like a quirky cypherpunk tradeoff.
Why Bitcoin OGs Should Care
The most crypto-native way to describe the ZEC thesis is direct. Bitcoin solved scarcity, but it did not solve confidentiality. That gap did not matter as much when BTC was internet monopoly money traded by early adopters. It matters greatly when investors hold the asset through ETFs, governments watch it, and chain surveillance firms map it. The more successful Bitcoin becomes, the more valuable a hard-cap asset with actual privacy becomes.
In 2025 Naval Ravikant encapsulated the appeal of Zcash: “Bitcoin is insurance against fiat. ZCash is insurance against Bitcoin.” This thesis compresses the whole trade into one sentence. Bitcoin protects against monetary debasement. Zcash is the hedge against the potential government surveillance of Bitcoin.
In a world of expanding financial surveillance, seen wealth is exposed wealth. Bitcoin remains the apex digital reserve asset. However, if the market decides that a store of value should also include confidentiality, ZEC is one of the few liquid names where that rerating can happen fast.
The On-Chain Signal
The best hard data point in this story isn’t a Crypto Twitter thread, but rather the shielded supply. The official Zcash site currently shows 5.18 million ZEC shielded out of 16.65 million outstanding supply. That equates to roughly 31.1%, implying that a meaningful portion of the asset already sits inside the private side of the network rather than merely trading as a public spot ticker on exchanges.
This matters for two reasons. First, it suggests the market is not only speculating on ZEC, but that a portion of the user base is actually opting into the privacy layer. Second, the privacy properties improve as more value lives inside the shielded set. Beyond adoption, the growth of shielded supply is also a product improvement at the network level. A higher amount of shielded float makes the confidentiality story harder to dismiss.
The shielded share of supply is no longer a tiny fraction. The protocol side also improved years ago when NU5 moved Zcash to Halo and removed the need for a trusted setup. That eliminated one of the longest-running technical objections to the asset
User Experience Finally Caught Up - A Better Electronic Cash than Bitcoin
This is where the old Zcash was weak in our view. For years, ZEC had a real tech story but awkward user adoption. Privacy is not enough if the path into the asset is clunky, the wallets are slow, and every ZEC must be bought from a CEX.
That setup changed. In February 2026, the Zcash wallet developed by the core Zcash team rebranded from Zashi to Zodl. More importantly, the surrounding app stack had already become much more usable. By late 2025, Zashi had live decentralised on-ramps via NEAR Intents. This lets users convert assets like USDC, Bitcoin, or Solana into ZEC from inside the wallet flow. It also included live off-ramps that let shielded ZEC swap out to NEAR-supported assets without exposing the shielded history of the user.
The product leap is bigger than simple swap support. CrossPaymade private cross-chain payments live as well. The user pays from shielded ZEC, NEAR Intents handles the routing under the hood, and the recipient gets the chosen asset on the other side. Separately, a 2026 NEAR Intents grant proposal on the Zcash forum described the integration as live in production. It is made easy for users to convert over 130 assets into ZEC while driving Orchard-pool usage. This is the plumbing shift that changes an asset from an ideological niche to usable money.
This does not mean the user experience is perfect. Rather, it means the thesis no longer depends on a future wallet that does not exist. The privacy bid now has a real product surface. This matters greatly for a market that constantly reprices assets when the product finally works.
Why a Market Rerate is Still on the Cards
At current numbers, ZEC is worth about $5.28B against Bitcoin at about $1.418T, putting ZEC at roughly 0.37% of the market cap of Bitcoin. In other words, the market assigns the privacy layer of hard-cap crypto barely more than a negligible fraction next to the base hard-money asset itself.
This is why the setup is interesting, even if you ignore the headline and roll your eyes at a 1000x claim. At the current Bitcoin market cap, ZEC at 5% of BTC value implies roughly $4,258 per ZEC. At 10% of BTC value, it implies roughly $8,516 per ZEC. These are huge moves from current levels, and neither scenario requires Zcash to become the global reserve currency. They only require the market to price privacy as more than a novelty.
A literal 1000x from the current market cap today implies roughly $5.28T. That is enormous. It is not a base case. It is a long-duration extreme upside case that requires a much larger crypto macro environment and a world where confidential digital money gains dominant monetary use. But you do not need a 1000x return for this to be one of the best asymmetries in crypto. If the market ever decides that BTC needs a privacy hedge, 0.37% of the Bitcoin market cap looks exceptionally light.
Why Zcash Is Not Just a Narrative Pump
The usual altcoin playbook is easy to spot. The price runs first, a story gets invented later, and everyone is left holding a meme with no product and no spine. ZEC looks different for three reasons.
First, the monetary design is real. Zcash inherits the Bitcoin-style supply story. It has a 21 million cap, proof-of-work, and a halving schedule. Second, privacy tech is not marketing noise. As a project that might be amongst the most protected from quantum computing attacks, Zcash centres the zero-knowledge design and shielded split as the defining feature of the protocol. Third, the usage story has improved materially since the wallet and cross-chain rails are better now than in prior cycles.
The Zcash community is one of the most decentralised and engaged ones we’ve seen with active developments. It is a constant influx of new devs and die-hard fans who would only use Zcash as a form of payment. The protocol still runs through the ZIP process and community consensus machinery.
There are also DAT buyers putting size behind the thesis. Cypherpunk reported holding 294,743.10 ZEC as of 12 March 2026, at an average purchase price of $335.89. This equals to about 1.78% of circulating supply. You can disagree with the thesis, but Zcash is no longer a retail ghost town.
What Still Has to Go Right
This is not a clean trade. The biggest risk is still adoption. The 31.1% shielded supply is meaningful, but it also means most supply remains unshielded. Optional privacy always diffuses slower than default privacy. The market can stay indifferent for a long time if the user base does not move deeper into the private network.
Regulation is another obvious risk. Even if the design of Zcash allows for transparent and shielded usage, privacy-focused assets face exchange and jurisdiction risk. A strong privacy thesis does not immunise the asset from bad policy. The fact that ZEC still trades on major venues is helpful, but it is not a permanent guarantee. CoinGecko currently lists BitMEX, Binance, Coinbase Exchange, KuCoin, Kraken, and others among the active markets. This is good news for now, but it might not last forever.
The roadmap risk is real too. We love the decentralised development at Zcash but are concerned if the next leg of the technical story can be fully shipped. The Tachyon proposal from Sean Bowe is built around protocol changes centred on oblivious synchronisation and scaling the shielded system, not a completed mainnet outcome. Likewise, Crosslink remains a live design and deployment effort around adding PoS-based finality on top of PoW, not a finished silver bullet. The roadmap is interesting, but should not be priced as guaranteed.
Final Take
The cleanest bull case for ZEC is not as the next meme supercycle toy, but rather the fact that while Bitcoin won the hard-money argument, crypto is yet to fully price the value of confidential settlement. Zcash is one of the few liquid assets where that gap is directly tradable. It has Bitcoin-like monetary DNA, a live privacy layer, meaningfully rising shielded adoption, and better wallet rails than in prior cycles. All of this with a valuation that is still tiny next to BTC.
 Long
Long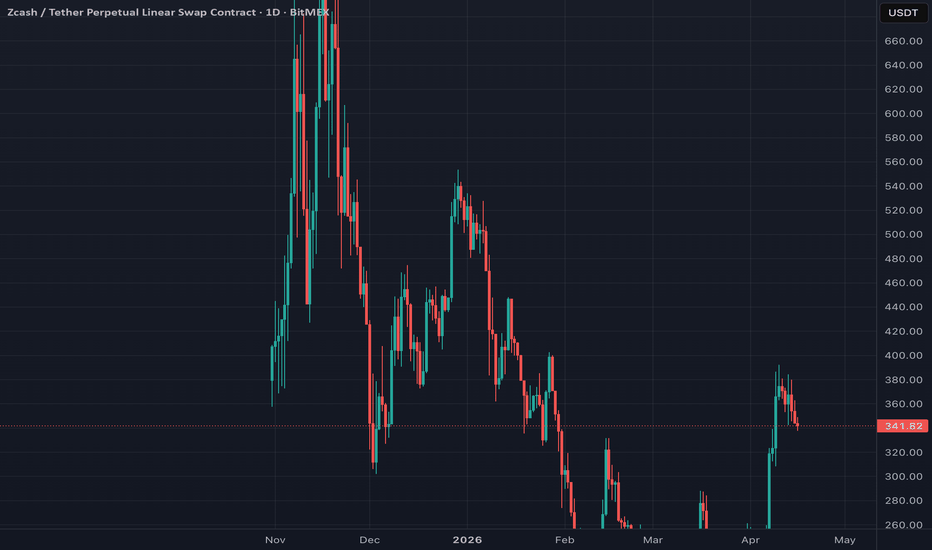
Gold Melts, Tech Falters, Bitcoin Holds: The Case for BTC/QQQLast week, we noted Bitcoin's TradFi bid was losing steam and cautioned against longs as MicroStrategy’s buying spree peaked in the short-term. That prediction played out. Strategy temporarily paused its aggressive Bitcoin accumulation as its most popular preferred shares (STRC) dipped below par after the ex-dividend date, with Bitcoin breaking below $70,000.
Gold has suffered a historic meltdown and failed as a geopolitical hedge. The TradFi bid for Bitcoin has faltered, with harsh reversals back to ETF outflows and broader stock market slumps also being observed.. However, despite these negative factors, Bitcoin is holding up surprisingly well against the rest of the market.
Here’s why we remain cautious on directional longs, but see a unique long-short trade opportunity.
STRC Mechanics and Capital Deployment
Our thesis last week centred on the mechanical pricing of Strategy's Variable Rate Series A Perpetual Stretch Preferred Stock (STRC). The company relies on issuing STRC to fund its Bitcoin purchases without diluting common equity. STRC functions as a high-yield instrument that currently pays an 11.50% annualised dividend, leading to income investors typically bidding it up.
However, 13 March was the ex-dividend date. The stock began trading without the right to the upcoming monthly payout, causing STRC to drop below its $100 par value. The Strategy ATM model requires STRC to trade at or above par to raise capital efficiently. The sub-$100 price forced the company to halt its Bitcoin acquisitions.
The impact was immediate. Between 16 March and 23 March, Strategy purchased just 1,031 BTC. This is a massive deceleration from the 22,337 BTC accumulated the prior week. Monitoring the STRC premium to par serves as a practical metric for observing the near-term purchasing capacity of Strategy. Historical data indicates that dips below the $100 par value correlate with pauses in the company's Bitcoin acquisitions, which occurred again during this recent ex-dividend period.
ETF Outflows Return Amid Equity Market Slump
While the MSTR capital deployment temporarily dried up, the broader trad-fi market also pulled back. Contrary to earlier optimism, US spot Bitcoin ETFs sharply reversed course and returned to a streak of net outflows last week. This withdrawal of liquidity coincided directly with a broader stock market drop, with the S&P 500 falling 1.9%, breaching its 200-day moving average, while the Nasdaq 100 declined by 2.0%.
Daily flow data shows ETFs bled capital for three consecutive days late last week. Outflows hit $163.5 million on 18 March, $90.2 million on 19 March, and $52.0 million on 20 March,invalidating the notion of a sustained inflow streak and highlighting that institutional demand remains vulnerable to macro risk-off events.
Relative Strength: Bitcoin Outperforms Gold and Equities
A dramatic shift occurred this week in traditional safe-haven markets. Despite escalating geopolitical tensions in the Middle East involving Iran, traditional safe haven assets and equities suffered. Gold (XAU) plunged over 15% from its March highs. The metal experienced its worst single-day drop since the 1980s, evaporating roughly $3 trillion in market value. Stubborn inflation and high oil prices triggered a hawkish Federal Reserve stance, causing paper traders to violently flush their gold positions.
Instead of acting as a geopolitical hedge, gold faced severe liquidation. In stark contrast, Bitcoin showed remarkable relative resilience against both precious metals and the stock market. While the Nasdaq 100 and gold flushed lower, Bitcoin maintained its ground and stabilised above $70,000. This divergence suggests that amid the Iran uncertainties, Bitcoin is currently demonstrating superior structural support compared to legacy assets.
Trade Idea: Long Bitcoin, Short NASDAQ 100
The traditional finance bid is currently subdued, and ETF flows have turned negative amid a stumbling stock market. However, a distinct relative value opportunity emerges when observing the resilience of Bitcoin compared to the broader technology sector.
We suggest a pair trade: short QQQ, and long BTC. The rationale for shorting the NASDAQ index is driven by significant structural deterioration and capital rotation away from mega-cap technology stocks.
The tech sector is currently facing severe selling pressure due to AI anxiety and margin concerns. Sky-high market expectations are colliding with sustainability fears. While the NASDAQ faces these fundamental headwinds and weakening technical structures, Bitcoin has maintained its positioning. Until Strategy can consistently issue STRC above par to deploy its new $44.1 billion capital authorisation, longing BTC against a short QQQ position effectively captures the ongoing capital rotation out of traditional tech vulnerabilities and into decentralised assets.
Long 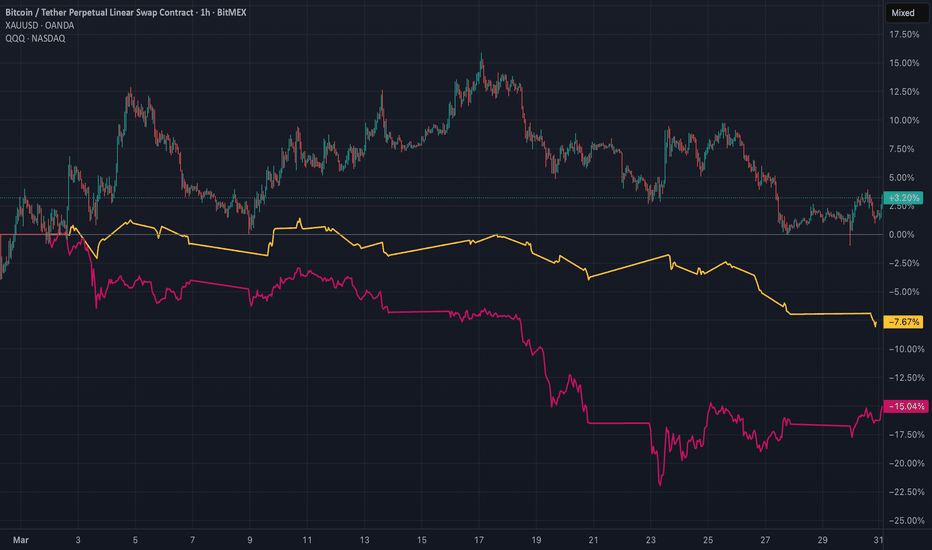
THE TRADFI BID IS BACK: WHY SIDELINING BTC IS -EVFor months, traditional markets watched gold aggressively outpace Bitcoin. That underperformance ended in late February. This shift is not just a narrative - it’s backed by tangible data. Following the outbreak of conflict in Iran, Bitcoin gained 8.09%, while gold sold off by 0.42%. The market is waking up to a measurable convergence of geopolitical necessity, continuous US ETF inflows, and an estimated $130 million to $180 million in background buying driven by the MicroStrategy STRC premium. Pair this institutional bid with the arithmetic reality of the 20 millionth Bitcoin mined, and the math points in one direction. Read on for more details on the data-backed thesis for a long BTC position below.
The Macro Rotation: Bitcoin Resilience over Iran Conflict
The standard safe-haven narrative for gold faces a logistical bottleneck. The Strait of Hormuz conflict threatens shipping routes, which makes the transfer of physical bullion slow, risky, and expensive. This is leading to a rotation from gold to Bitcoin – sophisticated investors recognise the permissionless, borderless portability of crypto.
This divergence has been clear since the conflict escalated. Since 24 February, Bitcoin outperformed with an 8.09% increase, while gold sold off by 0.42%, signalling a reversal. Investors looking for a store of value are taking notice. Physical borders restrict gold, while the frictionless transfer of Bitcoin makes it a superior geopolitical hedge.
US Institutional Bidding Returns: ETFs, MicroStrategy, And The Coinbase Premium
The Coinbase premium and consecutive BTC ETF inflows confirm US buyers are driving this outperformance to hedge against global friction. MicroStrategy’s preferred share, STRC, saw its longest stretch of premiums amid record volumes, highlighting increasing demand amid macro uncertainty.
We saw minor net outflows last week, but the cumulative impact of Bitcoin ETF inflows remains the dominant market force. Between 24 February and 4 March, massive single-day inflows carried the trend. Outflows occurred between 5 March and 6 March, but the inflow trend returned over the last two days.
Increased Volume In MicroStrategy STRC Amplifies BTC Spot Demand
By offering high-yield preferred shares, MicroStrategy pulls capital from conservative TradFi yield-seekers. STRC traded at a premium for the past four trading days. When STRC trades at a premium above $100, MicroStrategy efficiently raises cash via at-the-market offerings and deploys it to buy more Bitcoin.
Over the last two days alone, this STRC demand breakout generated an estimated $130 million to $180 million dedicated strictly to buying Bitcoin. That is roughly 40% of a strong ETF inflow day, functioning entirely in the background. If this premium holds, it acts as a continuous, price-agnostic bid that supports the market.
The Narrative Catalyst: The Last Million Supply Shock
We just crossed an arithmetic threshold. Miners extracted the 20 millionth Bitcoin. Out of the 21 million hard cap, there is officially only one million BTC left to supply to the market.
The halving reduces flow, but this 20 million milestone drives the scarcity narrative. It provides a clear, digestible reason for retail and institutional capital to buy ahead of the remaining supply.
Trade Idea: Risk-Defined Long Setup
The convergence of geopolitical safe-haven flow, returning US spot demand, and the MicroStrategy corporate flywheel makes going long an asymmetric bet.
Entry Zone ($67,000 - $71,000): Scale in on retests of the daily consolidation range near $67,000 for an optimal risk-to-reward ratio. For momentum traders, buying market strength as it breaks the local range works well.
Invalidation / Stop Loss (Below $64,000): A daily candle close below the late February market structure at $64,000. If we lose this level, the immediate bullish setup breaks, and capital preservation takes priority.
Target One ($84,000): The initial take-profit zone aligns with the 0.382 Fibonacci retracement of the broader macro correction. We expect significant friction here, which makes it the ideal level to derisk.
Long 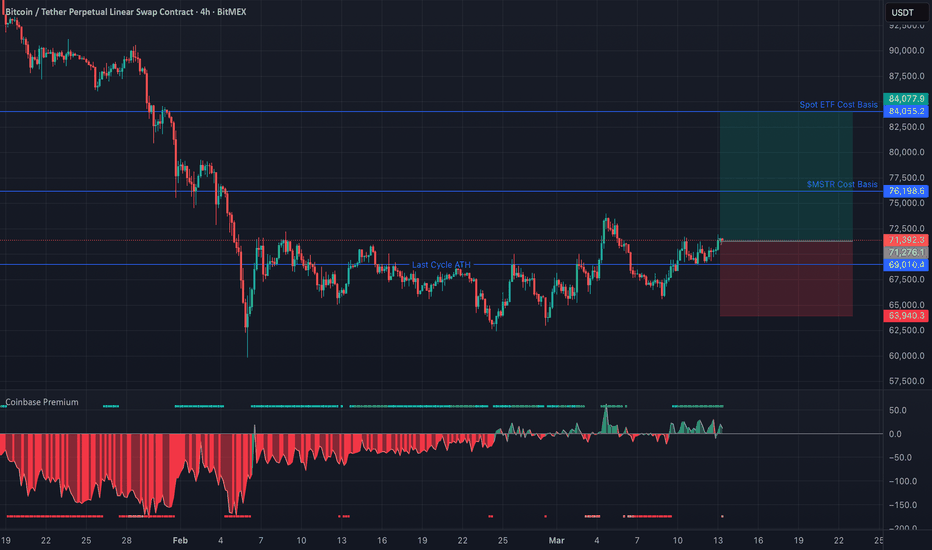
Bitcoin ($BTC): Coinbase Premium Revival Bitcoin is holding the $68,000 area as US-Iran tensions escalate. It is outperforming Gold during this escalation. Bitcoin is returning to the trader’s attention due to its portability, fungibility, and instant global liquidity. Physical Gold struggles to match these traits during rapid evacuations or capital controls. The Coinbase premium turning positive after a prolonged negative streak points to renewed US-based spot demand. This demand is mostly driven by ETFs, evidenced by multi-day inflows, and hints at a slow decoupling from traditional risk-off selling in equities.
Key On-Chain and Flow Signals:
Coinbase premium shift: The Coinbase Premium Index has flipped back above zero, ending a 40-day negative stretch and indicating that the US is currently buying at rates above the global average.
Price action: BTC is trading at around $68,316, up roughly 3.4% over the last 24 hours and about 24% year‑to‑date.
ETF momentum: Spot ETF flows have rebounded to more than $1 billion over the past week. BlackRock’s IBIT leads this with daily inflows above $275 million (Feb 24–26), reversing prior cumulative outflows.
Market health: An MVRV ratio near 1.25 suggests a neutral valuation zone rather than late‑stage euphoria.
Trader’s Takeaway
Bias: Favour BTC over Gold for geopolitical hedging while the Coinbase premium and ETF flows remain net positive.
Trade idea: Long BTCUSDT above the $68,000 structure with an upside focus on a retest and potential break of $70,000. Invalidate below the $64,000 support area.
Gold ($XAUt): The Liquidity Flush and a Potential Rebound Gold recently dropped ~4.5% from its highs above $5,400 down to the $5,160 range. This wasn't a fundamental breakdown of Gold's value, but rather a fear-driven liquidity flush.
In moments of extreme broader-market panic, investors are often forced to sell winning assets to cover margin calls elsewhere. This mechanical dynamic, coupled with short-term US dollar volatility, temporarily overpowered the metal's safe-haven status.
Will the Floor Hold?
Despite the short-term slide, conditions for a sustained Gold rebound remain heavily stacked in its favour. The dip is acting as a shakeout, clearing the way for accumulation based on massive structural pillars:
Relentless central bank accumulation: Emerging markets are continuing their aggressive, long-term de-dollarisation strategies. This creates an immovable floor under the price. Global central banks are stepping in to buy the dips when retail and leveraged traders are flushed out.
The geopolitical premium: With persistent multi-front tensions and the shockwaves of new global trade tariffs, physical Gold remains the primary non-sovereign safe haven.
Institutional demand: The move is largely driven by spot and institutional demand rather than overheated leverage, meaning the underlying foundation of this price tier is solid.
Trader’s Takeaway
Bias: The recent surge to $5,400 was fundamentally justified, and the subsequent flush offers a high-conviction discount. The macro environment of heavy global debt, trade uncertainty, and kinetic conflict strongly favours a continuation of Gold's upward trajectory.
Trade idea: Treat the current $5,160–$5,200 zone as a prime accumulation area. Buy dips with tight risk parameters. Structural demand remains intact, and as the initial market panic subsides, the runway back to $5,300 will clear rapidly.
$CRCL: Market Leaning Into AI Agent RailsCircle Internet Group (BitMEX: WEEX:CRCLUSDT ) recently surged into the $96–$100 range following a massive Q4 earnings beat, putting its market cap at roughly $23 billion, with investors rapidly repricing the stock.
Instead of viewing Circle purely as a higher-for-longer interest rate proxy, the market is validating its aggressive pivot into AI-enabled payments and tokenisation infrastructure.
The core question remains whether this structural shift toward autonomous, machine-to-machine (M2M) payment rails can successfully offset Circle's historical reliance on reserve interest income.
Core Thesis: The AI and Payments Pivot
Circle is actively evolving from a simple stablecoin issuer into the foundational financial layer for the AI economy.
AI-driven autonomous rails: Circle is positioning USDC as the native currency for AI agents. Because AI cannot easily hold traditional bank accounts, Circle's programmable Web3 wallets and smart contracts allow AI agents to execute autonomous, cross-border M2M transactions.
Growth: Q4 revenue hit ~$770M (+77% YoY) with USDC circulation expanding to ~$75B (+72% YoY). Adjusted EBITDA sits near $167M. While stablecoin scale remains the engine, the network utility is what justifies the tech-like multiples.
Adoption: On-chain USDC volume is nearing $12T (+247% YoY). More importantly, Cross-Chain Transfer Protocol (CCTP) volumes hit ~$41B in Q4 (+3.7x YoY)–showing that automated, multi-chain settlement flows are gaining serious traction.
Risk: Approximately 96% of current revenue is still tied to reserve income and yield. Furthermore, Coinbase’s share of USDC yield (over $900M) caps Circle’s net take. The AI pivot must succeed to diversify revenue before the Fed cuts rates significantly.
Narrative vs. Risk:
The AI multiplier bull case : AI agents executing autonomous transactions on interoperable USDC rails (via CCTP and programmable wallets) create a massive new revenue stream. This deepens Circle’s regulatory moat, transitions them from a balance-sheet business to a high-margin software/infrastructure business, and justifies a premium multiple.
The rate trap bear case: If the AI monetisation narrative stalls, Circle is left exposed. Faster-than-expected rate cuts could compress reserve income, and the high-beta stock could suffer a sharp derating back to its recent $50–$60 lows.
Trader’s Takeaway
Bias: Constructive but cautious at these elevated levels. The AI and payments narrative is powerful and currently driving momentum, but the stock has already priced in a lot of the immediate upside post-earnings.
Trade idea: Wait for a pullback to accumulate. Look for entries around the mid-$80s support level established after the recent gap up. Reassess entirely if macro rate cuts accelerate before the AI payment volume proves it can replace lost interest revenue.
Trading the AI Credit Crunch: Actionable Plays from Arthur HayesTrading the AI Credit Crunch: Actionable Plays from Arthur Hayes
In his latest article, This is Fine, Arthur Hayes sounds the global fiat liquidity fire alarm. The thesis is brutal and straightforward: AI is actively coming for white-collar knowledge workers. As automation displaces up to 20% of these high-earning professionals, a massive wave of consumer credit and mortgage defaults will wash over the US banking sector.
Regional banks will be crushed, credit will freeze, and a deflationary shock will hit the markets. However, the US government cannot and will not let the banking system fail. The resulting deflationary pain will force an unprecedented wave of central bank money printing, eventually sending hard assets into the stratosphere.
For traders, this creates a violently volatile macroeconomic environment. Want to know how to survive the liquidity crunch and profit from the inevitable Federal Reserve pivot? Read on.
The Setup: Trading the AI-Driven Credit Crunch
Before the Federal Reserve capitulates and floods the market with liquidity, the initial shock of tightening credit will drag risk assets down. Traditional markets are currently blinded by the AI hype, completely ignoring the underlying liquidity drain.
The Signals: The Observability Gap & Liquidity Math
The BTC vs. Nasdaq Divergence:
We are actively witnessing a severe decoupling. The Nasdaq continues to ride the AI wave, while BITMEX:BTCUSDT underperforms and struggles to hold support as liquidity drains out. Bitcoin has no stock buybacks or an "AI halo effect"—it is the purest gauge of fiat liquidity. A signal that fiat liquidity is actively shrinking in the background.
Net US Dollar Liquidity (RRP + TGA):
Track the Fed's Reverse Repo Facility (RRP) and the Treasury General Account (TGA). When the RRP is flatlining near zero, it loses its ability to act as a shock absorber. At this point, US Treasury debt issuance directly drains liquidity from risk assets.
The Trade: The Gold and Bitcoin Divergence Play
When the signals above flash red, protect your portfolio and profit from the immediate liquidity drain. Execute a relative value trade by going long on gold and short on Bitcoin. Gold serves as your macroeconomic safe haven as traditional finance wakes up to banking stress. Bitcoin takes the brunt of the deflationary hit. As such, shorting BITMEX:BTCUSDT.P and longing BITMEX:XAUTUSDT.P is how you can leverage relief bounces while also keeping capital free.
The Inflection Point: The Money Printer Pivot
The core of the thesis is that the AI-driven credit crunch pain will force the Federal Reserve to act. When the fiat floodgates open to save the banking sector, scarce assets like Bitcoin will hyper-monetise. The goal is to survive the current setup with enough capital to aggressively buy the bottom.
Monitor the SPDR S&P Regional Banking ETF ( AMEX:KRE ). The credit destruction event will start at the local level. You are waiting for this index to plummet and dominate mainstream news with panic about bank runs.
A catastrophic drop in the AMEX:KRE is your leading indicator. The exact moment the Federal Reserve or Treasury announces an emergency liquidity facility, the fiat alarm stops ringing.
The Trade: The Macro Reversal Long
The Strategy: Close your active BTC shorts immediately. Maintain your Gold bags if desired, but flip your primary bias to go heavily long on BITMEX:BTCUSDT.P perps.
Execution: Use BitMEX's limit orders to catch the capitulation "scam wicks" in the $50,000 - $60,000 range that almost always precede massive macro reversals.
Target: $100,000+ as fiat liquidity mathematically forces digital hard assets upward.
The Aftermath: The High-Beta Altcoin Rotation
While Bitcoin acts as the base layer of the liquidity trade, fresh capital will eventually flow downstream into high-beta narratives. Arthur Hayes specifically highlights assets like Hyperliquid and Zcash as tokens that his fund, Maelstrom, plans to bid aggressively.
The Signal: BTC Bottom Confirmation
Do not front-run this trade. Altcoins will bleed heavily against BTC during the current deflationary credit crunch. You only trigger this rotation after Bitcoin has confirmed its local bottom, the KRE index has stabilized, and the Fed’s dovish pivot is officially priced into the market.
The Trade: Arthur’s Favourite Altcoins
The Strategy: Long BITMEX:HYPEUSDT.P and BITMEX:ZECUSDT.P perpetual contracts.
Execution: Keep leverage strictly low (2x - 3x). The natural, explosive volatility of these altcoins during a macro liquidity injection will do the heavy lifting for your PnL. High leverage here is a recipe for getting wicked out before the main move.
Timing the Pivot
Capital preservation during the initial downturn is your greatest edge. Keep your liquidation prices wide on your shorts, hold heavy cash reserves to deploy at the moment of maximum panic, and let the macro signals dictate your bias rather than emotion.
When the regional banking crisis forces the Federal Reserve to supply liquidity, you need to be positioned to catch the flood. Don’t just read the thesis. Trade the macro shifts.
 Short
Short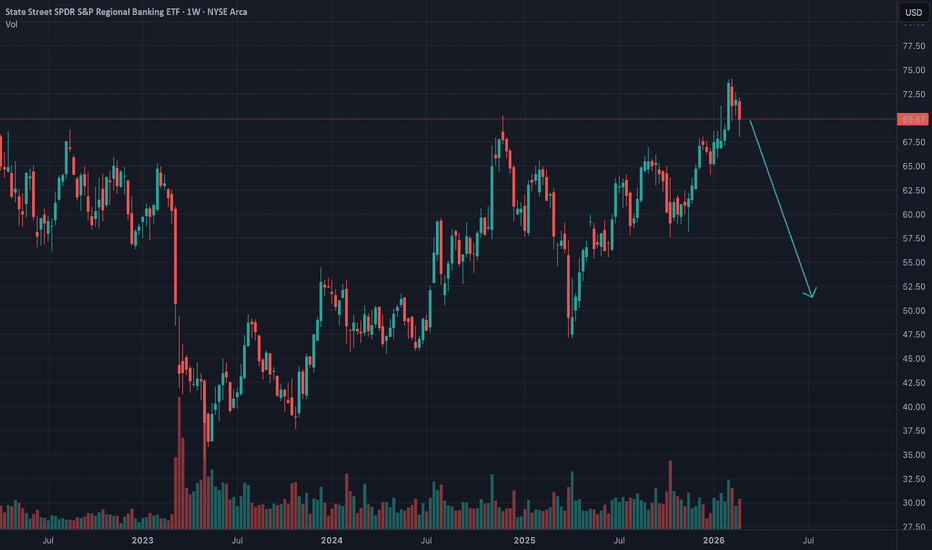
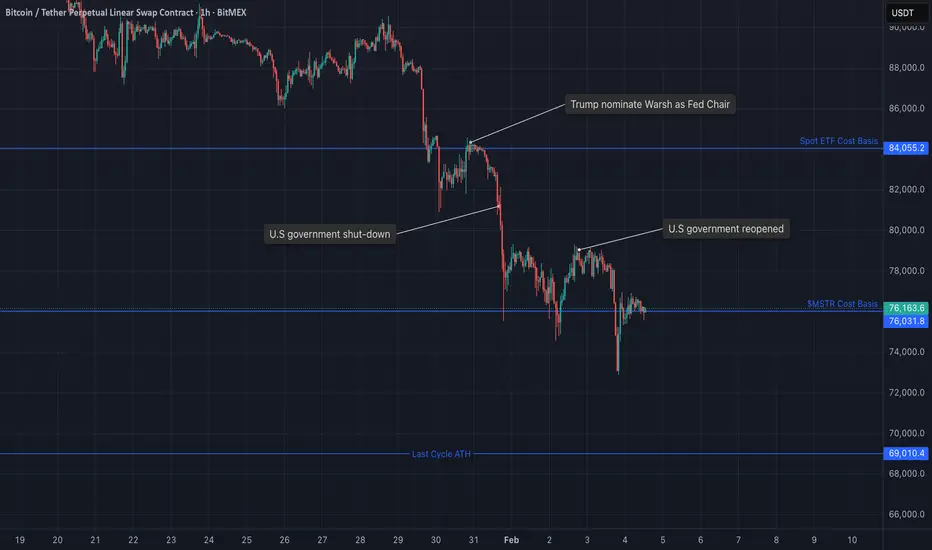
The Bitcoin Breakdown: Critical Levels to WatchBITMEX:BTCUSDT.P has suffered a 15% contraction week-over-week. We have pierced critical levels, including Michael Saylor’s MSTR Bitcoin cost basis.
While headlines focus on the immediate triggers such as Kevin Warsh’s nomination as Federal Reserve Chair, the structural rot that caused this crash began months ago.
If you are looking at the charts wondering why the floor fell out or where the new supports are, here is the breakdown of the hidden ‘10 Oct Pivot’ and the three specific price levels that now define the market structure.
The Fundamental Drivers Behind the Bitcoin Drop:
The sell-off wasn't just a reaction to news, but rather a collapse of a market structure that has been fragile for months.
1. The 10 Oct Pivot’: Liquidation Cascade & Market Maker Wipeout
To understand why Bitcoin capitulated to $74,500 this weekend, you must look back to 10 October 2025. This date marks the moment the correlation between risk assets broke. Gold went parabolic while Bitcoin began a slow, confused bleed. Crucially, this period triggered a massive liquidation cascade that bankrupted many key market makers. As these liquidity providers were wiped out, order book depth evaporated. This left Bitcoin structurally weak, hollow, and propped up only by fragile ETF inflows and leverage. When the macro environment shifted this week, the buffer usually provided by market makers did not exist to absorb the selling.
2. The Kevin Warsh Nomination
On 30 January, President Trump nominated Kevin Warsh as Federal Reserve Chair. Warsh represents a hawkish regime shift focused on balance sheet reduction. This signaled to the market that the Federal Reserve would no longer support the ‘debasement trade’ that had propelled asset prices higher, causing an immediate repricing of risk.
3. The Liquidity Fear From Government Shutdown
The final blow was the US government shutdown. With government operations halted, the market was gripped by a fear that the flow of new liquidity into the economy would completely stop.
Combined with Warsh’s nomination, the government shutdown created a worst-case scenario: a government that cannot spend and a central bank that refuses to print. This ‘fear of no new liquidity’ caused capital to freeze. Investors fled to cash. Without new money entering the system to support prices, the hollowed-out crypto market collapsed.
The 3 Critical Levels for BTC
Now that the leverage has been flushed (with over $2.5 billion in liquidations in a single weekend), we are left with a scarred chart. If you look at the price action specifically, the market is currently trapped between three distinct psychological zones.
The Saylor Line (Current Support: ~$76,000) The first and most immediate battleground is roughly $76,031. This is the estimated average cost basis of MicroStrategy’s massive Bitcoin treasury.For the first time in this cycle, Michael Saylor’s position is teetering on the edge of being underwater. The market knows this. The weekend wick down to $74,500 was a ‘stop hunt’—predatory traders trying to push the price low enough to trigger panic. But the line held.
As long as Bitcoin trades above this level, the corporate balance sheet narrative remains intact. If we lose this level for a sustained period, the psychological damage to retail investors—who view Saylor as the invincible bull—could be severe.
The Spot ETF Wall (Resistance: ~$84,000) If the Saylor Line is the floor, the ‘ETF Wall’ is the ceiling. The $84,000 to $85,000 range represents the cost basis for the billions of dollars that flowed into the US Spot ETFs over the last quarter.
These investors are not crypto natives. They are asset allocators and retirees. Right now, they are sitting on a loss. Human psychology dictates that when the price rallies back to their entry price, they will sell to ‘get out at breakeven’. This creates a massive wall of supply overhead. Until Bitcoin can decisively reclaim $84,000 and turn those holders back into profit, any rally is likely to be sold into.
2021 All-Time High at $69,000 If the contagion from the metals market continues and the Saylor Line breaks, there is only one level that matters: $69,000. This is the 2021 All-Time High. It is the structural ‘line in the sand’ for the entire multi-year bull market. A retest of this level would be painful. However, historically, retesting a previous cycle high is a generational buying opportunity.
What to Look Out For Next
As of today, the government shutdown has been resolved. However, Bitcoin remains in a precarious position. While traditional ‘safe havens’ are bouncing, crypto is lagging. Here’s what you need to watch:
The ‘Lag’ Signal (Gold vs. Bitcoin) : While Gold and Silver have rallied back strongly following the shutdown resolution, Bitcoin is still stuck in the mud, hovering near $78,000. This divergence is the most critical signal to watch. If metals continue to soar while Bitcoin stagnates, it confirms that the ‘liquidity vacuum’ in crypto is specific to the asset class (market maker failure) rather than just general macro fear. Bitcoin must catch up to the metals rally within the next 48 hours to confirm a bottom.
ETF Outflows vs. Stabilisation With the shutdown fear resolved , do ETF investors buy the dip or sell into the relief? Watch the daily flow data. If we see sustained outflows despite the government reopening, it suggests institutional confidence has been shaken by the Warsh nomination regardless of fiscal spending.
The $76k ‘Double Tap’ The market often tests a low twice . Expect a potential retest of the MicroStrategy cost basis ($76,052). If this level holds on a second test while Gold remains strong, it is a high-conviction buy signal. If it fails, the path to $69,000 opens up immediately.
Three Trades to Watch: 30 January 2026The final week of January has delivered the volatility traders were promised. We are witnessing a historic decoupling in precious metals and a rise in META and TSLA following better than expected earnings reports.
Here is the technical and fundamental alpha you need to capture the momentum.
1. Gold ( CRYPTOCAP:XAUT ): The Unstoppable Breakout
While Bitcoin consolidates, Gold has chosen violence. The asset has shattered multi-year resistance levels to enter true price discovery mode. The "Digital Gold" narrative may be pausing, but the original safe haven is breaking out, driven by renewed central bank accumulation and persistent inflation fears for the 2026 fiscal year.
The Central Bank Put:
The breakout isn't just retail speculation; it is structural. Global central banks, particularly in the East, have accelerated gold accumulation to diversify reserves away from fiat treasuries. This creates a "price floor" that didn't exist in previous cycles. Furthermore, real rates have decoupled from gold prices—historically, high rates crushed gold. In 2026, gold is rallying despite rates, signalling a total loss of faith in sovereign debt sustainability. It is also significantly outperforming Bitcoin (BTC) during its current phase of consolidation, cementing its role as the preferred safe-haven asset for this cycle.
Trader’s Takeaway : Do not short a parabolic breakout in price discovery. Watch for a retest of the breakout level to build long exposure. The trend is your friend until the daily structure breaks.
2. Meta ( NASDAQ:META ): The Efficiency Engine Roars
Meta’s Q4 earnings release on Wednesday silenced the bears. Defying fears of a "Capex Trap", Meta reported better-than-expected revenue growth and demonstrated that its massive AI spend is finally converting to ad-revenue efficiency.
AI Monetisation
The bear case was that Zuckerberg was burning cash on AI with no return. The Q4 report dismantled this. The "Family of Apps" operating income surged, driven by AI-powered ad targeting that has restored conversion rates to pre-IOS14 levels. Crucially, the Reality Labs loss narrowed slightly, showing that the "Year of Efficiency" wasn't a one-off gimmick—it's the new operating standard.
Technical Analysis: The Gap and Go
Pattern : The post-earnings action formed a classic "Runaway Gap." Unlike exhaustion gaps, this occurs midway through a trend, signalling a continuation of the move.
Volume Profile : We saw a massive volume node at the earnings open. This suggests institutions stepped in to defend the price, creating a "line in the sand" for bulls.
Moving Averages : The price has reclaimed the 50-day EMA with conviction. As long as the price stays above the gap fill, the momentum remains bullish.
The Funding Edge : The difference in holding costs is staggering. Analysis of funding rates over the last 32 hours shows that while Hyperliquid’s annualized rate spiked as high as 18%—averaging nearly 8%—BitMEX funding rates remained flat at 0.00%.
3. Tesla ( NASDAQ:TSLA ): The Growth Story Resets
Tesla delivered a surprise earnings beat in Q4 2025, reporting adjusted EPS of $0.50 (vs. ~$0.45 expected), which helped steady the stock despite a 3% year-over-year revenue decline.
Margin Stabilisation
The fear was a race to the bottom on EV pricing. However, Tesla revealed that auto gross margins (ex-credits) have bottomed and are ticking up. This "margin trough" is the signal institutional allocators were waiting for. Additionally, Energy Storage revenue grew triple-digits YoY, finally becoming a material contributor to the bottom line, diversifying the risk away from pure auto sales.
The Funding Rate Arbitrage Opportunity on BitMEX:
The rush into Tesla longs caused financing costs to explode on retail-heavy exchanges. Data from earnings day reveals that Hyperliquid funding rates for TSLA skyrocketed to over 100% APR at peak volatility. In stark contrast, BitMEX funding held firm at 0.00%.