XRP Chart Analysis 21/8/68XRP is currently moving within a sideways channel, awaiting a clear breakout direction. The key support lies at 89 THB, which coincides with the previous swing low and the 100-day EMA. A breakdown below this level would shift the trend into bearish territory.
Trading Strategy:
Consider accumulating near the support zone at 89 THB.
Place a stop-loss if the price falls below 89 THB to prevent further downside risk.
If XRP holds this support, the first resistance target is 108 THB.
A confirmed breakout above 108 THB would mark a bullish reversal, opening the way for a retest of the previous highs.
Fundamental Outlook:
XRP continues to benefit from speculation around potential ETF approvals and the ongoing SEC case. A favorable resolution could act as a major catalyst, supporting a stronger upside move.
Bitazza publications
SOL Chart Analysis 13/8/68SOL has broken above its descending trendline, signaling a potential shift in momentum. If the price can clear the key resistance at 6,600 THB, the broader trend will turn bullish, supported by a Golden Cross as the 50-day EMA crosses above the 200-day EMA. The medium-term target is a retest of the previous high at 10,000 THB.
Trading Strategy:
A buy entry can be considered near the support level at 5,437 THB in case of a pullback.
A stop-loss should be placed at 5,075 THB to limit downside risk.
If SOL retests 6,600 THB and breaks through, it would confirm a strong bullish reversal, opening the way toward the 10,000 THB target.
Fundamentally, SOL is benefiting from anticipation of SOL ETF approvals and increased institutional interest, as publicly listed companies add SOL to their investment portfolios.
XLM Chart Analysis 6/8/68XLM has gained support from its utility in facilitating cross-border payments, aligning with the rising trend of Stablecoin usage. This fundamental backing, combined with a developing bullish divergence on the RSI, suggests potential for a price rebound.
Trading Strategy:
A buy entry can be considered near the support level at 12.50 THB, which coincides with the 50-day EMA.
If the price holds this level and successfully breaks out of the descending channel, the next resistance target is at 15.22 THB.
A stop-loss should be placed if the price falls below the recent low at 11.83 THB.
XLM’s role in cross-border transactions positions it to benefit from increased adoption of Stablecoins, providing strong long-term potential alongside the current technical setup.
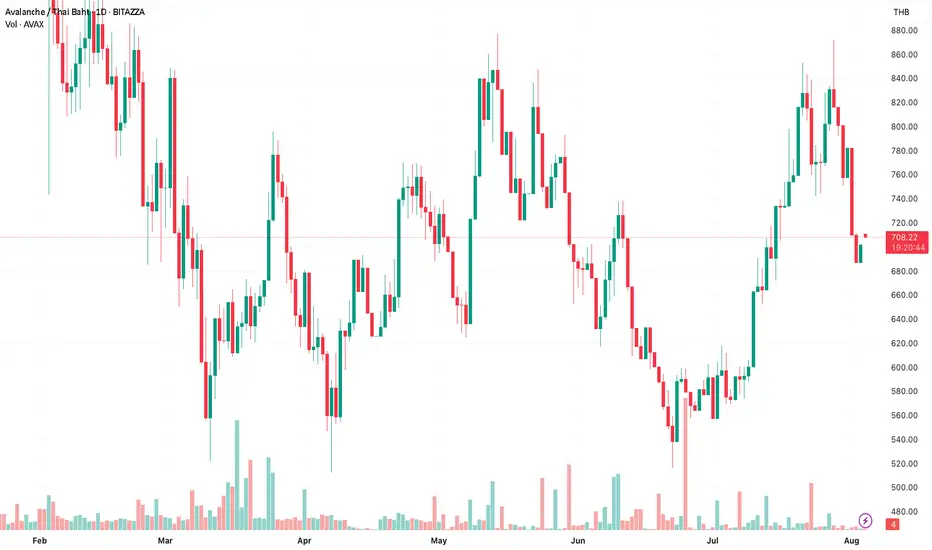
AVAX Chart Analysis 30/7/68AVAX has recently tested a major resistance level at 875 THB but failed to break through, while the RSI has entered the overbought zone. This suggests a possible short-term pullback. However, the price action hints at the potential formation of a bullish Cup and Handle pattern, with support seen near 734 THB.
Trading Strategy:
A buy entry can be considered at the support level of 734 THB, where the handle of the pattern may form.
If the price holds this level, there is potential for a rebound toward the resistance at 875 THB—this level may serve as a short-term profit-taking point.
If AVAX manages to break above 875 THB, it would confirm a bullish reversal and continuation of the uptrend.
A stop-loss should be placed if the price drops below the previous low at 664 THB.
AVAX is a Layer 1 blockchain positioned to benefit from the growing trend in Stablecoins and Real World Assets (RWA), as the Avalanche network offers robust infrastructure for such use cases.
EOS Chart Analysis 27/3/68EOS has experienced a strong upward movement in response to news of its rebranding and shift in business model toward developing blockchain solutions for financial enterprises. The price has successfully broken out of the descending trendline but is currently consolidating without surpassing the key resistance level at 22.0834 THB.
Trading Strategy:
A buy entry can be considered at the support level of 17.8974 THB.
If the price holds this level, there is potential for a rebound toward the resistance at 22.0834 THB, forming a Triple Top pattern—this can serve as a short-term profit-taking point.
A stop-loss should be placed if the price breaks below the previous low at 14.8994 THB.
E
XRP Chart Analysis 20/3/25XRP surged following positive news as the U.S. SEC announced the dismissal of its lawsuit. For a bullish reversal, the price must break through the descending trendline. A short-term profit-taking level is set at 95 THB, with an entry point around 74 THB, and a stop-loss if the price drops below 66 THB.
The RSI rebounded quickly after testing the oversold level. However, if a new high isn’t formed, there is still a risk of another pullback. As long as the price holds above the given support levels, it presents a potential buying opportunity.
TRX Chart Analysis 14/3/2025TRX is currently outperforming the market average, moving within a sideways range. The trading strategy used is Channel Trading, buying and selling based on support and resistance levels. The Bollinger Bands indicator is applied, as it is well-suited for sideways market conditions.
Entry Buy: Around the support level at 7.36767 THB
Stop Loss: If the price drops below 7.11519 THB
Take Profit Target: At the resistance level of 8.47857 THB
If the price breaks above this resistance, the trend may shift from sideways to bullish.
BERA Chart Analysis 6/3/68BERA is moving sideways. The trading strategy in use is Channel Trade, identifying buy opportunities at the support level of 217.873 THB, with a stop-loss set if the price breaks below the previous low at 205.624 THB. The profit target is set at the resistance level, which is the previous high of 300 THB
The trend shows a potential recovery as the RSI begins to form new higher highs. This strategy offers a Risk-Reward Ratio of 1:7.42, indicating a higher potential return compared to the possible loss — making this price level attractive for entry
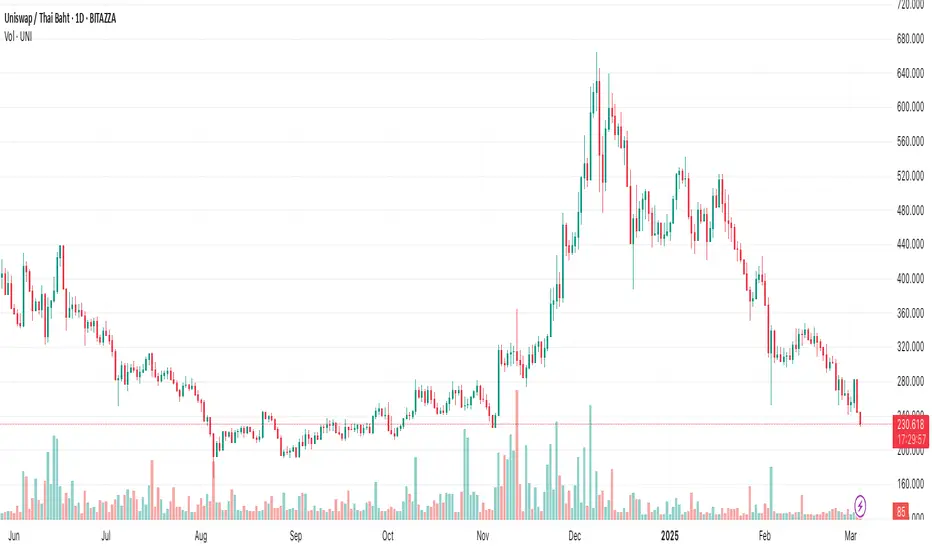
UNI Chart Analysis 27/2/25UNI received positive momentum from reports that the U.S. SEC is preparing to drop its past lawsuit. However, the price has declined in line with overall market conditions. Look for buying opportunities around 251 THB, the previous low. Set a stop-loss at 193 THB and a take-profit target at 348 THB.
If UNI can break through the downtrend line, there is a chance for an upward trend, supported by the RSI entering the oversold zone, signaling a possible short-term rebound. However, the risk of selling pressure remains high — focus on short-term speculative trades for now.