Fed Decision Could Make or Break Real Estate SectorRate Hike Odds Cloud the Outlook for Real Estate
The real estate sector enters mid September under real fundamental pressure, largely tied to shifting expectations for Federal Reserve policy. After holding the federal funds rate steady at 3.50% to 3.75% since a quarter point cut in December 2025, and again voting 9 to 3 to hold at the July 29 meeting, the Fed now faces mounting pressure to raise rates for the first time since 2023. Fed Chair Kevin Warsh struck a hawkish tone at the Jackson Hole symposium on August 28, citing 12 month PCE inflation running at 3.7% and declining to offer forward guidance on the path of rates.
That hawkish backdrop was reinforced by the August Consumer Price Index report released on September 11. Headline CPI rose 3.4% year over year, matching July's pace, while core CPI cooled slightly to 2.4% year over year but accelerated to 0.3% month over month, hotter than the 0.2% consensus estimate. Much of the pressure traces back to energy costs, as the ongoing Iran war, which began with US and Israeli strikes in late February 2026, has repeatedly pushed oil prices higher through renewed rounds of fighting, sending gasoline to an average of $4.28 a gallon nationally. Following the CPI release, market implied odds of a 25 basis point hike at the September 15 to 16 FOMC meeting climbed sharply, with some estimates placing the probability near 90%.
This rate backdrop matters directly for the real estate sector given its historical sensitivity to borrowing costs and Treasury yields. The S&P 500 Real Estate Index fell 2.0% in August to 280.86, with real estate ETP trading volumes rising even as broader sector trading activity cooled, a sign that investors were actively repositioning rather than simply drifting lower. Even so, the sector has still produced double digit percentage gains year to date as of early September, supported by stronger fundamentals in data centers, lodging and resorts, and health care REITs, while the office segment continues to face supply imbalances left over from the pandemic era. This looks less like a broad rotation out of real estate and more like a rate sensitive pullback within an otherwise resilient sector, so the coming Fed decision carries outsized importance for near term direction. Watch the September 16 rate decision and accompanying guidance closely, as either outcome is likely to set the tone for the sector into the fourth quarter.
What has the market done?
The market accepted above 211 (Daily Level 4) into mid March, but buyers failed to bid prices higher for continuation, and the market rotated back into a consolidation range down to 198 (Daily Level 5).
Buyers quickly rejected the lower prices, and the market rallied through 211 to 220 from mid March to mid April.
From mid April to mid July, the market accepted above 211 (Daily Level 4) within a sideways consolidation range between 211 and 223 (Daily Level 2), during which buyers steadily stepped up bids and compressed prices higher.
By late July, the market broke above this consolidation range and reached 227.5 (Daily Level 1), a level carried over from 2024.
Buyers were not able to sustain the move, and prices quickly fell back into the consolidation range between 211 and 223.
Buyers attempted to defend 217.5 (Daily Level 3) but were unable to continue higher, resulting in long liquidation and a rotation back down to the 211 area.
What to Expect in the Coming Weeks
The key level to watch is 211 (Daily Level 4).
Bullish Scenario
If buyers defend and hold 211, expect a move back up toward 217.5 (Daily Level 3), where responsive selling is likely to appear.
If buyers can accept above 217.5, expect continuation toward 223 (Daily Level 2).
If the market can get above 223, expect a move up toward 227.5 (Daily Level 1).
A possible trigger for this scenario is a de-escalation in the Iran war or a pullback in oil prices that eases inflation pressure and reduces the odds of further Fed rate hikes.
Neutral Scenario
If sellers hold down offers at 217.5 on the rotation up, and buyers defend 211 on the rotation down, expect a two way rotation as the market re-establishes value between these levels.
A possible supporting condition for this scenario is a Fed decision that is largely in line with market expectations, leaving positioning largely unchanged and encouraging continued balance between buyers and sellers.
Bearish Scenario
If buyers fail to defend 211, expect a move down to 205 (March low volume node / Mid of consolidation range 1).
If buyers fail to defend 205, expect further downside through consolidation range 1 toward 198 (Daily Level 5).
A possible trigger for this scenario is a Fed rate hike accompanied by hawkish forward guidance, or a further escalation in the Iran war that drives oil prices and Treasury yields higher.
Conclusion
The real estate sector sits at a technically important juncture at 211, a level that has repeatedly separated range bound consolidation from directional moves since March. Fundamentally, the sector's fate over the coming weeks is closely tied to the outcome of the September 16 Fed decision, following an August CPI report that pushed rate hike odds sharply higher on the back of persistent energy driven inflation from the ongoing Iran war. A resilient real estate sector has still managed double digit gains this year despite these headwinds, but its historical sensitivity to rates means the reaction to the Fed's decision and guidance could define whether 211 holds as support or gives way to a deeper correction. With so much macro and technical significance converging around the same week, this is a moment worth paying close attention to.
Disclaimer: Past performance is not necessarily indicative of future results. Trading futures involves substantial risk of loss and is not appropriate for all investors. This content is intended for informational and educational purposes only and does not constitute trading advice or a solicitation to buy or sell any futures contract. Trade your own plan and manage risk.
Acronyms:
C - Composite
w - Weekly
m - Monthly
VA - Value Area
VAH - Value Area High
VAL - Value Area Low
VPOC - Volume Point of Control
LVN - Low Value Node
LVA - Low Value Area
HVN - High Value Node
HVA - High Value Area
SP - Single print
ATH - All time high
Energy Sector Holds Above 1340: What's Next for Prices?Big Oil's Earnings Boom Keeps the Energy Sector in the Lead
The energy sector has been one of the standout performers in the broader market over the past month, and the underlying driver has been an unusually strong earnings season among the companies that make up the sector. Second quarter results showed energy sector earnings growth outpacing all 11 S&P 500 sectors, accelerating to roughly 123% year over year from about 48% as of the end of March, as average crude prices ran about 45% higher year over year during the quarter. That strength was concentrated in a handful of large constituents. Chevron posted its highest quarterly profit on record, with net income near $12.1 billion, up nearly 400% from a year earlier, with management pointing to strong execution even as supply threats expanded beyond the Strait of Hormuz into the Red Sea. ExxonMobil's net income doubled year over year to $14.5 billion, though adjusted earnings per share came in just below consensus after roughly 450,000 barrels per day of production went offline in Qatar, and the company warned that a full quarter closure of the Strait of Hormuz could remove around 750,000 barrels per day of its Middle East output. Shell also reported its second largest quarterly profit on record. Combined, the sector's largest names generated an average of roughly $404 million in daily profit for the quarter, a windfall that has drawn scrutiny from some lawmakers pushing for windfall taxes.
That earnings strength has coincided with clear sector rotation. Energy related equities outperformed the S&P 500 by roughly 5.8 percentage points in a single week in late July and drew accumulation style flows, as capital rotated out of growth heavy, AI linked areas of the market and into value oriented sectors with tangible cash flows. The read through is straightforward. As long as crude prices stay elevated on Middle East supply risk, energy sector earnings are likely to remain a tailwind, but because that strength is concentrated in just a few large names, any disappointment from the majors, or a de-escalation that pulls crude lower, could quickly weigh on the sector's relative performance. The next major earnings catalyst for the sector's largest constituents falls in late October, just beyond the near term window this article covers, so watch supply side and geopolitical headlines as the more immediate driver for now.
What the Market Has Done
From January to the end of March, the market imbalanced upward out of a 980/905 consolidation range, rallying aggressively toward the 1340 area without any meaningful pullback or consolidation along the way. This move coincided with escalating Middle East supply disruptions and tightening OPEC+ output, which combined to support a strong, largely uninterrupted advance.
In late March, the market capitulated, triggering a selloff that pulled prices back down to 1130 (Daily Level 3).
Between late March and July, the market shifted into a broad two way consolidation range, oscillating between 1280 (Daily Level 2) and 1130 (Daily Level 3).
In August, buyers stepped up within that range, bidding prices back up to the 1340 area (Daily Level 1), which also marked the prior swing high established in April.
Most recently, buyers have been attempting to accept and hold prices above the 1340 level.
What to Expect in the Coming Weeks
The key levels to watch are 1340 (Daily Level 1) and 1313 (Aug VPOC).
Bullish Scenario
If the market is able to hold above 1340, or hold 1313 on a dip below that level, expect a move up toward 1400 and possibly toward 1440.
A possible trigger for this scenario is a fresh escalation in Middle East tensions, such as further disruption to the Strait of Hormuz or Red Sea shipping routes, that tightens near term supply and lifts producer earnings expectations further.
Bearish Scenario
If buyers are unable to hold 1313 (Aug VPOC) on a test lower, expect prices to move down toward 1280 (Daily Level 2).
If there is no responsive buying at that level, expect a further pullback down toward the 1135 area (Daily Level 3 / Jul VPOC).
A possible trigger for this scenario is a de-escalation in the Iran conflict that eases supply concerns.
Neutral Scenario
If buyers are unable to sustain a break above 1340, or sellers are unable to sustain a break below the 1280 area (Daily Level 2), expect two way rotation to continue within these levels to establish value higher.
A possible supporting condition for this scenario is a stretch of mixed macro and earnings signals, with OPEC+ holding a fourth quarter pause while the market awaits further clarity on Middle East supply risk and the next round of producer results.
Conclusion
From a technical standpoint, the energy sector's ability to hold above 1340 and 1313 will likely determine whether the recent breakout extends toward 1400 and 1440, or whether the market slips back into a two way range or deeper pullback toward 1280 and 1135. Fundamentally, the sector's strength has been underpinned by an unusually strong earnings season at the major producers, but that strength is concentrated in a small number of names and remains tightly linked to Middle East supply risk, leaving the sector exposed to shifts in the geopolitical backdrop well before the next earnings catalyst arrives in late October. With technicals and fundamentals both at a pivotal juncture, watch how price behaves around these levels in the days ahead, and consider how a change in the Iran conflict or OPEC+ policy might reshape the outlook. What is your take on where this sector heads from here?
Disclaimer: Past performance is not necessarily indicative of future results. Trading futures involves substantial risk of loss and is not appropriate for all investors. This content is intended for informational and educational purposes only and does not constitute trading advice or a solicitation to buy or sell any futures contract. Trade your own plan and manage risk.
Acronyms:
C - Composite
w - Weekly
m - Monthly
VA - Value Area
VAH - Value Area High
VAL - Value Area Low
VPOC - Volume Point of Control
LVN - Low Value Node
LVA - Low Value Area
HVN - High Value Node
HVA - High Value Area
SP - Single print
ATH - All time high
Material Sector Eyes Fresh ATHs as Copper Tariffs Fuel RallyCopper Squeeze and the Reflation Trade Lift the Sector
The material sector has quietly become one of the strongest performing areas of the market in 2026. As of trailing returns through August 27, the sector's benchmark ETF was up roughly 17% to 18% year to date, outpacing the broader S&P 500. That strength accelerated further in the past week, with the sector breaking out of a multi month consolidation between August 21 and August 24, driven by unusually broad participation in copper miners and agricultural input names.
The primary driver has been copper. Comex copper touched a record 6.7270 dollars per pound (about 14,830 dollars per tonne) on August 25, surpassing the prior record of 6.7140 dollars set on August 12, while LME three month copper traded as high as 14,343 dollars per tonne, within striking distance of the all time high of 14,527.50 dollars set on January 29. The rally has been fueled by the looming threat of a US import tariff on refined copper, first proposed at 15% starting January 2027 and rising to 30% in 2028, a decision that Commerce Secretary Howard Lutnick's June 30 deadline has left overdue for more than a month. Traders have responded by hoarding metal in COMEX warehouses, which have seen inventories climb for 46 consecutive days to a record 675,185 tonnes, draining supply available elsewhere in the world. Structural demand from artificial intelligence infrastructure has added to the bid, with a single one gigawatt AI data center estimated to require roughly 50,000 tonnes of copper. More recently, by August 26, rising LME inventories and a narrowing cash premium eased prices back toward the 6.54 to 6.55 dollar area, a reminder that the tariff driven premium remains vulnerable to a policy resolution.
Sector rotation is clearly in play. Materials, alongside Energy, Industrials, and Staples, have led the market this year under a reflation trade narrative that favors sectors with pricing power amid persistent inflation, while Technology and other growth heavy sectors have lagged in recent weeks despite strong earnings. Weekly rotation data through early August also showed materials posting the strongest upside rotation among all eleven S&P 500 sector groups. One caution worth noting is a divergence flagged earlier in the year between the parabolic move in gold and silver and the comparatively muted response in industrial metals and materials equities, a non confirmation some analysts view as worth monitoring even as copper has since posted its own record breaking run.
What the Market Has Done
The market was in an aggressive rally from November 2025 to February 2026, putting in an all time high at 1163.6.
Price then sold off aggressively in March, declining to the 1000 area (Daily Level 2), where buyers stepped in and defended.
Buyers pushed price back up to the 1120 area, which lined up with the February value area low and a low volume node (Feb VAL / LVN).
Since April, the market has rotated between the 1040 area (Daily Level 1) and the 1121 area (Daily Level 2).
Buyers have consistently stepped up bids within this range and were able to probe higher on each retest of the top of the range.
In August, buyers stepped up bids significantly at 1100 area (Daily Minor Level 1).
In the past week, price broke above and accepted above 1120 (CVAH).
What to Expect in the Coming Weeks
Watch the 1120 level (CVAH) closely, as it now serves as the key pivot for the next directional move.
Bullish Scenario
If buyers defend 1120 (CVAH), expect a move up toward 1163 area (ATHs).
If the market is able to accept above 1163 (ATHs), expect a move toward fresh all time highs.
A possible trigger for this scenario is a confirmed US tariff ruling on refined copper imports that locks in steep duties, extending the supply squeeze and reinforcing the reflation trade across the sector.
Bearish Scenario
If buyers fail to defend 1120 (CVAH), expect a move down toward 1100 (Daily Minor Level 1), where buyers are expected to defend.
If buyers fail to hold up at 1100 (Daily Minor Level 1), expect a move down through the range toward 1070 (July VAL).
A possible trigger for this scenario is a resolution of the copper tariff uncertainty that removes the current hoarding premium, or a stronger dollar and cooling inflation data that undercuts the broader reflation trade.
Neutral Scenario
If sellers defend and hold offers at 1163 (ATHs), while buyers hold bids at 1100 (Daily Minor Level 1), expect two way rotation within the August value area, or possibly slightly higher within the February value area, as the market builds value higher.
A possible supporting condition for this scenario is continued mixed macro data, such as easing copper prices alongside still elevated inflation readings, keeping participants indecisive about extending the trend in either direction.
Conclusion
Technically, the material sector has carved out a well defined range between roughly 1040 and 1121 since April, and last week's breakout and acceptance above 1120 (CVAH) puts the burden of proof on buyers to hold this level and clear the way toward the 1163.6 all time high. Fundamentally, that technical strength has been underpinned by a genuine supply squeeze in copper tied to looming US tariffs and structural AI driven demand, layered on top of a broader reflation trade that has kept materials among the market's clearest leaders in 2026. With the tariff decision still pending and inventory dynamics shifting week to week, the coming weeks could bring a decisive resolution to this range. Where do you see the sector heading from here, and are you positioned for a breakout or a fade back into the range?
Disclaimer: Past performance is not necessarily indicative of future results. Trading futures involves substantial risk of loss and is not appropriate for all investors. This content is intended for informational and educational purposes only and does not constitute trading advice or a solicitation to buy or sell any futures contract. Trade your own plan and manage risk.
Acronyms:
C - Composite
w - Weekly
m - Monthly
VA - Value Area
VAH - Value Area High
VAL - Value Area Low
VPOC - Volume Point of Control
LVN - Low Value Node
LVA - Low Value Area
HVN - High Value Node
HVA - High Value Area
SP - Single print
ATH - All time high
Consumer Staples Sector: Rotation Play Tests 868 ResistanceDefensive Money Flows In, But Walmart Rattles Confidence
The Consumer Staples sector heads into the back half of August as one of 2026's standout beneficiaries of a broader rotation away from richly valued technology names, though a soft print from its largest constituent has introduced a note of caution. Walmart, which carries the heaviest single weighting in the sector index, reported Q2 FY2027 results on August 20. Revenue of $187.9 billion came in ahead of estimates and the company raised its full year sales and earnings guidance, but U.S. comparable sales grew just 2.6%, the weakest reading in more than six years and short of the roughly 3.5% growth Wall Street had expected. Management described the operating backdrop as a softer consumer environment than it had anticipated earlier in the year. Because Walmart's results are widely treated as a bellwether for household spending, the modest guidance raise despite the revenue beat has renewed questions over whether the broader defensive trade still has legs, or whether it is now running into genuine demand softness rather than simple rotation flows.
That result followed a mid August producer price report showing July prices flat against expectations for a 0.2% increase, with goods prices actually falling 0.7% while services prices rose 0.2%. Softer input costs offered a tentative margin tailwind for packaged goods companies heading into earnings season, though Walmart's own release suggests the consumer side of the equation, not input costs, is now the bigger swing factor for the group.
Zooming out, the sector's year to date advance of roughly 11% stands in sharp contrast to 2025, when Staples broadly underperformed the S&P 500 as investors chased artificial intelligence driven growth names. The 2026 reversal has been part of a broader rotation into value oriented, real economy sectors such as Industrials and Energy, as capital moved away from Technology amid persistent questions over AI capital expenditure and monetization timelines. That backdrop still generally favors Staples relative to higher beta cyclical and growth sectors, but Walmart's print is a reminder that sector level rotation flows can only carry the group so far if underlying consumer demand data continues to soften. Watch upcoming reports from other large index constituents, along with monthly retail sales and consumer sentiment data, for confirmation of whether the trade down pattern seen at Walmart is isolated or broadening across the group.
What the Market Has Done
The market was broadly sideways for 2025, consolidating without clear directional conviction.
At the start of January 2026, a strong aggressive rally developed from the 795 area (Daily Level 3) toward the 880 area (Daily Level 1), which had also been the all time high made in September 2024. This move coincided with, and was widely attributed to, the early 2026 defensive rotation, as capital exited high valuation Technology names amid AI spending concerns and flowed into Staples for its earnings stability and dividend durability.
The market subsequently broke above the 880 area to print new all time highs at 918.3.
In February, the market attempted to accept above the 880 area but was unable to hold, and price rotated back down into the broader sideways range, down to the 825 area (Daily Level 2).
From May through July, the market auctioned two ways, balancing and building roughly three months of composite value between 868 (CVAH) and 842 (CVAL).
Buyers have also stepped up bids within this sideways range over the past several months, suggesting steady accumulation beneath the value area.
What to Expect in the Coming Weeks
The key level to watch is 868 area (CVAH).
Neutral Scenario
Expect two way rotation within the current composite value area between 868 (CVAH) and 842 (CVAL), with possible extensions beyond the edges before mean reverting back into value.
A possible supporting condition for this scenario is a continuation of mixed macro data, where soft inflation prints offset uneven consumer spending signals, keeping the market range bound without a decisive catalyst.
Bullish Scenario
If buyers are able to bid prices above 868 and defend that level, expect the market to break above 880 (Daily Level 1) and subsequently move toward the 900 level.
Above 900, expect a revisit of the current all time highs at 918.3.
A possible trigger for this scenario is a cooler than expected inflation print or dovish commentary from Federal Reserve officials, which could accelerate rotation into defensive, dividend paying sectors.
Bearish Scenario
If the market is unable to accept above 868 and buyers fail to defend the 850 area, where buyers had most recently stepped in, expect a move back down through the composite value area to the 842 level (CVAL).
If buyers do not defend 842, or fail to reclaim it quickly after a test below, expect a move down to the 825 area (Daily Level 2), where a buying response is expected.
If that response fails to materialize, expect a move down to the 795 area (Daily Level 3).
A possible trigger for this scenario is a disappointing round of consumer facing earnings reinforcing the trade down narrative seen in Walmart's latest print, or a broad market risk on shift that pulls capital back toward Technology.
Conclusion
Technically, the Consumer Staples sector sits at an inflection point, consolidating within a well defined composite value area after a volatile first half of 2026 that carried price from the 795 area (Daily Level 3) all the way to fresh all time highs at 918.3. The 868 (CVAH) level stands as the immediate battleground, and how the market resolves this balance will likely set the tone for the next directional leg. Fundamentally, the sector continues to benefit from a broader defensive rotation out of higher valuation growth names, supported by cooling producer price inflation, but Walmart's soft comparable sales print is a reminder that the rotation narrative alone will not carry the group indefinitely if consumer demand data continues to soften. Watch the interplay between value area acceptance and upcoming macro and earnings catalysts closely. Where do you see this sector heading from here, toward fresh highs or back into deeper value?
Disclaimer: Past performance is not necessarily indicative of future results. Trading futures involves substantial risk of loss and is not appropriate for all investors. This content is intended for informational and educational purposes only and does not constitute trading advice or a solicitation to buy or sell any futures contract. Trade your own plan and manage risk.
Acronyms:
C - Composite
w - Weekly
m - Monthly
VA - Value Area
VAH - Value Area High
VAL - Value Area Low
VPOC - Volume Point of Control
LVN - Low Value Node
LVA - Low Value Area
HVN - High Value Node
HVA - High Value Area
SP - Single print
ATH - All time high
Communication Services Eyes 593 As AI Capex Fears LingerBig Tech Earnings Expose A Widening Divide In Communication Services
Communication services has had an eventful summer. The sector has actually been outperforming the broader market lately, climbing about 1.6% on August 13 alone and beating the S&P 500 by nearly a full point, thanks largely to Netflix surging roughly 5.4% after Bill Ackman's Pershing Square revealed a new stake in the company, while Meta added close to 3% on the same day. Softer than feared inflation data out of the July producer price report helped too, since it kept hopes alive for a Federal Reserve rate pause and gave risk assets a bit of a tailwind.
But that strength on the surface hides a much messier picture underneath, and this is really where sector rotation has been playing out. It started with Alphabet's late July earnings, where cloud revenue jumped an impressive 82%, yet the stock still sold off hard because the company hiked its 2026 capital spending plans to as much as 205 billion dollars and posted negative free cash flow for the first time since going public back in 2004. That single reaction basically set the tone for everyone else reporting that week. Meta followed with an earnings miss and a weaker outlook that hit shares even harder than Alphabet's drop, while Netflix beat on earnings but guided third quarter revenue below expectations, sending its stock lower before the later Ackman fueled rebound turned things around. What emerged from all this is a clear split in how investors are treating the group. Money has been rotating toward names seen as actually cashing in on AI demand, like Microsoft and Amazon, and away from those perceived as spending big without much to show for it yet, which has kept the sector internally divided even while its headline numbers looked healthy.
On top of the earnings drama, Alphabet is still dealing with legal headaches that investors should not lose sight of. Europe's top court upheld a large antitrust fine tied to Android in July, and a separate American case over Google's advertising technology business is still unresolved after a federal court already found the company liable for monopolizing parts of the open web ad market. Going forward, it is worth keeping an eye on how much further hyperscalers plan to spend, where that ad tech case lands, and whether engagement and ad revenue at Meta and Alphabet can eventually justify the money going out the door.
What The Market Has Done
The market was generally in a sideways consolidation range between 630 (Daily level 1) and 593 (Daily level 2), since October 2025 to the start of June this year.
However, sellers seemed to have a slight edge as they stepped down offers, capping each up rotation lower.
From the second week of June, sellers were able to overcome buyers at 593 (Daily level 2) and price broke down to the 555 area (Daily level 3), where buyers responded up.
This breakdown coincided with a broad tech selloff that hit markets in mid to late June, as investors grew increasingly cautious about the rising cost of AI infrastructure spending and rotated out of technology and communication services into more defensive sectors such as staples and healthcare. Communication services stocks were among the day's worst performers on June 23, falling close to 3.8%, with the weakness continuing through the following week as a report suggesting OpenAI could delay its IPO added to the unease around AI related valuations.
Since July, the market has been rotating between 593 and 555, forming consolidation block 1.
Most recently, buyers defended 555 for the second time and the market rotated back up to 593 (Daily level 2).
What To Expect In The Coming Weeks
The key level to watch is 593 area (Daily level 2).
Bullish Scenario
If buyers are able to bid up and reclaim prices back above 593, expect the market to return into consolidation range 1, and to move back up to 630 (Daily level 1).
A possible trigger for this scenario could be a broad AI capex de-escalation narrative, where hyperscalers signal moderating spending growth alongside improving monetization, easing investor concerns.
Bearish Scenario
If sellers are able to hold offers at the 593 area, or if sellers are able to press prices back down below the level after a probe above 593, expect prices to rotate back down towards 555 (Daily level 3).
If buyers do not step up to defend this level, expect a breakout below consolidation block 1, and a move to the 525 area (Daily level 4).
A possible trigger for this scenario could be an adverse antitrust ruling against Alphabet's ad technology business, or a fresh round of capex guidance hikes without corresponding revenue evidence.
Neutral Scenario
If buyers are able to hold up bids after a rotation back down to 555 (Daily level 3), expect a move back to 593, where sellers are expected to respond for subsequent two-way rotation within consolidation block 1 to build more value.
A possible supportive condition for this scenario could be data releases that keep current Fed rate cut expectations intact, leaving investors without a clear catalyst to push decisively in either direction.
Conclusion
Technically, the communication services sector sits at a pivotal juncture near 593, with the outcome of this rotation likely to set the tone for the next multi week move, while fundamentally the group remains split between AI infrastructure winners and companies still working to prove that heavy AI spending translates into durable earnings growth, all against a backdrop of unresolved antitrust risk for its largest constituent. With earnings season largely behind the sector and macro data now taking center stage, how do you see communication services trading as it approaches this key decision level, and which scenario do you find most likely?
Disclaimer: Past performance is not necessarily indicative of future results. Trading futures involves substantial risk of loss and is not appropriate for all investors. This content is intended for informational and educational purposes only and does not constitute trading advice or a solicitation to buy or sell any futures contract. Trade your own plan and manage risk.
Acronyms:
C - Composite
w - Weekly
m - Monthly
VA - Value Area
VAH - Value Area High
VAL - Value Area Low
VPOC - Volume Point of Control
LVN - Low Value Node
LVA - Low Value Area
HVN - High Value Node
HVA - High Value Area
SP - Single print
ATH - All time high
Financial Sector Breaks Out to ATH s as the Fed Holds Rates FirmBanks Reclaim the Spotlight
The financial sector has staged a notable turnaround this summer after lagging much of 2026. Through late July, the Financial Select Sector SPDR Fund was up roughly 4% for the year, but July alone contributed a 6.2% rally, its strongest month since January 2025, and the fund closed at a record high on July 28. The move has been fueled by a stronger than expected second quarter earnings season, with JPMorgan Chase, Goldman Sachs and Morgan Stanley all posting solid results driven by resilient fee income and a pickup in capital markets and trading activity. At the same time, investors have been rotating out of previously high flying artificial intelligence and semiconductor names as concerns over AI capital expenditure sustainability and private credit stress have started to ease, pushing capital back toward more traditionally valued financial names.
The Federal Reserve remains a central factor for the sector. At its July 29 meeting, the Fed held its benchmark rate steady at 3.50% to 3.75% for a fifth consecutive meeting, in a 9 to 3 vote. Three regional presidents dissented in favor of a hike rather than a cut, reflecting a notably hawkish tone under new Fed Chair Kevin Warsh. Elevated inflation, tied partly to higher energy prices, has shifted market pricing toward the possibility of one or two rate hikes later this year rather than further cuts. A hawkish repricing like this could support net interest margins for lenders, but it also raises the risk of tighter financial conditions weighing on loan growth down the line. Keep an eye on lingering geopolitical risk tied to the Middle East, which briefly rattled bank stocks earlier this year and could resurface as a wild card.
What the market has done
The market has been in a downtrend since the start of the year, with the decline bottoming out in April.
Since the April low, the market has trended higher in a block step manner, building value at successively higher ranges.
By the end of July, the market was able to revisit its previous all time high set before the outbreak of the Middle East war, a move that coincided with a broadly stronger earnings backdrop and improving risk appetite for cyclical, rate sensitive names.
Most recently, the market imbalanced up out of July's value area, clearing Auction Block 2, and closed above it, a move that lines up with the sector coming back into favor as the Fed's extended pause and solid bank fundamentals gave buyers the confidence to press the market higher.
What to expect in the coming weeks
The key level to watch is the 705 area (July VAH) and 701.75 (July VPOC).
Bullish Scenario
If buyers are able to step up bids and defend the 705 area, or if there is a deeper probe to 701.75 followed by a quick reclaim back above 705, expect a move up toward 721.70, the current all-time high.
If the market is able to accept above that level, expect a continuation move to make fresh all time highs toward the 730 and 740 areas.
A possible trigger for this scenario would be a softer than expected inflation or labor market data release, or dovish commentary from a Fed speaker, that leads markets to price out the odds of a hike, encouraging continued rotation into rate sensitive financial names.
Neutral Scenario
If buyers are not able to sustain a move above 721.70, the current all time high, but are still willing to defend the 705 area, expect a two way auction to develop between these levels as the market works to establish value at a higher range.
A possible condition supporting this scenario would be mixed economic data that keeps the Fed on hold without offering a clear signal in either direction, leaving traders reluctant to commit to a breakout or a breakdown.
Bearish Scenario
If buyers fail to hold bids at the 705 area, expect the market to return into July's value area, down toward the 692 area, which lines up with July's value area low and Auction Block 2.
If buyers fail to respond at that level, expect a further move down toward the 680 area, aligned with June's value area high, the upper end of Auction Block 1.
A possible trigger for this scenario would be a hotter than expected inflation or economic data release, or hawkish commentary from a Fed speaker, that leads markets to price in higher odds of a rate hike, or a renewed escalation of tensions in the Middle East that sends investors back into risk off positioning.
Conclusion
Putting it together, the financial sector's technical structure remains constructive as long as the 705 to 701.75 zone holds, with a break and acceptance above 721.70 opening the door to fresh all time highs into the 730 and 740 areas. Fundamentally, strong second quarter bank earnings and a rotation of capital away from crowded AI and tech positions have given the sector real support, but a Fed that now sounds more open to hiking than cutting, combined with lingering geopolitical risk, means the path higher may not be a straight line. Where do you see the financial sector heading from here, and are you watching the 705 level as closely as the Fed's next move?
Disclaimer: Past performance is not necessarily indicative of future results. Trading futures involves substantial risk of loss and is not appropriate for all investors. This content is intended for informational and educational purposes only and does not constitute trading advice or a solicitation to buy or sell any futures contract. Trade your own plan and manage risk.
Acronyms:
C - Composite
w - Weekly
m - Monthly
VA - Value Area
VAH - Value Area High
VAL - Value Area Low
VPOC - Volume Point of Control
LVN - Low Value Node
LVA - Low Value Area
HVN - High Value Node
HVA - High Value Area
SP - Single print
ATH - All time high
Industrial Sector Rotation Fuels Highs as Key Support Is TestedFrom AI Darlings to Real World Builders
Sector rotation has been the dominant theme of 2026, and the industrial sector has been one of its biggest beneficiaries. As capital rotated away from richly valued technology names in the second half of the year, investors moved into what many strategists are calling real economy stocks, companies that build, ship, and power the physical world rather than software. The Industrial Select Sector SPDR ETF, which tracks the same names driving this futures contract, was up roughly 14.5 percent year to date as of late July, comfortably outperforming the broader market. This move has been supported by genuinely improving fundamentals rather than pure rotation momentum. The ISM Manufacturing PMI printed 52.7, 54.0, and 53.3 in April, May, and June respectively, while the S&P Global US Manufacturing PMI reached 55.7 in June before easing slightly to a preliminary 53.8 in July. Second quarter industrial production rose 4 percent year over year, with manufacturing output up 4.7 percent, aided by continued investment in AI related data center buildout, which has boosted demand for electrical equipment and power management systems. Offsetting this strength, newly imposed 25 percent tariffs on steel, aluminum, and Brazilian machinery are creating cost pressure across supply chains, and valuations near 22 times forward earnings versus a ten year average closer to 17 times leave less room for disappointment.Watch upcoming earnings commentary closely for signs of order pushouts or margin compression, since any stumble here could quickly unwind sentiment built on the rotation trade.
What has the Market done
The market broke out in mid June from consolidation block 1 to make new all time highs at 1892.
Profit taking followed, and the market rotated down to 1800, the July consolidation range high, where buyers stepped up bids attempting continuation higher.
Sellers stepped down offers around the 1800 to 1850 area, the July value area high, resulting in another deeper rotation down toward the 1785 area, the composite value area high, where buyers responded.
Overall, the market remains in a constructive uptrend structure defined by higher highs and higher lows.
What to Watch in the Weeks Ahead
The key levels to watch remain the 1785 area, the composite value area high, and 1850, the July value area high.
Bullish Scenario
If buyers reclaim and gain acceptance back above 1850, overcoming sellers who stepped down their offers, expect a move back up toward 1892 to 1900, the all time highs.
A push beyond that zone would open the door to fresh all time highs.
A possible trigger would be stronger than expected manufacturing PMI data or a resolution of tariff uncertainty that removes a key overhang on industrial margins.
Bearish Scenario
If sellers step down offers further and buyers cannot rotate back above 1828, the July volume point of control, expect a move down to 1785.
If buyers fail to defend that level, expect a move back into consolidation block 1, down to the 1740 area, the composite value area low, where buyers are expected to respond.
Failure there opens a move toward the 1700 area, the March volume point of control, closing the April 7 to 8 gap.
A possible trigger would be an escalation in tariff disputes or a surprise downside miss in manufacturing PMI that revives fears of a demand slowdown.
Neutral Scenario
If buyers cannot reclaim and hold above 1850, and sellers cannot break and hold below 1785, expect a two way auction between these levels as the market balances.
A possible condition supportive of this would be mixed earnings results across industrial bellwethers combined with a soft nonfarm payrolls or CPI print in early to mid August that keeps rate cut expectations broadly intact without shifting the macro narrative meaningfully in either direction.
Conclusion
Technically, the industrial sector remains constructively bid, holding a pattern of higher highs and higher lows even after profit taking pulled price back toward the 1785 composite value area high. Fundamentally, the sector is benefiting from a genuine rotation out of expensive technology names and into real economy businesses supported by improving PMI readings, resilient industrial production, and structural demand tied to AI infrastructure buildout, though rich valuations and tariff driven cost pressure remain real risks worth monitoring. Where do you see price reacting first, a reclaim of 1850 or a retest of the 1785 support zone? Share your outlook below.
Disclaimer: Past performance is not necessarily indicative of future results. Trading futures involves substantial risk of loss and is not appropriate for all investors. This content is intended for informational and educational purposes only and does not constitute trading advice or a solicitation to buy or sell any futures contract. Trade your own plan and manage risk.
Acronyms:
C - Composite
w - Weekly
m - Monthly
VA - Value Area
VAH - Value Area High
VAL - Value Area Low
VPOC - Volume Point of Control
LVN - Low Value Node
LVA - Low Value Area
HVN - High Value Node
HVA - High Value Area
SP - Single print
ATH - All time high
Health Care Sector Breaks Out as Defensive Rotation Trade BuildsMoney Rotates Into Health Care as Defensive Appeal Returns
Health care has re-entered the market conversation over the past month as investors search for shelter from a choppier, more expensive technology trade. Bloomberg reported in mid July that a compelling case is building for health care to be among the biggest winners of a rotation into defensive sectors, noting that pressures which had weighed on the group, including policy uncertainty, slow earnings growth and a weaker dollar, are fading while artificial intelligence adoption is increasingly viewed as an added tailwind for diagnostics, drug discovery and hospital administration.
The positioning data backs up the narrative. Bank of America's July fund manager survey found that global asset allocators increased their exposure to health care more than any other sector or asset class last month, and State Street Investment Management upgraded the sector from neutral to positive heading into the third quarter after nearly a year on the sidelines. UBS also pointed to the July 1 expansion of Medicare coverage for obesity treatments as a near term demand catalyst, noting that Eli Lilly estimates around 20 million additional patients could now be eligible.
Company specific news has reinforced the sentiment shift. Vertex Pharmaceuticals announced on July 1 that the FDA expanded approval of its gene therapy Casgevy to children as young as two with sickle cell disease or transfusion dependent beta thalassemia, adding roughly 5,500 eligible pediatric patients in the United States. Merck also reported positive late stage trial results for its ulcerative colitis candidate tulisokibart and secured additional approvals for Keytruda in earlier stage cancers. Trade related pressure has eased as well, with pharmaceutical import tariffs reportedly capped near 15% under recent trade arrangements, removing a headwind that hurt the sector last year.
Not every headline has been supportive. Mid July also brought a sharp single day pullback led by hospital and equipment names, with HCA Healthcare and GE HealthCare both falling more than 6% on the same session, a reminder that policy risk around reimbursement rates, drug pricing legislation such as the Inflation Reduction Act and payer cost containment can still hit the tape quickly. Readers should keep an eye on upcoming earnings from major insurers and pharmaceutical companies, along with any fresh commentary on drug pricing policy, since these remain the swing factors that could either extend or stall the current rotation.
What the Market Has Done
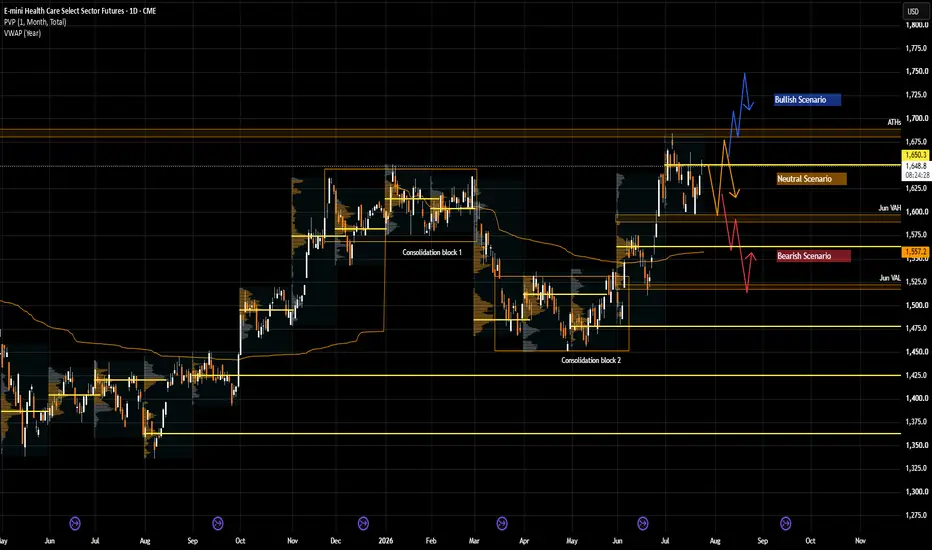
Market broke out from consolidation block 2 in June and has since rallied back to the 1680 area, ATHs.
The rally swept through consolidation block 1 on the way up.
Since reaching the 1680 area, the market has rotated two-way between 1680 and the 1600 area, which lines up with the June VAH..
Price action suggests the market is working to establish value higher within this new range.
What to Expect in the Coming Weeks
The key level to watch remains 1600, the June VAH.
Neutral Scenario
Expect two-way consolidation to continue within the current range between 1600 and 1680, the ATHs, as the market works to build value higher before any further directional resolution.
A likely trigger for this scenario is a quiet stretch of mixed earnings and no major new policy headlines, keeping positioning balanced.
Bullish Scenario
The first clue of a bullish resolution is buyers stepping up bids within the current range and compressing price against 1680, ATHs.
A breakout and acceptance above 1680 would open the door to new ATHs, with century and mid-century targets such as 1700 and 1750 in view.
A possible trigger includes stronger than expected Q2 earnings from major pharmaceutical and insurance names, or further favorable developments around Medicare coverage expansion and GLP-1 demand.
Bearish Scenario
The first clue of a bearish resolution is each rotation higher being capped by sellers stepping down offers and compressing prices back toward 1600.
A breakdown and acceptance below 1600 would suggest a return into the June VA, with a move down to 1563, the June point of control, where buyers are expected to defend. Failure to hold there opens further downside toward 1525, the June VAL.
A possible trigger includes renewed drug pricing legislation risk, disappointing earnings from key sector heavyweights, or a broader flight back into technology and growth names that reverses the current defensive rotation.
Conclusion
Health care sits at an interesting crossroads heading into the back half of the year. Technically, the sector has broken back to ATHs and is now working through a two-way range between 1600 and 1680, a level structure that should offer traders a clear roadmap regardless of which way the next move unfolds. Fundamentally, the sector is enjoying a genuine tailwind from institutional rotation, easing trade tensions, expanding Medicare coverage and a steady stream of regulatory approvals, though drug pricing policy and payer cost pressures remain wildcards that can spark sharp single day moves. With 1600 acting as the pivotal line in the sand, how do you think health care resolves from here, does it grind out new highs or slip back into the June range?
Disclaimer: Past performance is not necessarily indicative of future results. Trading futures involves substantial risk of loss and is not appropriate for all investors. This content is intended for informational and educational purposes only and does not constitute trading advice or a solicitation to buy or sell any futures contract. Trade your own plan and manage risk.
Acronyms:
C - Composite
w - Weekly
m - Monthly
VA - Value Area
VAH - Value Area High
VAL - Value Area Low
VPOC - Volume Point of Control
LVN - Low Value Node
LVA - Low Value Area
HVN - High Value Node
HVA - High Value Area
SP - Single print
ATH - All time high
Utilities Sector The Defensive Trade With A Growth StoryGrid Under Pressure Heat Waves AI Demand And Rate Bets Collide
Sector rotation has been a key theme for the utilities sector in recent weeks. The S&P 500 is trading near record levels, and with risk appetite still strong, investors have generally favored cyclical and growth oriented sectors over defensive ones. Despite this backdrop, utilities have still managed to attract steady inflows. This is because the sector plays two roles at once. It is a classic defensive, rate sensitive trade, and it is also a direct beneficiary of rising AI driven power demand, which gives it a growth angle that other defensive sectors lack. This rotation debate has been reinforced by fundamentals. Q2 earnings season for the sector began the week of July 15, with analysts expecting year over year growth of roughly 13.4%, the fourth highest among the eleven S&P 500 sectors. Meanwhile, record summer heat has strained the grid, with PJM peak load surpassing last year's record by about 2 GW on July 2, and real time power prices spiking to nearly $350 per megawatt hour that week versus a year to date average closer to $64. On the macro side, the Fed is expected to hold rates steady at its July 28 to 29 meeting, with markets leaning toward a possible cut in September, a factor that could accelerate rotation back into the sector if it materializes.
What The Market Has Done
The market has been in a larger sideways consolidation range between 960 (Daily level 1) and 870 (Daily level 3) since October 2025.
It was able to hold above yearly VWAP from the start of the year until the first week of May.
Sellers then took control and offered prices below 918, a level confluent with yearly VWAP.
Prices moved down toward the 870 area (Daily level 3), where buyers responded.
Toward the end of June, buyers regained control of yearly VWAP and reclaimed prices back above it.
Since then, buyers have successfully defended yearly VWAP against sellers, who have stepped their offers down to the 940 area and are pressuring the market lower.
What To Expect In The Coming Weeks
The key level to watch is the 915 to 918 area (Daily level 2, CVAH), which is confluent with yearly VWAP.
Neutral Scenario
Expect continued two way battle within the current July value area, with buyers holding bids near 915 while sellers defend offers around 940.
The possible condition that will support this scenario is a mixed Q2 earnings season combined with a Fed meeting on July 28 to 29 that delivers no new guidance, leaving the market without a clear directional catalyst.
Bullish Scenario
If buyers defend the 915 area and the market breaks and accepts above 940, expect a move up toward the 960 area (Daily level 1, March VAH), where responsive sellers are likely.
If that level fails to hold buyers, a further move toward 972.1 (all time highs) becomes possible.
A potential trigger includes stronger than expected utility earnings paired with dovish Fed commentary or an early signal of a September rate cut, along with continued elevated power demand from AI data centers and grid strain. A broader rotation out of high flying growth and cyclical names and into defensive, income generating sectors could reinforce this move, particularly if risk appetite in the broader market begins to fade.
Bearish Scenario
If buyers fail to hold bids at the 915 area, expect a move down toward the 900 area (June VPOC), where some responsive buying is likely.
If that fails to hold, expect a further move down toward 870 (Daily level 3, CVAL).
A potential trigger includes a hawkish surprise from the Fed, a sharper than expected rise in the 10 year Treasury yield, weak utility earnings guidance, or an escalation in geopolitical tension that pushes oil prices and inflation expectations higher. Continued strong risk appetite and sustained rotation into cyclicals and growth sectors at the expense of defensives could also keep pressure on the utilities sector even if earnings come in solid.
Conclusion
Technically, the utilities sector remains anchored at a pivotal decision point around 915 to 918, where yearly VWAP and recent buyer defense have kept the broader range between 870 and 960 intact. Fundamentally, the sector's dual identity as both a defensive, rate sensitive trade and a growth linked AI power demand story continues to make it a natural destination for rotation flows, even as strong Q2 earnings and elevated grid demand support the longer term case. Traders should watch how price reacts around 915 in the sessions ahead, since a clean break in either direction could define whether rotation into utilities accelerates or stalls. What is your read on this range, is 915 the level that holds, or does this turn into a deeper pullback first?
Disclaimer: Past performance is not necessarily indicative of future results. Trading futures involves substantial risk of loss and is not appropriate for all investors. This content is intended for informational and educational purposes only and does not constitute trading advice or a solicitation to buy or sell any futures contract. Trade your own plan and manage risk.
Acronyms:
C - Composite
w - Weekly
m - Monthly
VA - Value Area
VAH - Value Area High
VAL - Value Area Low
VPOC - Volume Point of Control
LVN - Low Value Node
LVA - Low Value Area
HVN - High Value Node
HVA - High Value Area
SP - Single print
ATH - All time high
Bitcoin at 58,000 Support Buy the Dip or Trapdoor Lower?Bitcoin's Rollercoaster July Fed Whiplash, ETF Outflows and War Drums in the Gulf
Bitcoin has spent the past month whipsawing between fresh macro pressure and short lived relief rallies, and the headlines behind the move matter as much as the chart itself. US listed Bitcoin ETFs suffered their worst month on record in June, with roughly 4.5 billion dollars in net outflows, and most of that selling came from BlackRock's IBIT fund while retail buyers largely stayed on the sidelines and a handful of corporate holders kept accumulating. That outflow pressure coincided with a full weekly close below 60,000 dollars in late June, which also marked Bitcoin's first weekly close below its 200 week moving average since 2023. The macro backdrop turned more decisive when new Federal Reserve Chair Kevin Warsh held rates steady at his first meeting in June and stripped out the rate cuts markets had priced in for the rest of the year, a repricing that dragged Bitcoin down from the low 70,000s toward 60,000.
Sentiment then found brief relief in early July as a softer June jobs report, only 57,000 jobs added against expectations above 100,000, combined with a friendlier tone from Warsh to lift Bitcoin back above 63,000. That relief has since been complicated by a sharp escalation between the United States and Iran, with Iran striking dozens of US linked sites in Bahrain and Kuwait and the US carrying out large-scale retaliatory strikes across Iranian territory, raising fresh concern over the Strait of Hormuz and pulling risk appetite lower across global markets.The July 28 and 29 Federal Reserve meeting remains a key date on the radar, with markets currently pricing roughly 70% odds of another hold, while the ongoing Gulf conflict warrants continued monitoring given its capacity to move oil prices and broader risk sentiment in either direction on short notice.
What the Market Has Done
Market was in a consolidation range between 84,000 (Daily level 1) and 66,000 (Daily level 2) from February to May.
In mid April, buyers were able to bid prices above yearly VWAP and attempted to accept and continue higher.
Sellers defended the 84,000 area (Daily level 1), which resulted in longs giving up and liquidating, causing prices to sell off down to the 66,000 area (Daily level 2).
Market subsequently broke below 66,000 and moved down to the 58,000 area (Daily level 3).
Since then, the market has established value lower and has been in a two-way rotation within June's value area.
What to Expect in the Coming Weeks
The key levels to watch are 63,000 (Daily level 2) and 58,000 (Daily level 3).
Neutral Scenario
Expect continued two-way auction between 63,000 and 58,000 before further directional resolution.
A period without fresh, market moving headlines out of the Gulf conflict or from Federal Reserve officials would likely keep participants balanced on both sides of the range, supporting continued two way rotation between 58,000 and 63,000 until a new catalyst emerges.
Bullish Scenario
If the market is able to reclaim back above 63,000, expect a move up to the 74,300 area, which lines up with the midpoint of the consolidation range and the projected yearly VWAP.
Expect sellers to respond at that level, and if they fail to hold it, expect continuation back up to the 84,000 area (Daily level 1).
A cooler than expected mid July inflation report, renewed ETF inflows, or a de-escalation in the Gulf conflict that eases oil driven inflation fears could act as the trigger for this scenario.
Bearish Scenario
If buyers are not able to defend 58,000 and price breaks down below it, expect a move down to the 51,000 area (Daily level 4).
Expect responsive buyers at that level, and if they fail to hold it, expect further downside toward the 44,000 area (Daily level 5).
A hawkish hold or surprise rate hike from the Federal Reserve on July 28 and 29, continued heavy ETF outflows, or a sharp escalation in the US Iran conflict that closes or threatens the Strait of Hormuz could act as the trigger for this scenario.
Conclusion
Technically, Bitcoin remains locked in a two-way rotation between 58,000 and 63,000, and the reaction at either boundary should set the tone for the next leg, with a reclaim of 63,000 opening the door toward 74,300 and a breakdown of 58,000 exposing 51,000. Fundamentally, the path from here likely hinges on the Federal Reserve's July 28 and 29 decision, the direction of ETF flows after June's record outflows, and whether the US Iran conflict in the Gulf continues to escalate or finds a path toward de-escalation. The technical levels and the macro catalysts should be viewed as connected rather than separate, since a single headline out of the Fed meeting or the Gulf could easily accelerate either scenario. Which scenario do you think plays out first, a reclaim of 63,000 or a breakdown below 58,000?
Disclaimer: Past performance is not necessarily indicative of future results. Trading futures involves substantial risk of loss and is not appropriate for all investors. This content is intended for informational and educational purposes only and does not constitute trading advice or a solicitation to buy or sell any futures contract. Trade your own plan and manage risk.
Acronyms:
C - Composite
w - Weekly
m - Monthly
VA - Value Area
VAH - Value Area High
VAL - Value Area Low
VPOC - Volume Point of Control
LVN - Low Value Node
LVA - Low Value Area
HVN - High Value Node
HVA - High Value Area
SP - Single print
ATH - All time high
Does Wheat Hold 585 or Is Lower Still on the Table?Bumper Harvest Progress Collides With Fading Geopolitical Risk
Wheat futures have spent the past month grinding lower as fresh harvest supply overwhelmed a market that had been pricing in tighter production. Prices slipped to around 570 to 571 cents per bushel in late June, the lowest level since March, as the advancing US winter wheat harvest reinforced expectations of ample near term supplies. Hard red winter wheat was reported 49% harvested versus just 11% a year earlier and a five year average of 19%, while soft red winter wheat reached 45% harvested, also well ahead of its historical pace. This rapid progress has partly offset the bullish acreage story from USDA's June Wheat Outlook, which projected 2026/27 winter wheat production down 27% year over year to 1,030 million bushels, the smallest crop since 1965/66, with hard red winter output pegged at 497 million bushels, the lowest since 1957/58, largely due to persistent drought across the Great Plains.
On the geopolitical side, the US and Iran signed an interim memorandum of understanding in mid June that ended active hostilities, set a 60 day window for reopening the Strait of Hormuz to commercial shipping, and outlined a path toward sanctions relief, while leaving the detailed terms of Iran's nuclear program to be negotiated separately within that window. This eased fertilizer and shipping risk that had been supporting wheat prices. That news also pushed European wheat futures in Paris below the 200 euro mark, their lowest level in weeks. It is worth noting that this arrangement remains an interim framework rather than a final deal, and recent reports point to continued disagreement between Washington and Tehran over its scope, so this is better viewed as a reduction in acute risk rather than a fully resolved situation.
Export demand has been choppy as well, with the week ending June 18 showing sales nearly double the prior year's pace, only for the week ending June 25 to fall to the lowest total of the new marketing year. Slower farmer selling and concerns over European wheat production following a recent heatwave have helped cushion the downside somewhat. Traders should keep an eye on the upcoming USDA Grain Stocks report, continued harvest pace data, and any developments in the ongoing US Iran negotiating window, since these will likely determine whether prices stabilize here or extend the slide.
What did the Market do?
Towards the end of February, the market broke above 588 (daily level 3), imbalancing out of a multi-month consolidation range that had held from September through January 2026.
The market then auctioned two-way, forming an auction block between 635 and 588.
By the end of April, the market broke out above the 635 area (March and April CVAH), then retraced back to the middle of the auction block, where buyers stepped up bids.
That buying pushed price higher into the 700 area (daily level 1, February 2025 VAH), forming a sequence of higher highs and higher lows.
Responsive sellers stepped in at the 700 area, sending prices lower back into the auction block and breaking below 620 (daily level 2), which ended the bullish structure of higher highs and higher lows.
More recently, sellers have stepped their offers down to 620 (daily level 2, June VAH) and price is now testing the 585 area (daily level 3, Jun VAL).
What to Expect in the Coming Weeks?
The key level to watch remains the 585 area (daily level 3, June VAL).
Neutral Scenario
If buyers continue to defend the 585 area and sellers defend 620 (daily level 2, June VAH), expect continued two way auction within June's value area.
A possible trigger for this range bound scenario would be a mixed USDA Grain Stocks report that neither confirms nor challenges current harvest pace assumptions.
Bearish Scenario
If buyers fail to hold 585, expect a move down toward the 560 area, the mid point of the prior consolidation range.
If buyers also fail to defend 560, expect a move down to the 533 area (daily level 4), which also marks the low of the consolidation range.
A possible trigger here would be confirmation of continued rapid harvest progress alongside weak export sales, reinforcing the ample supply narrative.
Bullish Scenario
If buyers break and accept above 620 (daily level 2, June VAH), expect a move up toward the 650 area (May HVN).
A possible trigger here would be renewed weather stress in European or US growing regions, or a setback in the fragile 60 day Hormuz safe passage arrangement under the MOU, since Iran has disputed parts of the deal's scope and the free passage window is temporary rather than permanent.
Conclusion
From a technical standpoint, wheat is sitting at a pivotal decision point at the 585 area, with the broader structure still range-bound between the 533 and 700 levels that have defined trading since last year. From a fundamental standpoint, the market remains caught between a genuinely smaller winter wheat crop, the smallest since the late 1950s and 1960s by USDA's own estimates, and a harvest that is arriving unusually fast, alongside a Middle East backdrop that has de-escalated following the interim US Iran memorandum of understanding, though that arrangement is still only a 60 day framework rather than a resolved situation. Whether 585 turns into a buying opportunity or a trapdoor to lower prices will likely hinge on which of these forces, tightening supply fundamentals or the durability of the harvest and geopolitical calm, wins out in the coming weeks. Where do you see wheat heading from here, and are you positioned for a breakout or a breakdown?
Disclaimer: Past performance is not necessarily indicative of future results. Trading futures involves substantial risk of loss and is not appropriate for all investors. This content is intended for informational and educational purposes only and does not constitute trading advice or a solicitation to buy or sell any futures contract. Trade your own plan and manage risk.
Acronyms:
C - Composite
w - Weekly
m - Monthly
VA - Value Area
VAH - Value Area High
VAL - Value Area Low
VPOC - Volume Point of Control
LVN - Low Value Node
LVA - Low Value Area
HVN - High Value Node
HVA - High Value Area
SP - Single print
ATH - All time high
ES Futures at the 7300 Crossroads: Dip Buy or Trapdoor?Tech Stumbles While the Broader Tape Holds Its Ground
The S&P 500 has spent the past month wrestling with a tug of war between resilient breadth and a wobbly mega cap tech sector. Heading into late June, the Nasdaq Composite suffered a five session losing streak as investors rotated out of technology names and into more defensive corners of the market, even as the S&P 500 and Dow held up comparatively better on a weekly basis. Apple shares tumbled more than 5% after the company implemented its largest hardware price increase in years, while a New York Times report suggested OpenAI may delay its IPO into next year, citing weak aftermarket performance from SpaceX and broader volatility in AI related equities. That report rattled chip and AI infrastructure names, though Micron delivered a strong earnings beat that helped stabilize sentiment in the memory chip space for a session, even as Japanese and South Korean memory makers like Samsung, SK Hynix, and Kioxia sold off sharply on oversupply concerns tied to SK Hynix's planned thirty billion dollar US listing.
On the macro side, the Federal Reserve held its benchmark rate steady at 3.5% to 3.75% at its June meeting, the fourth consecutive hold under new Chair Kevin Warsh. The accompanying dot plot turned notably hawkish, with the median year end rate projection raised to roughly 3.8%, and several officials now pencil in a possible hike as soon as October rather than the cuts markets had hoped for earlier in the year. The Fed also lifted its inflation forecasts, pointing to energy driven price pressures tied to the ongoing conflict in the Middle East. Reinforcing that theme, President Trump said Iran fired attack drones at vessels transiting the Strait of Hormuz, a development that keeps an energy and shipping risk premium alive even after a prior ceasefire. May personal consumption expenditure inflation rose to a three year high, and traders are now watching next week's nonfarm payrolls report after May's surprisingly strong 172,000 job gain. Investors should also keep tariff headlines on their radar, since the current global tariff structure is set to expire in late July with the administration signaling new tariffs may follow.
Context, What the Market Has Done
Since May, the market has accepted higher prices and broken out to new all time highs.
Selling liquidity and responsive sellers were found in the 7600 to 7700 area in June, leading to a rotation back down toward the 7300 area.
The 7300 area lines up with Daily level 3, the April value area high, which is confluent with Auction block 1.
Since that rotation, the market has been engaged in a two-way auction working to re-establish balance.
What to Expect in the Coming Weeks
The key level to watch remains the 7300 area, Daily level 3 and the April value area high.
Neutral Scenario
If buyers defend and hold the zone between 7300 and 7400, Daily level 2, the composite value area low, and sellers defend the 7600 area, expect continued two way consolidation before further directional resolution.
A possible scenario that could reinforce this range bound behavior is a period of mixed economic data, where jobs numbers come in roughly in line with expectations and Fed officials maintain a wait and see tone without fresh hawkish or dovish surprises.
Bearish Scenario
If buyers fail to defend 7300, and sellers cap upside rotations while stepping down offers, expect a move through Auction block 1 toward the 7150 area, Daily level 4, a composite value area high, where sellers are expected to respond.
A break and acceptance below 7300 would be significant, since it sets up a lower low and lower high, the early structural footprint of a possible bearish trend.
A geopolitical escalation, such as a further disruption to shipping through the Strait of Hormuz or a renewed spike in oil prices, alongside a hotter than expected inflation print, could be the catalyst that triggers this scenario.
Bullish Scenario
If buyers defend 7400, Daily level 2, the composite value area low, and step up bids within the current composite value area between 7400 and 7600, that would be a first sign of bullish intent.
A break above 7600, Daily level 1, the composite value area high, would open the path back toward the 7694 area, the prior all time highs, and potentially beyond to fresh highs.
A cooler than expected inflation report combined with a dovish shift in Fed commentary, or a de-escalation in Middle East tensions that eases oil price pressure, could provide the macro spark for this scenario.
Conclusion
From a technical perspective, the 7300 area is the line in the sand for this auction, with the broader structure still range-bound between the April value area high and the prior all time highs near 7694. From a macro lens, a hawkish Fed under Chair Warsh, sticky inflation, unresolved Middle East risk, and looming tariff changes in late July all argue for a market that needs clean catalysts before committing to a direction. Where do you see ES heading first, a defense of 7300 or a breakdown toward 7150? Share your take in the comments.
Disclaimer: Past performance is not necessarily indicative of future results. Trading futures involves substantial risk of loss and is not appropriate for all investors. This content is intended for informational and educational purposes only and does not constitute trading advice or a solicitation to buy or sell any futures contract. Trade your own plan and manage risk.
Acronyms:
C - Composite
w - Weekly
m - Monthly
VA - Value Area
VAH - Value Area High
VAL - Value Area Low
VPOC - Volume Point of Control
LVN - Low Value Node
LVA - Low Value Area
HVN - High Value Node
HVA - High Value Area
SP - Single print
ATH - All time high Lumber at the 620 Crossroads, Breakout Brewing or Bull Trap?Tariffs, Wildfires, and a Tight Supply Story Behind the Rally
Lumber futures have staged a notable rally through June 2026, climbing toward levels not seen since October 2025. Prices pushed above 630 per thousand board feet, a four week gain of roughly 6.3 percent, even as the broader housing market remains soft. This move has been driven primarily by supply side developments rather than a surge in construction demand.
On the trade policy front, the US Commerce Department recently lowered preliminary antidumping duties on Canadian softwood lumber from 20.6 percent to 10.7 percent, while the countervailing duty rate edged down from 14.6 percent to 14.2 percent. Combined, this brings the total rate down to about 25.9 percent from 35.2 percent previously, though these rates are preliminary and are not expected to take effect until August. Importantly, the separate 10 percent Section 232 tariff remains in place, keeping the effective rate on Canadian imports close to 35.9 percent. This means the headline reduction in duties has done little to ease actual import costs in the near term, and traders should watch for the finalization of these rates later in the year as a potential catalyst.
On the supply side, British Columbia has introduced emergency measures aimed at boosting timber availability after wildfires and storm damage disrupted production and threatened output. Combined with prior mill closures across 2024 and 2025 that reduced overall milling capacity, this has kept lumber supply relatively tight even as demand signals from the housing sector stay mixed. Canada still supplies roughly 30 percent of US lumber consumption, so any disruption to Canadian output continues to carry outsized influence on price.
Readers should watch for further updates on the finalized antidumping and countervailing duty rates expected around August, ongoing wildfire season developments in British Columbia, and any changes in US housing starts data or Federal Reserve rate guidance, since lower borrowing costs have historically been supportive of new home construction and lumber demand.
Context, What the Market Has Done
Market has been in a multi-year downtrend, weighed down by the unwinding of pandemic era demand that had peaked in 2020 and 2021 amid record low mortgage rates and a remodeling and homebuying surge, prolonged high mortgage rates from 2022 onward that suppressed housing starts, and periods of oversupply from mills that had ramped up capacity during those earlier boom years.
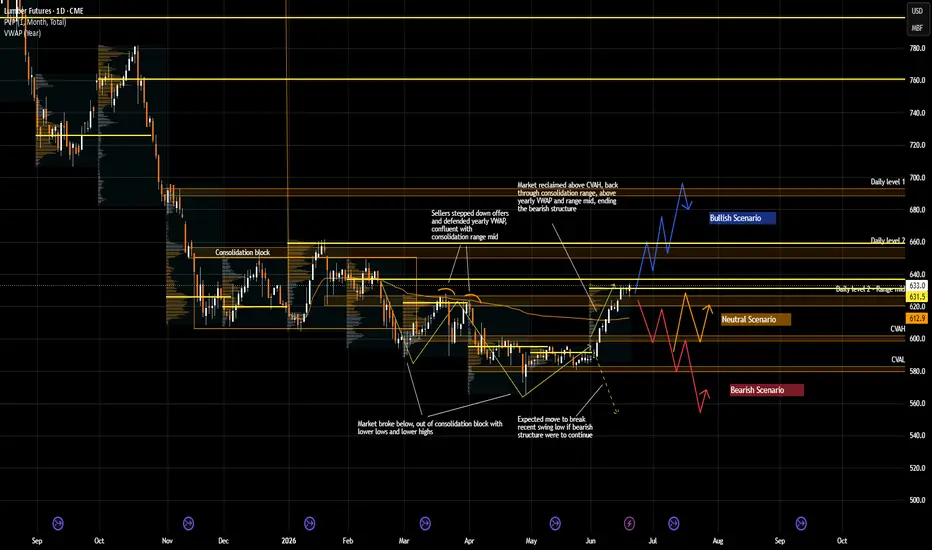
By the end of 2025 and through January and February 2026, the market was sideways in a consolidation block between 650 and 600.
Market probed below the auction block in March but was met with responsive buyers, and price rotated back into the consolidation range.
Sellers subsequently stepped down offers within the range to the 620 area, the mid of the range, which was confluent with the yearly VWAP.
Sellers were able to drive another leg lower subsequently below 600.
Market attempted to accept lower with a probe beneath 580 but was rejected back up.
Recently in June, the market staged a big rally, with buyers bidding prices back above 600 (CVAH), above 612 (yearly VWAP), and now probing above 620 (range mid).
What to Expect in the Coming Weeks
The key level to watch is 620, the daily level 2 and range mid, along with the yearly VWAP.
Neutral Scenario
If buyers defend at 600 (CVAH) while sellers hold down offers at the 620 to 630 area, expect a sideways two way auction before further directional resolution.
A possible trigger for this scenario would be a delay or further postponement in the finalization of the Canadian softwood antidumping and countervailing duty rates, leaving traders without a clear catalyst and keeping the market in a holding pattern.
Bullish Scenario
If buyers are able to defend and accept above 620, expect a move up towards 650, the daily level 2 and consolidation block high, where sellers are likely to be present to defend.
If buyers are able to bid above 650, expect a move up to 690, the daily level 1. This break and acceptance above 650 would be significant, as it would end the multi-year downtrend structure.
A possible trigger for this scenario would be confirmation of tighter Canadian supply due to continued wildfire and storm related disruption in British Columbia, or a dovish shift in Federal Reserve rate guidance that supports housing activity expectations.
Bearish Scenario
If buyers fail to sustain above 620 and the market rotates back below, expect a move down to 600 (CVAH). If buyers do not defend this level, expect a move down to the 580 to 565 area, the CVAL and recent swing low. Below this zone, expect resumption of the broader downtrend.
A possible trigger for this scenario would be a weaker than expected US housing starts report or a finalized tariff outcome that effectively keeps total Canadian duty costs unchanged, removing the recent optimism that has supported the rally.
Conclusion
From a technical standpoint, lumber sits at a pivotal juncture around the 620 level, at the mid of the multi month consolidation range. Acceptance above this zone with a subsequent move through 650 would carry structural significance, potentially marking the end of the multi-year downtrend. From a fundamental standpoint, the recent rally has been fueled largely by supply constraints tied to Canadian wildfire damage and mill closures, while the trade policy backdrop remains a source of uncertainty given that the lower preliminary tariff rates have not yet taken effect and the Section 232 tariff continues to keep effective import costs elevated. Traders should weigh this supply driven strength against still soft housing demand fundamentals before assuming the breakout will hold. Where do you think lumber heads next, breakout above 620 or a fade back into the range? Share your view in the comments below.
Disclaimer: Past performance is not necessarily indicative of future results. Trading futures involves substantial risk of loss and is not appropriate for all investors. This content is intended for informational and educational purposes only and does not constitute trading advice or a solicitation to buy or sell any futures contract. Trade your own plan and manage risk.
Acronyms:
C - Composite
w - Weekly
m - Monthly
VA - Value Area
VAH - Value Area High
VAL - Value Area Low
VPOC - Volume Point of Control
LVN - Low Value Node
LVA - Low Value Area
HVN - High Value Node
HVA - High Value Area
SP - Single print
ATH - All time high
ZN 109 Hold: Temporary Relief or Structural Shift? A Market Caught Between Oil Shocks, Fiscal Anxiety, and a Reluctant Fed
The macro backdrop for ZN futures has been anything but quiet over the past month. The US-Iran conflict, which broke out in late February 2026, has been the dominant driver reshaping rate expectations across the board. The disruption of oil exports through the Strait of Hormuz pushed energy prices sharply higher, contributing directly to US producer prices rising 6.5% year-over-year in May, the highest reading since November 2022 and slightly above consensus estimates of 6.4%. Consumer prices followed the same trajectory, hitting a three-year high. That combination effectively repriced the Fed's path for the rest of the year. What began 2026 as a market pricing two rate cuts has since shifted dramatically, with futures markets at various points assigning as high as a 50% probability of a rate hike by December, before settling back to a more balanced stance as Iran peace talks emerged mid-June. As of June 12, the 10-year yield hovered near 4.47%, pulling back roughly 10 basis points as President Trump signaled a potential peace agreement with Iran could be signed in Europe that weekend, triggering a sharp drop in oil prices and easing inflation concerns.
Layered on top of the geopolitical shock is the persistent fiscal overhang. Moody's downgraded US sovereign credit from Aaa to Aa1 in May 2025, and the budget deficit is now widely expected to widen toward 9% of GDP, adding a meaningful term premium to longer-dated yields. Bank of America flagged in a June 2026 report titled "Foreign UST demand shows cracks" that central banks have been reducing Treasury holdings at the New York Fed by an average of $17 billion per week since late March, with total net reductions approaching $4 billion through the week ending June 11. Foreign appetite for US debt has softened materially, and while recent long-end auctions have been described as "solid," the structural concern about who absorbs ongoing supply remains in the background.
The yield curve itself is signalling a late-cycle environment. As of June 12, the curve is upward-sloping, with the 2-year yield near 4.09% and the 10-year at 4.47%, producing a 2s10s spread of roughly 38 basis points. That steepness is not the healthy, growth-driven variety. Instead, it reflects the long end pricing in inflation persistence and term premium risk while the front end stays anchored near the Fed funds target of 4.25%. Charles Schwab's fixed income mid-year outlook noted that inflation remains sticky and the Fed is likely to stay patient, with the 10-year yield expected to hold in the 4% to 4.5% range, with risks skewed to the upside. Watch the US dollar as well, with DXY near 99.8 after a recent surge toward 10-week highs driven by geopolitical safe-haven flows, the dollar remains a key co-variable to watch alongside oil and bond prices for ZN direction.
What the Market Has Done
Market liquidity checked at the start of March above 113'11'5 (Daily Level 1) and failed, marking the beginning of a sustained trend lower.
From that March high, ZN sold off steadily, driven by the escalating US-Iran conflict, energy-driven inflation re-acceleration, and the repricing of Fed rate cut expectations away from the 2026 consensus.
Price found its way down to 109 (Daily Level 2 / May lower HVA), which represents the daily support zone from April and May 2025 and has acted as a meaningful reference point for buyers.
In the most recent week, the market appears to have found buying liquidity at this zone, with buyers stepping up bids and price stabilizing, consistent with the broader easing in oil prices and the Iran peace deal narrative gaining traction around June 12.
The broader structure, however, remains a downtrend from the March highs, and the onus is on the buyers to demonstrate they can reclaim higher ground with conviction rather than a bounce.
What to Expect in the Coming Weeks
The key levels to watch are 110 (May VPOC) and 109 (Daily Level 2 / May lower HVA). How price behaves around these two references will determine the next directional leg.
Neutral Scenario
Expect two-way rotation within the 110 to 109 range as the market re-establishes value before committing to a directional move.
Price may oscillate between these references across multiple sessions as participants digest the already-hot May CPI print of 4.2% year-over-year and position ahead of the next key inflation catalyst on July 14, when June CPI drops.
This is the chop scenario where neither buyers nor sellers gain a decisive edge, and range-fading strategies become more viable than directional bets.
A stable macro backdrop with no major surprises from inflation or geopolitical developments would support this rotational environment.
Bullish Scenario
If the market is able to break and accept above 110 (May VPOC), expect a move back towards 110'25 (Apr VAL / May VAH).
Reclaiming 110 with acceptance would effectively break the downtrend structure from the March highs, shifting the character of price action from sellers-in-control to a recovering market.
Watch for volume confirmation and follow-through above 110 before treating any initial breach as a genuine structural shift.
A possible macro trigger could be a confirmed Iran peace agreement that sends oil prices sharply lower, meaningfully reducing inflation expectations and reviving rate cut pricing for late 2026, which would be a direct tailwind for bond prices.
Bearish Scenario
If buyers do not defend 109 and prices accept below that level, expect further downside to 108 (Daily Level 3 / Feb 2025 low), representing a resumption of the downtrend from March.
A clean break below 109 with follow-through would confirm that the buying liquidity found this past week was corrective rather than structural, and the path of least resistance remains lower.
This is the scenario where the fiscal overhang, foreign demand erosion, and persistent inflation all reassert themselves simultaneously, offering sellers the macro justification they need.
A possible macro trigger could be a renewed escalation of the Iran conflict, a surprise hot inflation print in June, or an unexpected Fed hawkish pivot that pushes markets to price in a rate hike more firmly, sending yields higher and ZN futures lower.
Conclusion
ZN sits at a genuine decision point. On the technical side, price is parked at a critical support zone (109 / Daily Level 2 / May lower HVA), where buyers have shown up in the past week, yet the overarching trend structure from the March highs at 113'11'5 remains intact and bears watching. The 110 level (May VPOC) is the line in the sand; holding below it means the downtrend is in force, and only a sustained acceptance above it shifts the narrative. On the macro side, the developing Iran peace deal is the near-term wildcard, having already pulled the 10-year yield back to around 4.47% from recent highs. But the structural headwinds of a widening fiscal deficit, foreign demand erosion from central banks, Moody's credit downgrade, and sticky inflation do not disappear with a ceasefire headline. The Fed remains on hold with no clear catalyst to pivot dovish. The market has shown buyers are present at 109, but buyers showing up and buyers being in control are two very different things. Which side of 110 does ZN close in the weeks to come? That answer should tell you everything about whether the dip here is an opportunity or the beginning of a deeper move to 108 and beyond. Drop your view in the comments below.
Disclaimer: Past performance is not necessarily indicative of future results. Trading futures involves substantial risk of loss and is not appropriate for all investors. This content is intended for informational and educational purposes only and does not constitute trading advice or a solicitation to buy or sell any futures contract. Trade your own plan and manage risk.
Acronyms:
C - Composite
w - Weekly
m - Monthly
VA - Value Area
VAH - Value Area High
VAL - Value Area Low
VPOC - Volume Point of Control
LVN - Low Value Node
LVA - Low Value Area
HVN - High Value Node
HVA - High Value Area
SP - Single print
ATH - All time high
Crude at 96: War Premium Exit or Dip Worth Buying? War Premium Unwinds, But the Strait Is Still Shut
The single biggest driver of crude over the past several months has been the US-Israel war on Iran, which began on February 28, 2026, and effectively closed the Strait of Hormuz to commercial traffic. At its peak in early April, Brent crude surged above $140 per barrel, the highest since 2008, as the conflict removed an estimated 12 to 15 million barrels per day from global supply and triggered record inventory drawdowns. The IEA noted that cumulative supply losses from Gulf producers already exceeded 1 billion barrels, with more than 14 million barrels per day shut in. The EIA reported that the US made its single largest-ever weekly drawdown from the Strategic Petroleum Reserve in mid-May, underscoring just how tight the physical market became.
The story in May, however, shifted dramatically toward diplomacy. Reports emerged that the US and Iran had "mostly agreed" to a 60-day memorandum of understanding that would pause hostilities, sending Brent down roughly 19% for the month, its worst monthly performance since the COVID-19 pandemic. By May 29, Brent settled near $92.56. That peace optimism has since proven fragile. Iran subsequently halted ceasefire talks, fresh strikes were reported on Kuwait and Oman in early June, and Iran's Foreign Minister stated there had been "no tangible progress" despite ongoing back-channel messaging via mediators. WTI has since bounced back above $90 on renewed geopolitical risk premium.
On the supply side, OPEC+ approved a largely symbolic 188,000 barrel-per-day production hike for June on May 3, with Saudi Arabia signaling further similar-sized increases are possible. However, these additions are meaningless so long as Gulf producers cannot physically export through Hormuz. The UAE, meanwhile, exited OPEC+ entirely. The IEA reaffirmed a significant 2026 global surplus outlook contingent on Hormuz reopening, a condition that remains unresolved. In correlated markets, the DXY traded near 99 to 100 at end of May, holding near two-month highs on safe-haven demand and higher-for-longer Fed pricing after US headline CPI hit 3.8% in April. Equities are under pressure, with the S&P 500 trading near 7,383 and the Nasdaq off over 4% on the week. A stronger dollar and weakening risk appetite are headwinds for crude demand narratives, even as supply fears keep a floor under prices.
What the Market Has Done
Since April, the market has been compressing with higher lows and lower highs, forming a textbook symmetrical contraction as the market digested the initial war shock and the subsequent peace-deal-driven sell-off.
In May, price stabilized into a sideways range between 105 (daily level 1) and 86 (daily level 2), with participants on both sides unwilling to commit directionally amid the ceasefire noise.
May closed with a double distribution profile on the volume profile, reflecting two distinct areas of accepted value and signaling the market is in a balancing phase rather than a trending one.
Recently in the last week, sellers have stepped down to the 96 area, which aligns with May's Low Value Area (LVA) and VPOC, suggesting the short side has found an area of interest and is probing for acceptance below the upper distribution.
What to Expect in the Coming Weeks
Key levels to watch are 86 (daily level 2) and the 96 area (May LVA / VPOC).
Neutral Scenario.
If buyers continue defending 86 while sellers maintain offers around 96, expect a two way balanced auction as the market continues establishing value before its next directional resolution.
A possible trigger could be a continued diplomatic stalemate on the Hormuz deal, where neither a full ceasefire nor a re-escalation materializes, leaving markets in a geopolitical holding pattern.
Bearish Scenario
If buyers fail to defend 86, expect acceptance below Daily Level 2 and a move toward 77, which represents Daily Level 3.
Acceptance below 86 would suggest that buyers are no longer willing to defend the lower end of the current range and that the market is seeking value lower.
A possible trigger could be a confirmed ceasefire deal or the formal reopening of the Strait of Hormuz, releasing pent-up supply and collapsing the geopolitical risk premium rapidly.
Bullish Scenario
If buyers reclaim and establish acceptance above the 96 area, expect a move back toward 105, which remains Daily Level 1.
Reclaiming 96 would signal that buyers have regained control of the upper distribution and that the market is prepared to continue rotating higher within the broader 105 to 86 range.
A possible trigger could be a breakdown of ceasefire talks combined with fresh strikes on Gulf infrastructure, reigniting supply fears and sending the risk premium sharply higher.
Conclusion
Crude oil is caught between two powerful and opposing forces. On one hand, the physical market remains deeply undersupplied as the Strait of Hormuz stays restricted, with global inventories drawing down at a record pace and no credible timeline for normalization. On the other side, the diplomatic noise around a potential US-Iran deal has already slapped nearly 20% off the highs in a single month, demonstrating just how violently risk premium can exit this market. Structurally, price is compressing at the May LVA/VPOC around 96, with 86 as the critical line in the sand for bulls and 105 as the ceiling sellers are defending. Whether 86 holds or breaks will be the defining trade of the coming weeks. The geopolitical tape is trading faster than any chart. The ceasefire crowd already took 20% off the highs. If they are wrong and Hormuz stays shut, 105 could come back on the table fast. Which side of this are you on?
D isclaimer: Past performance is not necessarily indicative of future results. Trading futures involves substantial risk of loss and is not appropriate for all investors. This content is intended for informational and educational purposes only and does not constitute trading advice or a solicitation to buy or sell any futures contract. Trade your own plan and manage risk.
Acronyms:
C - Composite
w - Weekly
m - Monthly
VA - Value Area
VAH - Value Area High
VAL - Value Area Low
VPOC - Volume Point of Control
LVN - Low Value Node
LVA - Low Value Area
HVN - High Value Node
HVA - High Value Area
SP - Single print
ATH - All time high
Solana Futures at a Critical Decision Point as Range TightensFutures De-Risk as Alpenglow Looms on the Horizon
Solana futures sentiment has shifted firmly toward caution in May 2026. Open interest on SOL futures contracts declined roughly 30% through the month, falling from approximately $2.75 billion to $1.90 billion, as leveraged traders pulled back exposure across the board. This de-risking in the futures market stands in notable contrast to the spot side, where SOL ETFs attracted $113 million in net inflows throughout May, marking the strongest monthly total for those products in 2026. The divergence is worth paying attention to: futures participants are cautious, but spot buyers are still showing up.
What makes Solana distinct from mainstream crypto peers like Bitcoin and Ethereum comes down to design philosophy and speed. Bitcoin is digital gold, which is a store of value secured by proof-of-work with no smart contract functionality. Ethereum is the original programmable blockchain, but it trades throughput for decentralization, with comparatively slower finality and higher transaction costs. Solana was built from the ground up to be fast and cheap at scale, combining high throughput with sub-second block times and fees that are fractions of a cent, making it the chain of choice for high-frequency activity like meme coin trading, DEX (De-centralized exchange) volume, and real-time payments. That positioning is showing up in the numbers. Solana recently surpassed Ethereum in month-to-date DEX volume and now holds over $2.1 billion in outstanding on-chain loans. The tradeoff has historically been network reliability, though the Alpenglow upgrade is directly targeting that weakness.
On the fundamental side, the biggest story from the past month is Alpenglow. Solana developer Anza confirmed on May 11 that Alpenglow, the network's most significant proposed consensus overhaul to date, went live on a community test cluster, allowing external validator operators to test the new architecture for the first time. The upgrade replaces both Proof of History and TowerBFT, targeting transaction finality of 100 to 150 milliseconds, roughly 80 to 100 times faster than the current system. Solana co-founder Anatoly Yakovenko, speaking at Consensus Miami 2026, said the mainnet launch could come as early as Q3 2026 if testing proceeds without issues. That said, markets have been measured in their reaction. This is a testing-phase catalyst, not a confirmed mainnet launch, and price tends to respond to the confirmation event rather than the development milestone.
On the sell side, Pump.fun deposited over 4.2 million SOL into Kraken throughout May, generating sustained distribution pressure near key support levels. That volume of exchange inflows from a single entity represents a meaningful headwind. The gap between strong on-chain activity and weak price action is something worth watching as a potential coiled spring, or as a sign that fundamentals alone will not drive price until macro conditions improve.
Context - What has the Market done?
The market has been in a downward trend in a block like manner for several months.
Price is currently sitting at a key support area dating back to January 2024.
Since February 2026, the market has been consolidating in a narrow four month balance area between 99, which represents auction block 2 high and daily level 1, and 78, which represents auction block 2 low and daily level 2.
Despite the broader downtrend, sellers have so far been unable to achieve meaningful acceptance below 78.
Likewise, buyers have repeatedly failed to establish acceptance above 99, resulting in continued two way auction conditions.
The longer this balance area persists, the greater the potential for an expansion move once either side gains control.
What to Expect in the coming weeks
The key levels to watch are 78 (daily level 2) and 99 (daily level 1).
Neutral Scenario
Without any significant macro, regulatory, or crypto specific catalyst, expect continued two-way auction within the current balance area between 78 and 99.
Range trading conditions would likely remain dominant as buyers defend support while sellers continue to protect resistance.
A possible macro backdrop of steady but unspectacular risk appetite, with no major policy shifts or geopolitical escalations, keeps the market in this balanced, low-conviction mode.
Bullish Scenario
The first clue that the bullish scenario may be developing is buyers holding bids above the 87.8 (range midpoint) and gradually compressing price toward 99.
If the market breaks and accepts above 99, expect an upside move toward the 115 area, which represents the gap high, followed by possible two-way rotation within the former gap to fill in and repair it.
A possible macro trigger for this scenario could be a confirmed Alpenglow mainnet date, a meaningful acceleration in SOL ETF inflows, or a broader risk-on rotation driven by favorable trade or monetary policy developments.
Bearish Scenario
The first clue that the bearish scenario may be developing is sellers stepping down offers toward the 87.8 (range midpoint) and capping upward rotations.
Continued compression from sellers could eventually push price back toward the 78 level.
If the market breaks and accepts below 78, expect a move toward the 60 area.
A possible macro trigger here could be a deterioration in global risk appetite driven by renewed trade war escalation, a surprise Fed policy shift, or a delay or setback in the Alpenglow mainnet rollout that drains forward-looking buyer conviction.
Conclusion
Solana futures sit at the intersection of a technically significant support structure and a fundamental backdrop that remains split between genuine network strength and near-term distribution pressure. The four-month consolidation between 78 and 99 has produced a coiled setup where the eventual resolution will likely be decisive, and the macro or protocol catalyst that tips the balance may already be forming, which are Alpenglow moving toward mainnet, Pump.fun distribution slowing or accelerating, and ETF inflows either recovering or fading further. The technical levels are clean and the scenarios are well-defined, but the real question is which version of Solana the market decides to price first. Would it be the infrastructure story or the distribution pressure? Which side of this range do you think breaks first, and what catalyst gets it there?
Disclaimer: Past performance is not necessarily indicative of future results. Trading futures involves substantial risk of loss and is not appropriate for all investors. This content is intended for informational and educational purposes only and does not constitute trading advice or a solicitation to buy or sell any futures contract. Trade your own plan and manage risk.
Acronyms:
C - Composite
w - Weekly
m - Monthly
VA - Value Area
VAH - Value Area High
VAL - Value Area Low
VPOC - Volume Point of Control
LVN - Low Value Node
LVA - Low Value Area
HVN - High Value Node
HVA - High Value Area
SP - Single print
ATH - All time high
ZC Corn: Key Inflection at 455 as Trade Winds ShiftMacro Crosscurrents Competing for the Wheel
Corn markets have been pulled in multiple directions over the past month. The single biggest fundamental development came out of Beijing on May 14, 2026, when President Trump and President Xi met for a high-stakes summit that produced a headline agricultural deal. The White House confirmed that China agreed to purchase at least $17 billion annually in US agricultural goods for 2026, 2027, and 2028, on top of the soybean commitments Beijing made at the October 2025 South Korea summit. Prior to the summit, Bloomberg reported that Chinese officials and US counterparts were actively in discussions to specifically include corn, sorghum, and distillers dried grains in the purchases, not just soybeans. That pre-summit chatter was enough to send corn futures above $4.70 per bushel on May 18, as the USDA reported corn export commitments as of April 30 had already surpassed the 3-billion-bushel mark, running 29% ahead of the same point in 2025.
The initial rally faded almost as quickly. When the actual summit details emerged, the language around corn volume, timing, and product breakdown was thin. China began making modest purchases of US wheat and sorghum in the days following, but significant corn bookings have yet to materialize at scale. Corn futures retreated as the market digested the gap between headline ambition and concrete volumes.
The May 12 WASDE (WASDE-671) complicated the fundamental picture further. USDA projected 2026/27 US corn production at 16.0 billion bushels, down 6% year-over-year, with planted area falling to 95.3 million acres and yield estimated at 183 bushels per acre. Ending stocks are projected to drop to 12.1% of use, the lowest ratio in recent averages, pushing the farm-level price forecast 25 cents higher to $4.40 per bushel. Global corn stocks are simultaneously forecast to fall to a 13-year low of 277.5 million metric tons. Export commitments for 2026/27 are forecast at 3.15 billion bushels, down 150 million from the current-year record pace. On paper, these numbers tilt fundamentally constructive, but the market has been slow to fully price the tighter balance sheet because weather-driven yield uncertainty and Chinese purchasing follow-through are the real unknowns.
On the geopolitical front, the US-Iran situation is at an inflection point of its own and cannot be ignored for corn. A ceasefire brokered in early April by Pakistan has held unsteadily, with both sides conducting continued strikes. As of May 25, US and Iranian negotiators have developed a framework to extend the ceasefire 60 days and reopen the Strait of Hormuz, which had been disrupted since the conflict escalated in late February. The Strait closure has kept energy prices elevated and fertilizer costs high throughout the spring planting window. Urea Gulf FOB prices spiked sharply in early March and have remained at elevated levels, with farmers effectively paying around 145 bushels of corn per ton of urea versus roughly 125 bushels at the height of the 2022 fertilizer shock. A durable resolution that allows the Strait to reopen fully would ease fertilizer and fuel cost pressure, but it could also remove a key fear premium that has underpinned grain prices since the war began. Watch this carefully, as a credible reopening announcement would be a bearish catalyst for energy-linked agricultural inputs while simultaneously improving farmer margins on the new crop.
Context - What the Market Has Done
Since August 2025, the market has been steadily stepping up bids and compressing toward the 485 level, which aligns with the June 2025 VAL and Daily Level 1 area.
Buyers have repeatedly attempted to auction above 485, but price has continued to remain capped below that region as responsive sellers defend higher value.
More recently, the market has bee
Current price action continues to reflect a balanced rotational environment rather than directional acceptance, with both buyers and sellers remaining active within established value.
The inability for sellers to drive sustained acceptance below 460 has kept downside momentum limited despite larger projected supply expectations from USDA.
What to Expect in the Coming Weeks
The key level to watch is 455 (Apr VAL / Ascending Trendline).
Bullish Scenario
If buyers are able to continue defending above 455, expect continuation higher toward the 485 area near the June 2025 VAL.
Responsive sellers are expected to remain active near 485. However, if sellers fail to respond aggressively and buyers are able to sustain acceptance through June 2025 value, expect continuation toward 491 at the June 2025 VPOC.
Above 491, the next major upside target becomes the 500 area near the June 2025 VAH.
A potential macro trigger for this scenario would be China making large, specific corn purchase announcements with confirmed volumes and shipment schedules, or a failed Iran deal that keeps fertilizer costs elevated and further pressures projected US acreage below USDA expectations.
Bearish Scenario
If buyers fail to defend 455, expect the market to auction lower toward 443, which aligns with the January 2026 VPOC.
Below 443, the next downside target becomes 438 near the August 2025 VAL.
If sellers remain aggressive and buyers fail to respond meaningfully at 438, expect continuation lower toward 430 , which is the prior swing low / Daily level 1.
A potential macro trigger for this scenario would be the Strait of Hormuz reopening credibly under a durable US-Iran deal, sharply reducing energy and fertilizer cost support, combined with China failing to follow through on corn-specific purchases beyond the initial headline commitments.
Neutral Scenario
If buyers respond from 485 but fail to bid prices back up to 485 on the rotation up, expect the market to coil and compress as buyers continue to step up bids from the lower end while sellers step down offers from the upper end, tightening the auction area progressively.
The current backdrop supports this scenario well. The US-Iran ceasefire remains fragile and unresolved, and Chinese corn purchases are trickling in at a modest pace, neither confirming nor denying the demand thesis. Without a clear directional catalyst, the market has little reason to break out of its range with conviction.
This compression within the range sets up for a more decisive resolution when a confirmed catalyst emerges, either from the US-Iran situation or from confirmed China purchase volumes with specifics attached.
Conclusion
ZC corn sits at a genuinely important juncture where the fundamental picture and the technical structure are telling a similar story. The tighter USDA balance sheet for 2026/27, record-pace export commitments, and elevated fertilizer costs from the Middle East conflict all argue for a constructive underlying tone. At the same time, a large-scale China corn deal remains incomplete in its specifics, the Iran ceasefire framework could shift energy and input costs sharply in either direction, and the WASDE's projection of 3.15 billion bushels in 2026/27 corn exports still represents a step down from the current-year record, flagging that demand growth is not guaranteed. The 455 level is where it all gets decided in the near term. A hold above 455 opens the door back to 485 and potentially 500. A break below 455 would negate the ascending structure and expose 443, 438, and 430 in sequence. The Strait of Hormuz negotiation outcome and the pace of China's actual corn bookings in the coming weeks are the two macro variables worth tracking as closely as the price action itself. Are you positioned for the breakout, or waiting for confirmation at 455?
Disclaimer: Past performance is not necessarily indicative of future results. Trading futures involves substantial risk of loss and is not appropriate for all investors. This content is intended for informational and educational purposes only and does not constitute trading advice or a solicitation to buy or sell any futures contract. Trade your own plan and manage risk.
Acronyms:
C - Composite
w - Weekly
m - Monthly
VA - Value Area
VAH - Value Area High
VAL - Value Area Low
VPOC - Volume Point of Control
LVN - Low Value Node
LVA - Low Value Area
HVN - High Value Node
HVA - High Value Area
SP - Single print
ATH - All time high
NQ All-Time Highs: Pure Breakout or the Ultimate Bull Trap? Context: What the Market Has Done?
NQ staged a powerful V-shape recovery beginning in early April, catalyzed by the announcement of a two-week US-Iran ceasefire on April 7. The ceasefire triggered an immediate broad-based relief rally, with the Nasdaq surging over 2.8% on that single session alone as hedge funds scrambled to cover short positions that had built up throughout the prior month of conflict. Energy prices dropped sharply as well, with oil briefly unwinding a significant portion of its war-driven premium following hopes that the Strait of Hormuz would reopen to commercial traffic.
Since that pivot point, the market has rallied in a near-parabolic fashion, driven by a powerful combination of AI-related momentum, strong large-cap technology earnings, and growing investor optimism that geopolitical tensions will continue to de-escalate. NQ has blown decisively through the pre-war all-time high of 26864, and the market has shown no meaningful sign of relenting. There have been only a handful of red sessions since April, with dip buyers stepping in aggressively on each one.
During the week of May 4, the market established a clear uptrend, trending higher across the week. Last week, however, NQ transitioned into a balancing phase, as evidenced by the balanced weekly volume profile. Value was established higher, which is a healthy price action that allows the market to digest the prior aggressive move and build a base before the next leg. This type of consolidation after a sustained trend is constructive, not a sign of weakness.
Last week closed back within the prior week's Value Area on Friday, as a broad selloff hit across asset classes. The trigger was a deteriorating bond market. A global bond selloff gathered pace into Friday, driven by back-to-back US inflation reports showing sharper-than-expected rises in both consumer and wholesale prices, climbing crude oil prices, and the failure of the US-China summit in Beijing to produce any breakthrough on ending the Iran war or reopening the Strait of Hormuz. Rising yields pressured high-growth technology names, with the Nasdaq 100 tumbling over 1.4% on the session as traders reduced risk into the weekend.
What to Expect in the Coming Weeks?
The key level to watch heading into the coming weeks is 29000, which is the prior week's Value Area Low (VAL).
Bullish Scenario
If buyers continue defending 29000, expect markets to revisit all time highs at 29782.
If the market can accept above the 29500 area, which marks the May 11 weekly value area high, that could open the door for another leg higher into fresh all time highs.
Watch order flow around millennium figures as price moves into uncharted territory, as profit taking may emerge there.
Possible macro trigger:
Nvidia reports earnings on Wednesday May 20, with consensus expecting revenue of approximately $54.4 billion driven by Data Centre demand for its Blackwell chips. A beat on revenue and strong forward guidance could reignite AI momentum buying and send NQ aggressively higher.
The FOMC Minutes, also due Wednesday, could add fuel if they reveal the committee is not as hawkish as the bond market is currently pricing, easing rate hike fears and sending yields lower.
On the geopolitical front, any credible breakthrough in US-Iran peace negotiations or a confirmed, durable reopening of the Strait of Hormuz would likely trigger another sharp relief rally across risk assets, similar to the move seen when the initial ceasefire was announced in April.
Trade access points for bullish scenario:
Stalk for longs at 29000 on lower timeframe confirmation of buyers stepping in. These levels are notorious for overshoots and fakeouts designed to shake out weak longs before the larger buyers initiate.
Stalk for a breakout above 29500 on high volume and strong pace, or a break-and-retest for a lower-risk entry with the tradeoff of potentially missing the move.
Bearish Scenario
If buyers fail to defend 29000, expect a move toward 28700, which is the May 4 weekly VPOC.
If buyers fail to respond there, price could rotate lower toward 28230, which is the May 4 weekly LVN.
Possible macro trigger:
If Nvidia disappoints on earnings or guides cautiously given ongoing uncertainty around chip export rules to China, a sharp unwind in AI-driven positioning could weigh heavily on NQ.
The FOMC Minutes could compound the selling if they reveal a growing number of members are actively debating rate hikes in response to war-driven inflation, pushing Treasury yields above recent highs and triggering a broader risk-off move.
On the geopolitical front, a breakdown or collapse of the ceasefire, a fresh military escalation between the US/Israel and Iran, or a spike in crude oil back toward recent highs would reignite inflation fears, accelerate the bond selloff, and put significant pressure on technology names.
Trade access points for bearish scenario:
Stalk for a breakout below 29000 on high volume, strong pace, and negative delta. Exit quickly if the break is met with absorption and slowing pace, as a short squeeze may follow.
Stalk for a break-and-retest of 29000, entering on lower-volume pullback with good seller absorption, confirmed by delta shifting from passive to aggressive on the tape and DOM.
Neutral Scenario
If price approaches 29500 on top or 29000 below with slowing pace and weak volume, expect rotation back into last week’s value area for continued two way auction.
This would suggest the market is still building value higher before deciding on its next directional move.
Possible macro trigger:
An in-line Nvidia result, FOMC Minutes with no hawkish surprise, and an Iran situation that remains in limbo with neither breakthrough nor breakdown leaves the market without a directional catalyst, keeping NQ rangebound within last week's Value Area.
Trade access points for neutral scenario:
Fade the edges at 29500 or 29000 on reducing volume and slowing pace, using lower timeframe reversal patterns to trigger entry. Be patient with overshoots before rotating back.
Conclusion
NQ is sitting at a technically significant juncture. The macro tailwinds that fueled the V-shape recovery from the April lows, including the US-Iran ceasefire, aggressive short-covering, and AI-driven momentum in large-cap technology, remain intact at the broader level. However, the bond market is now flashing a warning. Rising yields driven by persistent inflation data and a stalled peace process are a headwind that this market will need to navigate carefully. The 29000 level represents the line in the sand. How buyers and sellers respond at this area will determine whether NQ continues its historic breakout into uncharted territory or takes a more meaningful step back to digest the extraordinary gains made over the past six weeks. Watch the orderflow, respect the levels, and let the market tell its story.
Is 29000 going to hold and launch this market to new all-time highs, or is this the exhaustion point where the breakout finally fails? Are you buying the dip or fading the highs? Drop your targets and your bias below.
Disclaimer: Past performance is not necessarily indicative of future results. Trading futures involves substantial risk of loss and is not appropriate for all investors. This content is intended for informational and educational purposes only and does not constitute trading advice or a solicitation to buy or sell any futures contract. Trade your own plan and manage risk.
Key Concepts covered in article:
Balanced Weekly Volume Profile — when the distribution of volume across the week forms a symmetrical, bell-shaped curve, indicating that the market spent time building value at current prices rather than trending directionally, typically a sign of consolidation and acceptance.
Value Area (VA) / Value Area High (VAH) / Value Area Low (VAL) — the range of prices where approximately 70% of the week's volume was transacted. The VAH is the upper boundary and the VAL is the lower boundary. These levels act as reference points for where the market considers fair value.
Volume Point of Control (VPOC) — the single price level where the highest volume was traded during a given period, representing the area of greatest market acceptance and often acting as a magnet for price.
Low Volume Node (LVN) — a price level where very little volume was transacted, indicating that the market rejected that price quickly. LVNs tend to offer little support or resistance and price often moves through them rapidly.
Two-way Auction — a market condition where neither buyers nor sellers are in clear control, resulting in price rotating back and forth between the upper and lower boundaries of an established range as both sides compete for value.
Absorption — occurs at a specific price or cluster of prices where the bid or offer is continuously reloading as one side actively lifts the offer or hits the bid, building a wall of volume at that level.
Pace on the Tape — the speed at which orders are transacting at a given price level. Fast pace signals strong conviction behind a move, while slowing pace suggests the move may be losing steam.
DOM (Depth of Market) — a real-time order book displaying the volume of pending buy and sell limit orders at each price level, allowing traders to see how buyers and sellers are interacting with the bids and offers in real time, including whether bids and offers are stacking or pulling, which reveals the true intention of the market.
Delta — the net difference between aggressive buying and selling volume. Strongly negative delta on a breakdown confirms genuine seller conviction rather than a passive move that is vulnerable to reversal.
Passive vs Aggressive Sellers — passive sellers place limit orders at the ask, waiting for buyers to come to them, while aggressive sellers actively hit the bid, indicating stronger conviction and urgency to push price lower.
Millennium Figures — round number price levels ending in 000 (such as 29000, 30000), which act as significant psychological reference points where large players tend to take profit or initiate positions, often causing increased volatility and temporary stalls in price.
Acronyms:
C - Composite
w - Weekly
m - Monthly
VA - Value Area
VAH - Value Area High
VAL - Value Area Low
VPOC - Volume Point of Control
LVN - Low Value Node
LVA - Low Value Area
HVN - High Value Node
HVA - High Value Area
SP - Single print
ATH - All time high
RTY Breakout to ATHs: Small Caps Lead as War Truce Holds Geopolitical Fog, Rate Uncertainty, and the Small Cap Divergence
The past month has served as a genuine stress test for risk sentiment, and RTY has passed with surprising resilience. The macro backdrop remains anything but clean. The US-Iran conflict, which began with US-Israeli airstrikes in late February, resulted in Iran closing the Strait of Hormuz and sending shockwaves through global energy markets. The Federal Reserve's April 29 FOMC statement explicitly cited Middle East developments as contributing to "a high level of uncertainty about the economic outlook," noting that "inflation is elevated, in part reflecting the recent increase in global energy prices." As of this writing, the ceasefire that took effect on April 8 remains fragile. Trump called Iran's most recent peace proposal "totally unacceptable" on Sunday, and Israeli Prime Minister Netanyahu stated there is still "work to be done," even as Pakistani mediators remain active in the process. The situation is unresolved and fluid, and any escalation or breakdown in negotiations would reintroduce geopolitical risk premiums into energy prices almost immediately.
On the monetary policy front, the picture is equally complex. The FOMC voted to hold the benchmark federal funds rate steady at 3.5% to 3.75% at its April meeting, marking the third consecutive pause following three consecutive cuts in 2025. The meeting was notable for an unusual degree of internal dissent, and markets are now pricing in no changes for the rest of this year and well into 2027. Adding to the uncertainty, Federal Reserve Chair Jerome Powell is departing in mid-May, with Kevin Warsh expected to be confirmed as his successor. Warsh has pledged a "regime change" at the central bank, though he has not been explicit on exactly how that change will be implemented. A leadership transition at the Fed, against a backdrop of sticky inflation and an unresolved war, is a meaningful wildcard for rate-sensitive small caps to navigate.
This is precisely where RTY's story gets interesting. Small caps carry disproportionate floating-rate debt exposure relative to large caps, making them acutely sensitive to borrowing costs. Nearly 40% of debt held by Russell 2000 constituents is floating-rate, compared to less than 10% for S&P 500 companies. When the S&P 500 was selling off continuously through the worst of the US-Iran escalation period in March, RTY was not following suit with the same conviction. Instead, it carved out a distinct accumulation range and ultimately broke to new ATHs before the large cap benchmarks did. In April alone, the small cap benchmark surged 11.8%, reaching a fresh all-time high. The RTY is currently trading near 2,861, with the index up 0.76% at the close of May 8. The divergence from the S&P 500's continued downtrend during the worst of the conflict was not noise. It was a market telling a story about rotation and domestic economic confidence. Investors will want to watch credit spreads, the pace of the Iran negotiations, and any signal from incoming Fed Chair Warsh on the rate trajectory as the most important macro variables going forward.
What the Market Has Done
The market fell back into November's range and value area at the beginning of March.
Unlike the S&P 500, which continually sold off as the U.S.-Iran war progressed, RTY balanced and auctioned two-way between 2580, the low of the pre-war consolidation range, and the 2420 area, which marked November value area low, forming an accumulation range.
On April 8, the market broke out of this accumulation range and rallied through the pre-war consolidation range into new all time highs.
From mid April into late April, markets consolidated in a tight block and accepted prices higher, showing buyers remained in control despite slowing momentum.
Most recently, the market broke out above 2810 and pushed into fresh all time highs, confirming continuation higher for now.
What to Expect in the Coming Weeks
The key level to watch is 2,810 (April VAH).
Bullish Scenario
If markets hold above 2,810 (April VAH), expect continued upside and a revisit of the ATH area near 2,918.
Above 2,918, the next logical target is a push into the 3,000 level, which represents fresh price discovery territory and a psychologically significant round number.
A possible macro catalyst that could support this path would be a meaningful breakthrough in the Iran negotiations, with the Strait of Hormuz moving toward full reopening. This would accelerate the disinflationary impulse from lower energy prices and potentially reopen the door for Fed easing under the incoming Chair.
Neutral Scenario
If the market lacks pace and volume as it approaches the edges of the range, expect two-way rotation between 2,810 and 2,918 (ATHs) as the market works to establish value at higher prices.
This type of balanced, rotational trade is normal and healthy following a sharp breakout. It does not negate the bullish structure but does require patience.
A possible macro setup for this path would be a continuation of the current impasse: the ceasefire holding but without a formal deal, the Fed on pause, and incoming data remaining ambiguous enough to prevent a strong directional macro conviction.
Bearish Scenario
If buyers are unable to hold 2,810, expect a move down through the bid block toward the 2,720 area, where buyers are expected to respond.
A failure to hold 2,810 does not automatically invalidate the broader bull structure, but it would signal that the market is not yet ready to sustain these prices and that more time and value-building below is needed.
A possible macro trigger for this path would be a ceasefire breakdown, renewed escalation in the Strait of Hormuz that sends energy prices surging, a hawkish surprise from the incoming Fed Chair Warsh, or a hard miss on small cap earnings that calls the profitability thesis into question.
Conclusion
RTY's chart tells a story that the headline indices largely missed. While the S&P 500 was grinding lower through the worst of the geopolitical storm, small caps were quietly building the foundation for a breakout. The technicals are clear: price is above 2,810 and printing new ATHs, and the structure remains bullish as long as that level is defended. From a fundamental and macro standpoint, the picture is more nuanced. The Fed is on hold with a new Chair about to take the helm, inflation remains sticky above 3%, the Iran ceasefire is fragile and actively contested, and nearly 40% of RTY's debt load is floating-rate, meaning the index has more to gain from cuts and more to lose from hikes than its large cap peers. The market, however, has already voted with its feet. Whether the 2,810 level holds will be the most important near-term tell for whether this rally has legs heading into June. Are you watching 2,810, or are you already positioned for the next leg higher?
Disclaimer: This is not financial advice. Analysis is for educational purposes only; trade your own plan and manage risk.
Acronyms:
C - Composite
w - Weekly
m - Monthly
VA - Value Area
VAH - Value Area High
VAL - Value Area Low
VPOC - Volume Point of Control
LVN - Low Value Node
LVA - Low Value Area
HVN - High Value Node
HVA - High Value Area
SP - Single print
ATH - All time high
YM at a Tipping Point: Will the Dow Finally Catch Up? Blue Chips Under Fire: The Weight of 30 Stocks in a Tech-Led World
April ended up being one of the strongest months for U.S. equities in years, with the S&P 500 posting its biggest monthly gain since November 2020, climbing over 10% for the month, and the Nasdaq surging more than 15%, its best monthly performance since April 2020. YM participated in the recovery but noticeably trailed.
The reason comes down to composition and context. The Dow is a price-weighted index of just 30 companies, heavily skewed toward industrials, healthcare, and financials. That structure means it captures far less of the AI-driven earnings momentum that powered semiconductors and megacap tech through April's rally. Apple's strong fiscal second-quarter beat on May 1 lifted the Nasdaq by nearly 1% and pushed the S&P to a fresh all-time high, yet YM finished that same session down 0.31%. This was not an anomaly. It is a pattern. When growth and tech lead, the price-weighted structure of the Dow consistently dilutes the upside that ES and NQ capture with ease.
Several Dow-specific headwinds amplified this dynamic throughout April. Boeing remained volatile, weighed down by ongoing exposure to global aviation and defense demand uncertainty. Merck fell nearly 4% in a single session in mid-April. Nike's roughly 13% single-session drop in early April illustrated precisely how damaging one high-priced component can be to a price-weighted index, even when the broader tape is healthy. On the macro side, the Federal Reserve held rates steady at 3.5% to 3.75% on April 29, marking its third consecutive pause. The meeting produced four dissents, the most since October 1992, reflecting a deeply divided committee on the direction of future policy. The post-meeting statement cited elevated inflation driven by global energy prices as a key reason to remain on hold. Markets are now pricing in no rate changes for the remainder of 2026 and well into 2027. Kevin Warsh, whose Senate Banking Committee confirmation advanced along party lines in late April, is widely expected to take over as Fed Chair imminently. His first meeting will be a critical signal for how rate policy evolves and whether any shift in tone opens room for the value and industrial-heavy Dow to finally play catch-up.
On the geopolitical front, the Iran conflict has shifted from ceasefire optimism into a prolonged stalemate this week. Iran submitted a 14-point proposal through Pakistani mediators, which Trump publicly described as unsatisfactory. Trump also told reporters he was considering whether the U.S. might be better off without a deal at all, while Iranian state media reaffirmed an uncompromising position on the Strait of Hormuz. Vessel traffic through the Strait, which normally handles roughly 3,000 ships per month, fell to just 154 in March. The U.S. Treasury issued a sanctions advisory warning shipping companies against paying Iranian tolls to transit the waterway. Oil remains elevated with Brent crude trading above $110 per barrel and the national average for gasoline sitting at $4.30 per gallon, with California drivers paying over $6.00. This stagflationary backdrop, meaning sticky energy-driven inflation combined with a slowing labor market, is a more direct drag on the blue-chip industrial names inside YM than it is on the AI and semiconductor heavyweights driving NQ. That structural asymmetry is the core reason why YM continues to lag. Entering May, historically a softer period for equities, the question is whether the Dow can find a catalyst of its own or whether it remains the index that follows rather than leads.
What the Market Has Done
Market rebounded aggressively from the 45,100 area (bid block low) after sellers failed to sustain downside continuation.
Price expanded higher and reclaimed most of the downside move that began after the US Iran conflict started.
Unlike NQ and ES, YM still has not reclaimed all time highs, showing clear relative weakness versus broader index peers.
Since mid April, the market has transitioned into a two way rotation environment between 50,100 (Feb LVA / Jan VAH) and 49,000 (Apr LVA).
Current price action suggests responsive buyers remain active at lower value, but initiative buyers have not yet shown enough conviction to force a sustained breakout.
What to Expect in the Coming Weeks
The key level to watch is 50,100 (Feb LVA / Jan VAH).
Neutral Scenario
If buyers are not able to break and accept above 50,100, the path of least resistance is continued two-way rotation between 50,100 (Feb LVA / Jan VAH) to the downside and 49,000 (Apr LVA) as the floor.
This range environment would reflect a market that is waiting for a clearer macro resolution before committing directionally, consistent with the broader tone of uncertainty described by multiple strategists and reflected in the Fed's own statement.
A possible macro trigger for this scenario would be continued ceasefire holding with no meaningful progress toward a permanent deal, oil remaining sticky in the $100 to $110 range, and the Fed staying firmly on hold with no new guidance surprises from the incoming Warsh-led committee.
Bullish Scenario
First sign of the bullish scenario materializing is if buyers hold bids at the 49,400 area (Apr VPOC / the mid of the offer block), confirming demand absorption before a move back toward the top of the range.
If market breaks and accepts above 50,100 with conviction, the next target is 50,916, YM's all-time high set briefly in February when the index first crossed 50,000.
Beyond the ATH, the next targets are the century figures and 51,300.
A possible macro trigger for this scenario would be a meaningful and durable progress toward a permanent Iran ceasefire deal, a material pullback in oil prices from current levels, and/or a dovish signal from the incoming Warsh Fed at his first meeting, which would re-ignite risk appetite across all equity indices, including YM.
Bearish Scenario
If buyers are not able to defend at the 49,000 area (Apr LVA), look for a move down toward the 47,600 area, near the April low, where the next meaningful structural support resides.
A possible macro trigger for this scenario would be a breakdown of the ceasefire, a resumption of active hostilities, oil spiking back above $120, and/or a hawkish shift from the new Fed leadership that forces markets to reprice rate cut expectations further out.
A deterioration in Dow-heavy sectors like healthcare or industrials through earnings or guidance could also act as a catalyst given the price-weighted sensitivity of the index.
Conclusion
YM sits at a genuinely important juncture. Technically, 50,100 is the line in the sand. Until buyers can break and accept above it, the market remains in a range, and the burden of proof rests with the bulls. Fundamentally, the index continues to carry more structural exposure to the risks that are dominating this market cycle. An oil-driven inflation environment, a divided and transitioning Federal Reserve, and persistent weakness in several high-weighted Dow components all explain why YM has lagged NQ and ES even as the broader market recovered. The ceasefire holding or breaking, Warsh's first act as Fed Chair, and whether the 49,000 level holds under pressure are the three variables that will define the next directional move. All eyes on 50,100 because what happens there will tell you everything you need to know about whether YM is gearing up to finally reclaim its highs or setting up for another leg down. What is your bias here — are you fading the range or positioning for a breakout?
Disclaimer: This is not financial advice. Analysis is for educational purposes only; trade your own plan and manage risk.
Acronyms:
C - Composite
w - Weekly
m - Monthly
VA - Value Area
VAH - Value Area High
VAL - Value Area Low
VPOC - Volume Point of Control
LVN - Low Value Node
LVA - Low Value Area
HVN - High Value Node
HVA - High Value Area
SP - Single print
ATH - All time high
HG Copper: War, Tariffs, and a Market at the Edge of 6.15 Geopolitics, Policy, and the Forces Moving Copper Right Now
The US-Iran conflict has shut down the Strait of Hormuz, collapsing global oil supply by 10.1 million barrels per day in March per the IEA, and the demand destruction from $150 crude is now weighing directly on copper's demand outlook.
What is less discussed but arguably more significant for copper specifically is the sulfuric acid crisis the conflict has unleashed. Goldman Sachs flagged on April 21 that the near-total halt of Gulf tanker traffic has strangled global sulfur supply, a critical input for the solvent extraction and electrowinning process that accounts for 17% of global copper production. The DRC, where 50 to 60% of copper output depends on sulfuric acid, faces curtailments of approximately 125,000 tons if disruptions extend beyond late May. China compounded the problem by banning its own sulfuric acid exports effective May 1, putting around 200,000 tons of Chilean production at risk, given Chile sourced roughly a third of its acid from China in 2025. Codelco disclosed in March that the war had already pushed its copper production costs up 5%. These are supply constraints that would be bullish under normal demand conditions, but are instead colliding with a simultaneous demand shock.
On the demand side, China's imports of unwrought copper fell 10.9% in March, yet the Yangshan copper premium climbed to $69 per ton on March 29, its highest since June 2025, a signal that spot buying appetite is quietly recovering ahead of the May Day holiday despite the headline weakness. Chinese smelters set a production record of 1.33 million tons in March, the highest in data going back to 1990, though seasonal maintenance is expected to pull output lower through May. On policy, the Trump administration revised Section 232 tariffs on copper derivative products on April 2, and the broader refined copper tariff decision remains unresolved. Goldman Sachs forecasts a 490,000-ton 2026 surplus while J.P. Morgan sees a 330,000-ton deficit; that wide disagreement between two major institutions is itself a signal of how genuinely uncertain the supply balance is. The two variables that could resolve this compression are an Iran ceasefire that reopens shipping lanes and a mid-2026 tariff announcement that ends the US stockpiling trade.
What the Market Has Done
The market was in a consolidation block between 6.15, which is the composite VAH, and 5.655, which is the December VAH, establishing a well defined balance area over multiple weeks.
There was a spike high above the block at the end of January, but this move was quickly rejected back into range the following session, driven by profit taking and a lack of follow through buying as macro conditions at the time, including a firmer US dollar and cautious China demand signals, failed to support acceptance at higher prices.
In the second half of March, the market broke out of the range below 5.655 and attempted to accept lower, signaling potential continuation to the downside.
Sellers failed to gain control as buyers defended the 5.229 level, which aligns with the bid block mid, indicating responsive demand stepping in at lower prices.
By the first week of April, buyers were able to bid prices back into the consolidation block, reclaiming prior value and negating the downside breakout.
The market subsequently moved up aggressively through the consolidation block and tested 6.15, the composite VAH, showing strong initiative buying.
Price action is now in a tight range, compressing just below 6.15, indicating a potential buildup for a directional move depending on acceptance or rejection at this key level.
What to Expect in the Coming Weeks
The key level to watch is 6.15 (Composite VAH).
Bullish Scenario
If the market is able to break and accept above 6.15, expect a move to 6.3555, which is the spike HVN.
If there are no sellers present at that level, a continuation move toward the 6.62 area, which marks the spike high, becomes increasingly likely.
The possible macro catalyst that could trigger this move is a ceasefire extension or diplomatic breakthrough in the Iran conflict leading to a reopening of the Strait of Hormuz. A resolution would immediately ease energy price pressures, reduce demand destruction fears, and likely spark a relief rally across industrial metals. A simultaneous announcement of a delay or softening in US refined copper tariffs would amplify the move further.
Bearish Scenario
If buyers fail to break higher at 6.15, expect long liquidation and a move down to 5.885, which is the consolidation block mid, where buyers are expected to defend.
If this level fails to hold, the market could rotate through the rest of the consolidation block, targeting 5.655, which is the consolidation block low.
The possible macro scenario that could drive this outcome is an escalation of the Iran conflict, specifically a breakdown in ceasefire talks and a resumption of full Strait of Hormuz disruption. J.P. Morgan noted that copper prices have historically troughed approximately 25% below their peak during major macroeconomic shocks, and Goldman Sachs flagged that Brent oil sustained at $110 per barrel or higher would strip more than one percentage point from copper demand growth. A combination of continued energy shock and a faster-than-expected tariff implementation that signals the end of US stockpiling could also produce this outcome.
Neutral Scenario
In the case of a false break above 6.15 followed by responsive sellers, combined with responsive buyers stepping in at 5.885, expect two way rotation between these levels.
This would likely result in continued balance as the market works to repair and fill in the April low volume area.
The current macro environment is actually well-suited to this outcome, as the ongoing ceasefire ambiguity in the Iran conflict keeps both upside catalysts (resolution) and downside risks (escalation) in play simultaneously, making it difficult for the market to commit to a trend.
Conclusion
HG copper is compressing against the Composite VAH at 6.15 with initiative buyers clearly in control of the narrative coming off the 5.229 bid block mid, yet the macro backdrop remains too unsettled to hand either side a clean edge. The sulfuric acid supply risk across the DRC and Chile is a genuine structural threat that most participants are still not fully pricing, while China's quiet Yangshan restocking beneath the surface contrasts with the bearish headline import figures. The Iran ceasefire status and the mid-2026 refined copper tariff decision are the two macro variables that will ultimately determine whether this compression resolves higher toward 6.3555 and 6.62, grinds lower through 5.885 and back toward 5.655, or simply churns between these poles repairing the April LVA. Price acceptance or rejection at 6.15 in the sessions ahead will be the clearest real-time read available. Are you fading this level or trading the breakout?
Disclaimer: This is not financial advice. Analysis is for educational purposes only; trade your own plan and manage risk.
Acronyms:
C - Composite
w - Weekly
m - Monthly
VA - Value Area
VAH - Value Area High
VAL - Value Area Low
VPOC - Volume Point of Control
LVN - Low Value Node
LVA - Low Value Area
HVN - High Value Node
HVA - High Value Area
SP - Single print
ATH - All time high
SOFR Futures (SR3) Compress at Key Level as Policy Path TightensRates in the Crossfire: The Iran War, Tariffs, and a Fed Between a Rock and a Hard Place
SR3, or the Three-Month SOFR futures contract, is one of the most liquid short-term interest rate instruments in the world. It prices in the market's expectation of the average Secured Overnight Financing Rate (SOFR) over a future three-month period, making it a direct and highly sensitive barometer of Federal Reserve monetary policy expectations. When markets anticipate rate cuts, SR3 prices rise. When the outlook shifts hawkish or uncertainty grows, prices fall. For that reason, SR3 is closely watched by rates traders, macro participants, and institutions managing short-term interest rate exposure.
The rates market has been navigating one of the most complex macro backdrops in recent memory. Heading into 2026, the market had priced in two Federal Reserve rate cuts for the year. That expectation has since been aggressively repriced. At its March 18 to 19 FOMC meeting, the Fed held rates steady at 3.50% to 3.75% for the second consecutive meeting and maintained its median dot plot projection of just one cut in 2026, the same forecast it issued in December 2025. However, markets have since priced out even that single cut, with futures implying no rate change in 2026, and options markets putting the modal path at zero cuts. The probability of a rate hike through early 2027 climbed to roughly 30% following the release of the March FOMC minutes.
The central destabilizing force is the Iran War, which erupted in late February 2026 and disrupted the Strait of Hormuz, sending Brent crude above 108 dollars a barrel. Gasoline prices surged approximately 92 cents per gallon in a single month, to a national average of 3.84 dollars by mid-March. Fed Chair Jerome Powell acknowledged at the March press conference that the near-term effect of higher energy prices will lift inflation, adding that he could not yet look through energy-driven inflation as transitory because the Fed had not yet resolved the prior inflation problem stemming from tariffs. The Fed's March SEP revised projected headline and core inflation higher to 2.7% for 2026, above its prior estimates.
Compounding the energy shock is the unresolved tariff overhang. Core goods inflation picked up to 1.4% over the 12 months through December 2025, at least partially reflecting tariff pass-through. The Fed is effectively caught between two sides of its dual mandate: inflation that has remained above the 2% target for over four years, and a labor market where job creation has, in Powell's own words, slowed to essentially zero. The FOMC minutes from March show that while most participants believe it is too early to fully assess the war's economic impact, some members are openly discussing whether rate hikes could become appropriate if inflation fails to cool. One dissenter, Governor Stephen Miran, voted to cut by 25 basis points at the March meeting, arguing policy remains too restrictive. Fed Governor Christopher Waller stated on April 17 that the conflict is likely to push near-term inflation higher, though he signaled openness to cuts later in 2026 if peace is reached in a timely manner. The next FOMC meeting is April 28 to 29, and traders and participants should closely watch any guidance shift, especially with Powell's term as chair expiring in May 2026 and leadership succession uncertainty adding another layer of unpredictability to the policy path.
What the Market Has Done
SR3 was in a sideways balanced consolidation range from May 2025, rotating between 96.6325 (daily level 2) and 96.3750 (daily level 3), with neither buyers nor sellers able to establish sustained directional control.
Beginning December 2025, sellers began stepping down offers and compressing prices lower toward the 96.375 level (daily level 3), reflecting the progressive repricing of rate cut expectations as tariff inflation remained sticky and the macro-outlook deteriorated.
In mid-March, sellers were able to push price through and below 96.375, triggering a breakdown that extended toward the 96.18 area, where buyers responded with sufficient conviction to establish that level as near-term support (daily level 3).
Buyers subsequently bid prices back up from 96.18 toward 96.375 (daily level 3), where price is now compressing in a tight range, with buyers and sellers battling for control at this critical contested zone.
What to Expect in the Coming Weeks
The key level to watch remains 96.375, which continues to act as a pivotal daily level 3.
Neutral Scenario
Without a clear macro catalyst, expect continued two-way rotational trade within the current tight range
Expect prices to continue rotating between 96.3925 (CVAL / Daily level 3) on the upside and 96.30 (April developing VPOC) on the downside.
Possible Macro trigger: A continuation of the Fed's "wait-and-see" posture at the April 28 to 29 FOMC meeting with no major guidance shift, combined with inconclusive energy market developments, would leave traders without a directional anchor and sustain the current range-bound environment.
Bearish Scenario
If sellers are able to defend 96.375 and step down offers toward 96.32, expect continuation lower.
A break below 96.32 opens the door for a move back down toward 96.18, which aligns with daily level 4, where buyers are expected to respond.
Possible Macro trigger: A deterioration in the Iran conflict, a further spike in crude oil prices, or a hawkish FOMC statement at the April meeting signaling that rate hikes are back on the table would be the catalyst needed for sellers to regain the upper hand and press price lower.
Bullish Scenario
If the market is able to break above and find acceptance above 96.375, expect upside continuation.
Initial upside target sits near 96.440, where sellers previously held offers.
If sellers fail to respond at 96.440, expect extension toward 96.500, which represents the consolidation range midpoint, and potentially 96.535, which aligns with the composite VPOC, where sellers are expected to respond and cap further upside.
Possible Macro trigger: A ceasefire or credible peace deal in the Middle East that takes the pressure off oil prices, or a notably weak nonfarm payrolls print ahead of the April meeting that reignites labor-market concerns and shifts the policy debate decisively back toward cuts, could give buyers the ammunition needed to push through and above 96.375 and sustain higher prices.
Conclusion
SR3 sits at one of the most technically and fundamentally significant junctures it has faced in this cycle. The 96.375 daily level 3 is not just a line on a chart; it is the fulcrum between a market that is repricing toward zero cuts and one that could snap back sharply if the geopolitical or macro picture shifts. With the April 28 to 29 FOMC meeting, elevated oil prices, sticky tariff inflation, and Powell's leadership succession all converging simultaneously, the weeks ahead could define the next significant directional leg in SR3. Watch 96.375 closely. Drop your view in the comments below.
Disclaimer: This is not financial advice. Analysis is for educational purposes only; trade your own plan and manage risk.
Acronyms:
C - Composite
w - Weekly
m - Monthly
VA - Value Area
VAH - Value Area High
VAL - Value Area Low
VPOC - Volume Point of Control
LVN - Low Value Node
LVA - Low Value Area
HVN - High Value Node
HVA - High Value Area
SP - Single print
ATH - All time high
NQ Futures: Navigating the Storm Between War and TradeGeopolitics, Tariffs, and the Tech Tape: What Is Driving Price Action
The macro backdrop for equity markets heading into April 2026 has been anything but quiet. Two dominant forces have shaped risk sentiment across the board: the outbreak of a U.S.-Israeli military conflict with Iran beginning on February 28, 2026, and ongoing trade policy uncertainty stemming from the Trump administration's tariff agenda.
The Iran war, which the International Energy Agency described as creating the greatest global energy security challenge in history, effectively shuttered the Strait of Hormuz, a chokepoint through which roughly 20% of global oil consumption transits. Brent crude, sitting near $70 per barrel before the conflict erupted, surged above $119 at its peak, directly pressuring inflation expectations and complicating the Federal Reserve's rate path. The Atlanta Fed's GDPNow tracker entered negative territory in late Q1 2026 for the first time since the pandemic, raising recession concerns. Goldman Sachs raised its recession probability to 30% and projected unemployment rising to 4.6% by year end, driven largely by the energy shock.
The tech sector bore significant collateral damage. Hardware and semiconductor companies faced a double blow: soaring energy and shipping costs, alongside disrupted supply chains through the Persian Gulf. Helium, a critical input for chipmakers in South Korea and Taiwan, was among the commodities affected. Consumer sentiment cratered, and Wall Street began pricing in a stagflation scenario not seen since the 1970s.
On April 7 to April 8, the landscape shifted dramatically. The United States and Iran agreed to a fragile two-week ceasefire, brokered with assistance from Pakistan and with Oman as a back channel. Trump announced the agreement contingent on Iran reopening the Strait of Hormuz, and Iran's Supreme National Security Council agreed to a temporary reopening. WTI crude plunged over 14% on April 8, and the Dow surged more than 1,325 points, its best single day in a year. The Nasdaq Composite surged 2.8%. However, the ceasefire remains fragile. Iran's parliamentary speaker subsequently accused the U.S. of violations, oil has climbed back toward and above $97 per barrel, and high-level talks are still ongoing. The U.S. government reported its biggest CPI spike in four years for March, driven by energy, underscoring that the inflation problem has not been resolved.
Separately, Trump's broader tariff agenda, including a 10% baseline duty on all imports enacted under Section 122, continues to hang over tech hardware valuations. Morningstar analysts noted that if tariffs persist, fair value estimates for major tech names could fall 10 to 20%. Traders should also keep an eye on whether the Fed pivots on rate cut timing, as easing energy costs could reopen that door sooner than the current market pricing.
What the Market Has Done
Since the final quarter of 2025, NQ has been in a large consolidation range between 26300 (daily level 1) and 24500 (daily level 2), establishing the broader value area as participants digested macro uncertainty.
In February, offers stepped down progressively, forming the top edge of a tighter consolidation range 3 and compressing prices lower as the Iran conflict broke out on February 28 and equity markets globally sold off sharply in response to the energy shock.
In the last week of March, sellers were able to overwhelm buyers at 24500 (daily level 3), and market broke lower through consolidation range 1 down to the 23800 area (daily level 4 / consolidation range 1 low). Buyers initially responded at that level, but sellers maintained control and stepped down offers to 24400 (daily level 3), resulting in a further selloff down to the 23000 area (daily level 5). Buyers strongly rejected prices higher from that zone, consistent with the timing of the ceasefire announcement on April 7 to April 8, when the Dow's best single day in a year and broad risk-on buying across global equities created the conditions for a sharp reversal off the lows.
Recently, markets have bid up strongly back into consolidation range 3 and are now trading above 24870, the March VPOC. This recovery aligns directly with the ceasefire relief rally, the partial reopening of the Strait of Hormuz, and renewed optimism around U.S.-Iran diplomatic talks. Additionally, Trump's post on April 8 indicating the U.S. would work with Iran to remove nuclear material and explore tariff and sanctions relief further fueled risk appetite.
What to Expect in the Coming Weeks
The key levels to watch are 24870 (March VPOC) and 25140 (mid of consolidation range 3).
Bullish Scenario
If markets are able to hold bids above 24870 area or 25140 area, expect continuation higher toward 25650 area (daily level 2).
If the market is able to accept above 25650, expect expansion back toward 26300 area (daily level 1).
A macro catalyst that could trigger this is a durable extension of the ceasefire, confirmed reopening of the Strait of Hormuz, and a credible path toward the U.S.-Iran normalization that allows oil to retreat sustainably and revives Federal Reserve rate cut expectations.
Neutral Scenario
If the market approaches 25650 (daily level 2) with a slower pace and lower volume, expect sellers to defend the level and respond.
Expect rotation back down through consolidation range 3 toward 24870 (March VPOC), where buyers are expected to defend.
Expect a two-way rotation between 25650 and 24870 to establish value higher.
A potential macro backdrop would include mixed economic data and stable rate expectations, keeping markets in balance without a strong directional catalyst.
A macro catalyst that could trigger this is that the ceasefire holds on paper but remains unresolved, with oil stabilizing in the $95 to $100 range, keeping the Fed on hold and limiting the upside case for rate-sensitive tech equities.
Bearish Scenario
If buyers are not able to hold 24870 (March VPOC), expect a move down toward 24500 area (daily level 3), where buyers are expected to respond.
A break below this level would signal acceptance back into the lower portion of the broader range.
A macro catalyst that could trigger this is a breakdown in the U.S.-Iran talks, a resumption of hostilities, or a fresh tariff escalation targeting the tech sector that reignites recession and stagflation fears.
Conclusion
NQ sits at a critical inflection point where technicals and fundamentals are speaking the same language. Price is back inside consolidation range 3 and trading above the March VPOC at 24870, the level that now serves as the line in the sand between bullish and bearish interpretations. The macro picture remains layered. The March CPI print, released April 10, came in at 3.3% annually, the highest reading in nearly two years, with gasoline prices surging a record 21.2% in a single month. Importantly, core CPI held at just 2.6% year over year, which gives the Fed enough cover to hold rates steady at its April 28 to 29 meeting rather than hike, a meaningful distinction for rate-sensitive tech equities. The ceasefire has bought time, but oil remains well above pre-war levels, Analysts have already flagged April's CPI print as likely to be uncomfortably strong, and the diplomatic situation is fragile at best. The market's next directional move will be determined by whether the ceasefire hardens into something durable, whether core inflation stays contained as energy costs bleed into goods and services over the coming months, and whether buyers can continue to defend and build value above 24870 to confirm that the structural low is in. Where do you see NQ going from here, and which scenario are you trading?
Disclaimer: This is not financial advice. Analysis is for educational purposes only; trade your own plan and manage risk.
Acronyms:
C - Composite
w - Weekly
m - Monthly
VA - Value Area
VAH - Value Area High
VAL - Value Area Low
VPOC - Volume Point of Control
LVN - Low Value Node
LVA - Low Value Area
HVN - High Value Node
HVA - High Value Area
SP - Single print
ATH - All time high
GC: Holding the Line After a Historic UnwindMacro Crosscurrents Driving Gold’s Volatility
Reaching a meaningful milestone in any ongoing market coverage often coincides with periods of reflection, and the current backdrop in gold provides exactly that. The macro landscape surrounding Gold Futures has been anything but stable, offering a fitting environment to examine both past developments and what may lie ahead.
Gold’s surge into early 2026 was driven by a convergence of macro forces rather than a single catalyst. In January, expectations around monetary policy shifted notably after Federal Reserve officials signaled a slower pace of rate cuts than markets had anticipated late in 2025. At the same time, real yields remained volatile, which historically has had an inverse relationship with gold.
Geopolitical tensions also played a significant role. The ongoing instability tied to the Iran-Israel conflict escalation in 2026, contributed to safe haven demand, particularly during periods of heightened rhetoric and reported disruptions in regional security conditions. These developments supported flows into precious metals broadly, including silver and platinum.
Another key driver has been persistent central bank demand. Data released through late 2025 and reaffirmed in early 2026 showed continued accumulation of gold reserves by major economies, notably China and India, reinforcing a structural bid underneath the market.
This constructive backdrop began to shift in the first half of March. Gold’s sharp selloff during this period was driven by a repricing in macro expectations rather than a single catalyst. A more hawkish stance from the Federal Reserve, reinforced by firmer inflation data and an energy driven surge in oil prices tied to escalating Middle East tensions, pushed real yields and the US dollar higher. As markets moved toward a higher for longer rate outlook, the opportunity cost of holding gold increased, triggering a broad liquidation of previously crowded long positioning and accelerating the move lower.
What the Market Has Done
In January, gold made a hyperbolic move higher, establishing new all time highs as momentum accelerated on the back of macro uncertainty and strong inflows.
On January 29, the market spiked to print an all time high at 5658.6, but the following session on January 30 saw a large and volatile move lower that swept through the prior seven days of upside, reaching down into the 4500 area, aligning with the 7 January HVN, where buyers responded.
Through February, buyers steadily bid price back toward the highs, but encountered responsive sellers around the 5450 area, marking Daily level 1.
The inability for buyers to revisit all time highs resulted in rotation lower toward the 5000 area, corresponding with the February VAL, where buyers stepped in and defended, leading to two way trade and value establishment.
In the third week of March, buyers lost control as the market broke below value and expanded lower with increasing volatility, driven by long liquidation and fresh short participation.
Price moved through the prior four month range (from November through February) and tagged the November value area, where responsive buyers stepped in aggressively, leading to a rejection higher.
More recently, buyers have stepped up bids and attempted to re-establish upward momentum but have encountered responsive sellers around the 4800 area, aligning with the March LVA.
What to Expect in the Coming Weeks
The Key levels to watch remain 4800 and 4580, which define the current balance area.
Neutral Scenario
Without pace and volume at the edges of the 4800 and 4580 range, expect continued two way rotation as the market works to establish value.
This environment could be driven by a lack of new macro catalysts, with markets awaiting clarity from upcoming Federal Reserve communications or key inflation prints.
Bullish Scenario
If bids begin to step up within the 4800 and 4580 range, this would be the first indication that the bullish scenario is developing.
A break and acceptance above 4800 opens the path toward the 5000 area, which aligns with March LVA 1 and February VAL.
Expect responsive sellers in that region. If sellers fail to contain price, continuation through the offer block could target 5215, the March VPOC.
A potential macro trigger could include a dovish shift from the Federal Reserve or renewed geopolitical escalation that drives safe haven flows.
Bearish Scenario
If sellers step down offers within the 4800 and 4580 range and begin to compress price toward 4580, it would signal increasing downside pressure.
A failure of buyers to hold bids at 4580, followed by a break and acceptance below, opens the door to a move toward 4360, corresponding with Daily level 3.
If responsive buyers fail to appear there, continuation lower toward 4130, the January 23 spike low, becomes likely.
This scenario could be triggered by rising real yields, stronger than expected economic data, or a de-escalation in geopolitical tensions reducing safe haven demand.
Conclusion
Gold remains in a defined balance following a period of extreme volatility, with price now compressing between well established levels as both buyers and sellers continue to respond at the edges. The broader macro backdrop continues to play a decisive role, particularly through shifts in interest rate expectations, real yields, and the evolution of geopolitical risks.
The transition from a momentum driven rally in January to a liquidation led selloff in March highlights how quickly sentiment can change when macro conditions reprice. While structural demand such as central bank buying remains supportive, shorter term direction will likely depend on whether markets lean back toward easing expectations or further entrench a higher for longer rate environment.
From a technical perspective, the current range between 4800 and 4580 remains key. Acceptance outside of this area will likely dictate the next meaningful move, with upside targeting a return toward prior value and downside opening the door to deeper retracement levels outlined above.
As price continues to develop within this range, will gold resolve higher as buyers regain control, or does the recent shift in macro narrative have further to run?
This piece also marks a milestone as our 100th article. A sincere thank you goes out to the readers and traders who have followed along, engaged with the analysis, and contributed to the broader discussion around market structure and macro driven price action. Each phase of the market offers new lessons, and sharing that process continues to be a rewarding part of the journey.
Disclaimer: This is not financial advice. Analysis is for educational purposes only; trade your own plan and manage risk.
Acronyms:
C - Composite
w - Weekly
m - Monthly
VA - Value Area
VAH - Value Area High
VAL - Value Area Low
VPOC - Volume Point of Control
LVN - Low Value Node
LVA - Low Value Area
HVN - High Value Node
HVA - High Value Area
SP - Single print
ATH - All time high