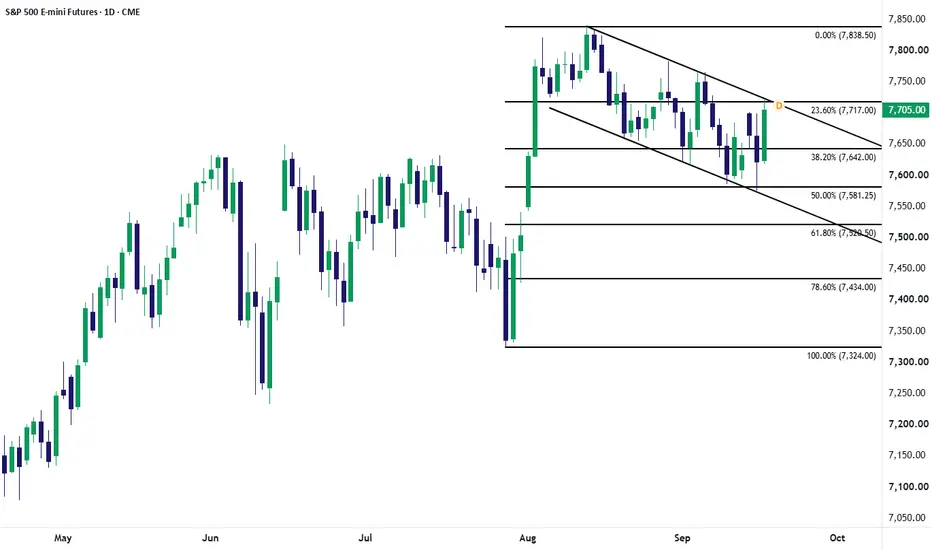
Nasdaq, NVDA Lag Behind the S&P 500 It seemed the reaction in equities a day after the rate hike was well received across markets, with many analysts sounding very bullish given how well stocks performed even as the Fed highlighted another hike by the end of the year.
And while there does remain a bullish setup in the S&P 500, with a bull flag in order, there are other items of possible concern, chief of which is how the Nasdaq which has very much led the way higher from the 2022 lows with the AI trade driving global markets, has started to lag.
The index put in a fresh ATH just a day before Kevin Warsh's first rate decision atop the Fed, and since then, it's been lower-highs. This isn't necessarily a doomsday item yet, but the fact that NVDA hasn't set a fresh high since March - even after a strong quarterly earnings report - along with this built-in lag in the Nasdaq, are items worth keeping attention on.
That said, this chart can possibly be argued as bullish - provided that buyers make a quick return and take out the resitsance trendline, which currently helps to define an inverse head and shoulders pattern.
But if this hawkish twist at the Fed weighs and appetite for chasing NVDA and other semi stocks continues to sour, we could be on the cusp of a larger turn ahead. - JS Bitcoin breaks higher but faces key test nowI hope I don't jinx it for you, but Bitcoin is still technically not in a bullish structure despite today's breakout from falling wedge pattern. Hopefully for the bulls, that changes and soon, but the bears are still clinging on. I don't have a strong view here, instead happy to wait for price to lead us the way. Patience pays.
But what I can say is that Bitcoin had every reason to fall this week, but held steady, and now rallied. Despite the hawkish Fed, strong dollar and risk off sentiment in markets, BTC has risen 6% at its highest point today.
But if you zoom out, it continues to consolidate gains made a few weeks ago. The fact it is holding on here suggests investors are keen to swap their fiat currencies into bitcoin because high oil prices are continuing to push up inflationary pressures, eroding the purchasing powers of £€$¥ etc.
Let’s see if it will hold the break out of bull flag first - confirmation important because of the fact btc is below LT resistance near $80-82k
By Fawad Razaqzada, FOREX.com analyst USDJPY Jumps as Ueda Fails to Offer Rate Hike TimelineIt's probably a peculiar spot for the Bank of Japan wanting or trying to coax JPY strength and hawkish policy. And after a 75-minute briefing at last night's rate hike markets walked away unimpressed with the BoJ's commitment to taming inflation as the Takaichi government continues to spend with debt-to-GDP ratios north of 200%.
The 155 support that showed ahead of the FOMC meeting has since proven to be a launching pad, and price has tested the 158.00 handle as shorts were squeezed aggressively after last night's rate hike announcement.
This story is far from over, however, and after the reaction to Scott Bessent's 'bet against me if you want' comment last week, the US Treasury Secretary is likely emboldened especially if we do see a push up towards the 160.00 handle in the pair. He also said that he had asymmetric information and he knew what the Bank of Japan would do, which was a constraining factor on the long side as there was wide expectation that Kazuo Ueda would have something more to offer than just the 25 bp hike that was already well priced-in.
The big question for traders at this point is where the line in the sand is? We saw a dual intervention at 164.00 so that seems an obvious spot, we got a comment from Katayama at 160.00 regarding cooperation and partnership which helped to lead to the slide two weeks ago.
But, as has been the case since the initial dual intervention in July, bulls have motive to jump in after a slide when support sets, just like we saw last week. The carry is still positive and as long as long-term bulls aren't scared of a shift in underlying fundamentals, there's still reason to establish longs at or around lows.
The math changes as price nears resistance points, however, as the risk-reward on the long side grows less attractive and that's what's on the table for next week, along with what Scott Bessent or Katayama might say on the matter. - JS  Long
Long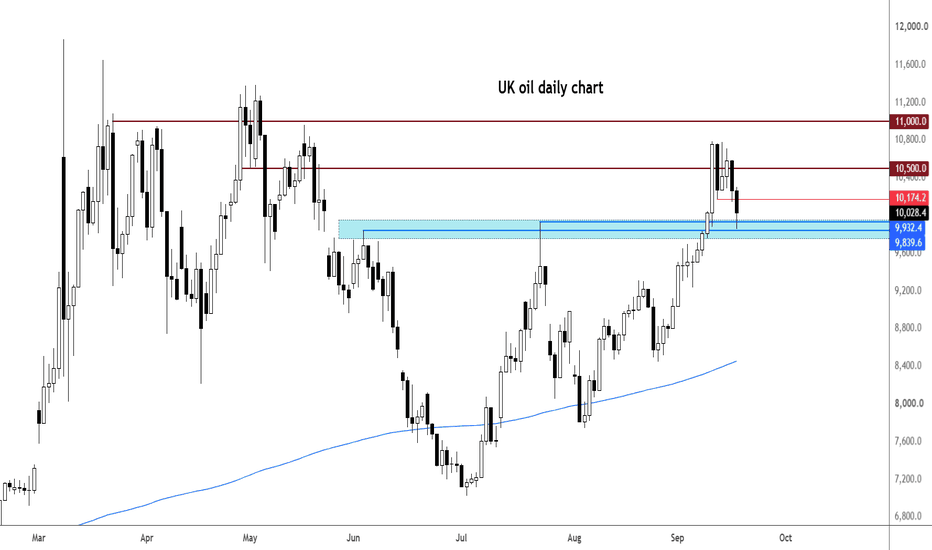
Nasdaq range survives another test of supportRight now it looks like a waiting game for Nasdaq traders. The index has put in a string of lower highs since the record high was set in June, but since around the middle of August, price action has been largely rangebound between 29,670 on the topside and 28,875 below.
More recently, the price has spent more time towards the lower end of that range. There have been multiple tests of 28,875, along with a couple of false breaks below it, but none have stuck.
One option is to keep playing the range. If another break below 28,875 fails and the price reverses back above the level, longs could be considered with a tight stop beneath for protection, initially targeting the minor downtrend running from the mid-August high, then 29,670. The 50-day moving average sits in between and has capped the price over recent days, including in early European trade on Thursday.
At the other end, if the price moves back towards 29,670 and again fails to break higher, shorts could be established with a tight stop above for protection, targeting a retracement towards 28,875.
The other option is to wait for a breakout.
A break and close beneath 28,875 would provide the option to establish shorts with a tight stop above the level for protection, initially targeting 28,000, where the price did some work in late July. Beyond that, the 200-day moving average around 27,287 would come into play.
If the upper end of the range were to break with a close above 29,670, longs could be considered with a tight stop beneath for protection, initially targeting downtrend resistance running from the June record high. Above that, 30,245, the swing high set on August 17, would be the next level, followed by the record high at 30,756.
The oscillators had been pointing to building downside pressure, but that has since reversed on the daily timeframe. For now, it looks more like a case of letting the price action dictate the trade rather than forcing a bullish or bearish bias.
Good luck!
DS USD/JPY Structure into FOMCThe BoJ rate decision may carry more potential for the USD/JPY pair on this go-round but there's some clean structure in-place ahead of the Fed meeting, where the bank is widely expected to hike for the first time in three years.
The 155.00 level has so far been support all morning, and the prior swing-low turned resistance at 155.50 has been resistance.
Below, it's the 153.00 level that's vital especially as we go into later-week trade with that BoJ meeting high on the calendar. If that breaches, larger fears of big picture carry unwind can compel a stronger bearish move.
On the long side, carry is still positive but the bigger question is for how long trends might run. After the intervention at 164, bulls started to get more and more bold until eventually we saw the sell-off from 160.00. This can theoretically cap upside it's just that right now the only clear line-in-the-sand is 160 so the bigger question is how Bessent or the BoJ might respond to a 157 or 158, but it does feel risky going for that, at this point, and if that's clear, it can become a more widespread item as we go into some heavy event risk in the second-half of the week. - JS Warsh's balancing actFed day is here, and the bank is widely expected to hike rates for the first time in three years.
Interestingly, the Fed chair that President Trump took months to select and nominate has come into the bank with a highly hawkish tenor, and this likely has at least a little bit to do with the nomination process. After the administration leaked the name of Kevin Hassett, current director of the National Economic Council and widely considered to be a Trump loyalist, bond markets broke down with yields flying higher. Kevin Warsh was one of the next names on the list, and along the way, Trump said that a willingness to cut rates was a 'litmus test' for whomever he was going to choose.
Matters haven't gone that way, however, as Warsh struck a hawkish tone at his first press conference in June and the reaction across markets was clear. To date, the Nasdaq 100 still hasn't set a fresh high since.
But how hawkish is Warsh, really? It's clear that he has to strike a tone of Fed independence or else the upcoming maturity wall in US debt becomes an even larger problem. If the Fed is disinterested in managing inflation, who would want to hold 10-year notes at a 5% yield?
So, he has to sound like inflation is the priority or else US debt becomes an even more unsustainable problem.
On the other hand, if he invoked a Paul Volcker like stance, where crushing inflation is the only thing that matters, those exuberant valuations in equities start to look even more ridiculous. What's the point of holding on to stocks if the Fed is actively looking to stem economic growth in favor of lower inflation?
So, this is a delicate balancing act, and markets are still very much getting to know Kevin Warsh. It's unlikely that the Fed put has been completely abandoned but given the state of the US Treasury market, there's reason to at least buffer that normally bullish and dovish tone that we've become so used to hearing. - JS Gold breakout risk builds into FedDecision day may have arrived for gold, heading into what’s likely to be the first Fed interest rate increase in three years.
The falling wedge structure we highlighted yesterday remains intact, with the price pressing back towards the upper boundary after a third consecutive failure to move convincingly beneath the 50-day moving average earlier today. That keeps the lower end of the structure in play and suggests bids are still lurking around that area.
While the structure is technical in nature, macro may deliver the trigger. Markets are already pricing a pretty hawkish Fed path, with around four hikes favoured by the middle of next year. My inkling is that the Fed may struggle to out-hawk that.
One obvious route would be an updated dot plot that shows fewer hikes this year and next than markets currently have priced. If the decision and guidance amount to a dovish hike relative to current pricing, we could see some relief in Treasury yields and renewed pressure on the US dollar, giving gold a decent crack at breaking higher from the wedge.
There are also more aggressive bullish scenarios. A shock decision to leave rates unchanged may deliver a sharpe twist steepening of the curve, while several influential FOMC members dissenting in favour of holding could have a similar effect. Either outcome could provide a meaningful release valve for bullion.
While the trigger for a breakout is obvious, confirmation is still required. The key area to watch is the confluence of the 23.6% Fib retracement of the Jan-June bear move around $4,333 with the upper boundary of the falling wedge drawn from the late-August high.
A sustained break above that zone would confirm the bullish breakout and bring $4,400 into focus initially, followed by $4,510.80. Beyond that, the 200-day moving average and 38.2% Fib around $4,575 remain the next major hurdles, before the August high at $4,696.80.
On the downside, the 50-day moving average is now found just above the lower boundary of the wedge structure. A successful break beneath the latter would question the merits of the bullish setup and arguably flip directional risks lower, putting $4,200 back in play.
Good luck!
DS  Long
Long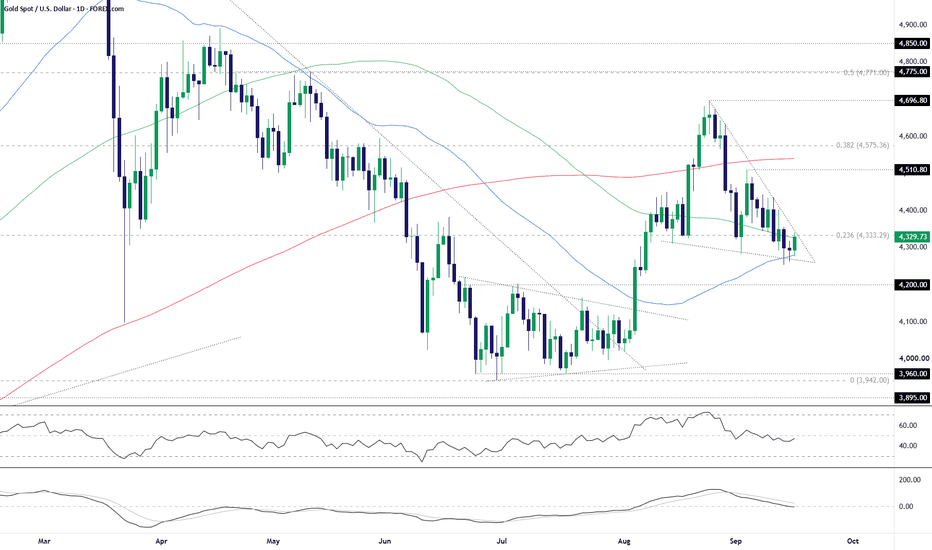
Decision time for Nikkei as price action compressesWe’re getting close to decision time when it comes to the Nikkei, with price action becoming compressed following a period of weakness.
The setup marginally favours an eventual resumption of the prior bearish trend, but I’m waiting for confirmation one way or another through a break of the structure before making any decisions.
A clean break of uptrend support running from the lows hit on Monday would put a retest of 62,715 on the cards, with the swing low set in early August at 62,058 and another swing low set in late July at 60,433 other potential targets if we were to see an extension of the prevailing bearish trend.
Of course, if we saw a break above downtrend resistance running from the highs set in early September that sticks, 64,000 would be the first hurdle for bulls. A push above there may encourage more buyers to join in, putting 64,915, 65,355 and 65,750 in play initially.
Momentum marginally favours the bears, with RSI (14) sitting beneath 50, while MACD remains negative and is starting to converge on the signal line.
One factor that partially offsets the bearish technical bias is the reversal underway in USD/JPY. A weaker yen has historically tended to be supportive for the Nikkei given the index’s large weighting of exporters and offshore earners, potentially providing some support even if the technical structure remains vulnerable.
At this stage, the setup marginally favours the bears, but realistically a definitive price break from the structure would be far more informative on potential near-term directional risks.
Good luck!
DS Gold Wedging into the FedGold broke out in a big way after the last FOMC rate decision, and the big takeaway there was that Kevin Warsh wanted to sound hawkish without actually hiking rates. For this one, however, it looks like there may be little choice as Warsh is but one voice at the Fed and continued strength in inflation, combined with high oil prices, have pushed higher the odds of a move at tomorrow's meeting.
That seems well priced-in for gold but what matters now is what's next. Will the Fed open the door for a second hike this year, as markets are pricing in? This could, of course, risk equity rallies just two months ahead of mid-term elections. Or, will Warsh try to soften the blow during the press conference with talk about confidence around inflation and economic stability despite surging Treasury rates?
In gold, there's a door for bullish reversals but bulls are going to need to move quickly. There's a falling wedge on the daily chart and these are often approached with aim of bullish reversal. The logic being that sellers aren't stretching at lows while they are still hitting pullbacks - and that lack of confidence to drive bearish breakouts is a fact that could eventually turn into less enthusiasm on selling rips. - JS Bitcoin's failed breakoutYesterday, bitcoin was rallying and for a time it looked like it was going to finally break out of the recent consolidation range to the upside, giving us a continuation bullish signal. However, the breakout attempt from the triangle failed to generate much upside and as such the price of BTC started to ease lower late in the day. The failed breakout then triggered fresh selling overnight and now Bitcoin is back to the same support area near 76,500 to 77,000 where it has been trying to establish a base for several weeks now.
What now? Well, the failed breakout attempt suggests we could now see a run on the stops resting below the abovementioned support zone, which could potentially lead to a bit of correction. Next support comes in around 75K, with longer-term levels of 73.8K, 70.0K and 69.0K being the next downside targets to watch.
However, if the 76.5K-77.K support holds once again, and we see a big bounce here, leading to a break above the trend line of the triangle pattern, then at that point all bearish bets would be off again.
From a macro perspective, we have seen a bit of risk off trade in the last few days as yields and oil both continue to press higher, putting pressure on zero-yielding assets. Markets are also awaiting the Fed decision on Wednesday. Could be a volatile next few days, but hopefully some clarity after that.
By Fawad Razaqzada, FOREX.com analyst Hang Seng Tech delivers reversal pattern from support zoneLast week, I highlighted the 4,250–4,100 support zone as an area where traders should be watching closely for reversal patterns or other price action that could provide clues on directional risk.
We may now have one.
After briefly kissing support at 4,250, Hang Seng Tech has printed a three-candle Morning Star bullish reversal pattern, a development that puts added emphasis on the price action today. Given it has formed from a known support zone following an extended decline, the pattern raises the possibility that a near-term bottom may have been established.
Price action today is clearly important, with further gains likely to solidify the belief that a near-term bottom has been formed. If that is the case, upside levels to focus on include the intersection of the August downtrend with 4,460, which was the breakdown zone seen in early September.
A break above that would then put 4,660 and the 50-day moving average on the radar, with the more significant 100-day moving average located just overhead. The latter has consistently rejected counter-trend bullish moves over the past year.
The oscillators also suggest we may be witnessing the start of a turn in bearish momentum. RSI (14) has reversed out of oversold territory and now sits around 34, while MACD is showing signs of converging on its signal line, paving the way for a potential bullish crossover, albeit in negative territory.
Momentum is still with the bears, but it's currently diminishing.
A pullback towards 4,250 that is bought, as we have seen over the prior two sessions, would allow for long entry with a tight stop beneath either 4,250 or 4,190 for protection. Depending on entry level, either 4,460 or 4,660 loom as potential initial targets, although the preference would ideally be for the latter from a risk-reward perspective.
More broadly, while I’m interested in the potential for a short-term counter-trend rally, with the price sitting beneath its key medium and long-term moving averages, all of which are mildly sloping lower, it would take a far more significant bullish move to get me interested in the index’s longer-term prospects.
Good luck!
DS USD/JPY Buy the Dip to Sell the RipThe comments from Scott Bessant last week got a lot of attention, saying that he had access to asymmetric information and he knew what the Bank of Japan was going to do.
Well, we'll find out more later this week when the BoJ is widely expected to hike rates. At this point, that move feels priced-in so more important is what they say about plans for after that move, and this will likely be the bigger driver in the USD/JPY pair and, in-turn, USD markets.
At this point the 155.00 level has been defended by sellers but the four hour chart shows higher-high and low potential, which would be short-term counter-trend. But, perhaps the bigger issue here is a theoretical cap to upside, as we've seen a vociferous response from Bessent on the matter.
For lower-high resistance this week, both 155.44 and 156.68 stand out, before the 157.78-158.09 level comes back into the picture. - JS Trump tries to jawbone oil lowerMoments ago, the US President tried to jawbone the oil market lower by suggesting in a social post that Iran "wants to make a deal, quickly and badly. I will determine whether or not the U.S.A. will choose to engage - The concept of which we are open to."
However, I am not sure if there is any truth in that. Iran has repeatedly denied such reports and I wouldn't be surprised if we hear another denial this time around too.
Crude prices were sharply higher earlier, resuming their rally after Saudi Arabia shut the East-West pipeline following drone attacks from Iraq at the weekend. The route is an important alternative to the Strait of Hormuz, carrying roughly 7 million barrels a day of exports. Meanwhile, Oman-led discussions with Iran and other Gulf states over a temporary shipping route through the Strait have been postponed.
Against that backdrop, don't be surprised to see oil rebound off the lows again.
Support is now seen around the $100.00 area on WTI, with $99.00 being the next important level. For now, the $102.80-$103.00 area has turned into resistance. Break that and $105 could be the next stop.
By Fawad Razaqzada, FOREX.com analyst