Herenya publications
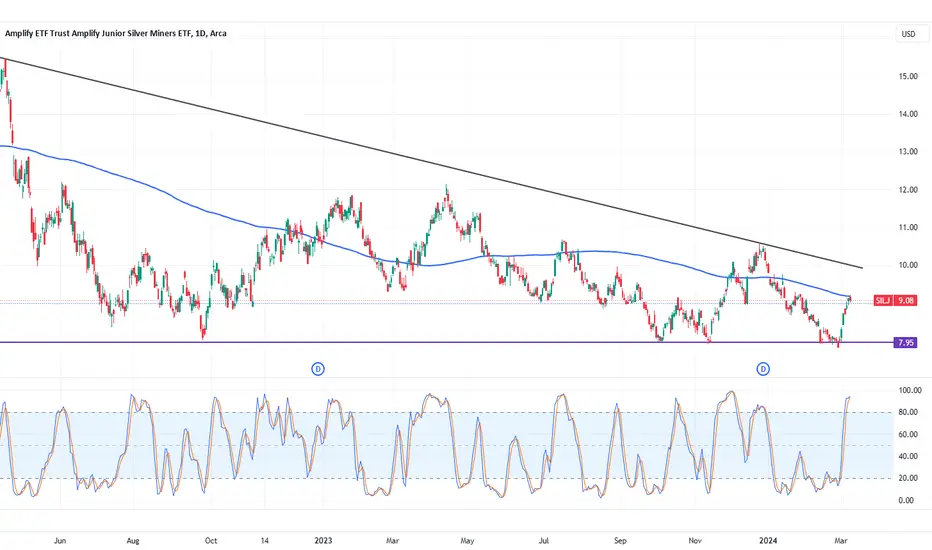
Time to buy Gold again?Gold is starting to look good for a new long entry. Stochastic is pushing up through 20, price might break the recent down trend. We would say that you need to wait for the trendline to break and for the stochastic to break up through 50 before this is a confirmed long trade, but since we want to put it on your radar early, we are calling it a long trade now.
If the market wants to go up, we followThe US500 is breaking the resistance level and trading to new highs. We have to remind ourselves that we are not here to predict, but rather to follow the market. The market is breaking higher, and thus we follow.
For this trade, likely best to just use a trailing stop loss using either a 2-day low price, or ATRx2 trailing stop loss.
Pullback time for J40?The market has run hard and well, and trading against the trend is never a good idea... and here we are putting up a short trade idea on the J40. It seem that the recent upward sloping channel has been broken and we have a decent 1:2 risk-reward short trade to support on the cards. Stop just above the highs, take profit at previous resistance (now support).
Probably safe to trade the bounce hereOil has come under pressure over the last few months but has now traded down to just above a rather significant support level. The $71.71 level (give or take) has been rather significant since early 2020 when it was resistance. Since then, it has turned into support, and now Brent has come down to test it as support once more. Our thinking is that it would be a safe trade to go long for the bounce here. At the very least we will know quickly that we are wrong if the support level fails. At best, we can get a great entry to trade Brent back up to around $90.
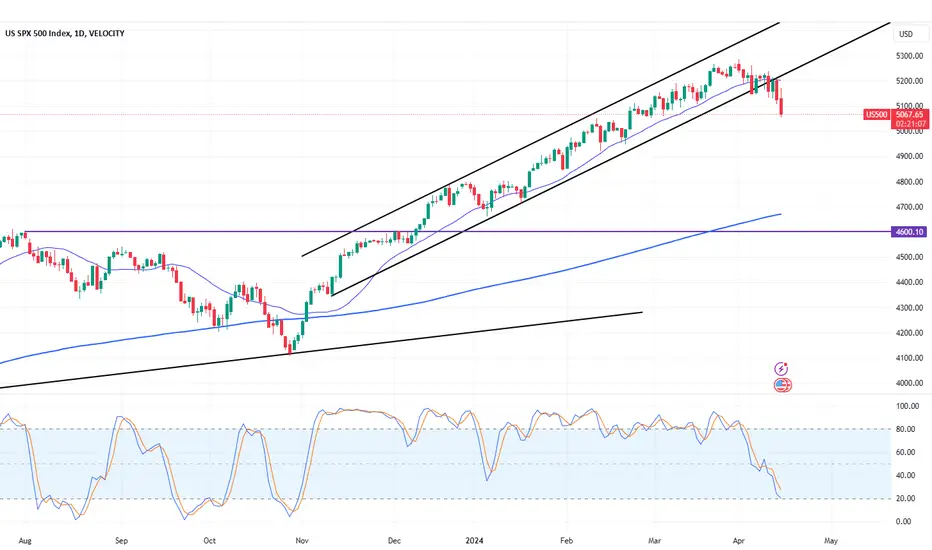
The eye of Sauron, or just another level to be broken?We've seen this kind of setup before. Usually these can be rather good topping patterns. Should the US500 fail to break above the black line indicated and go on to print a new all-time high, we would target the black trend line that coincides with the purple support/resistance level. Wait and see... but our call is that we get a proper correction here.
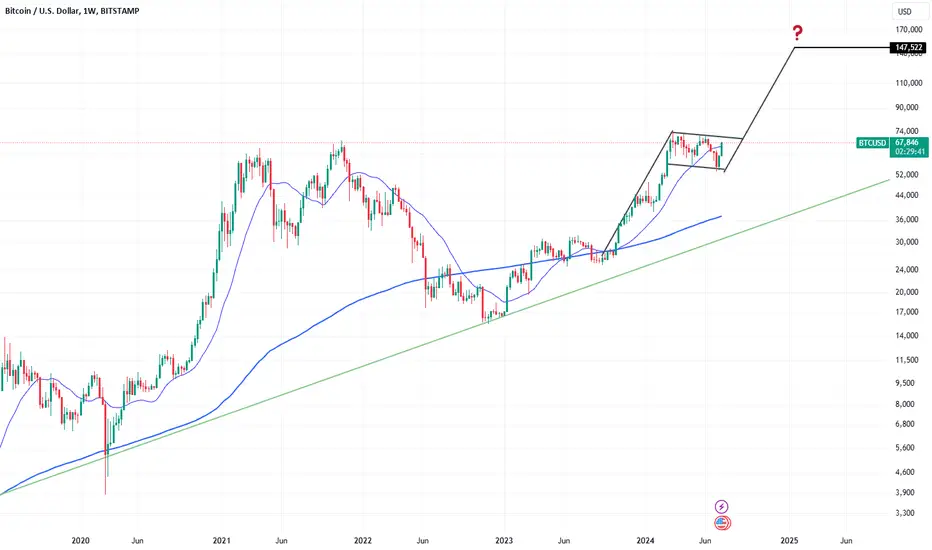
Bitcoin going for that moonlanding?Well, those who have followed our blogs over the last few years would know that we are somewhat (really) bullish on Bitcoin. yes sure, it will be a wildly bumpy ride, but if you have some, just keep em!
Anyway, this chart shows a potential breakout move to new highs. Wait for the flag formation to break higher before you have confirmation, but in our view this is a high probability outcome.
BTI - Early entry into potential trend changeWe are climbing on the bus a little early with BTI. The stock has recently broken above the 200-day moving average, which serves as a great longer-term trend indicator. Thus, we are taking a small long position here, ungeared, with the view to hold it for the next 12 or so months.
Picking bottoms in MTNWell, this is very much against the trend, but there could be a triple bottom forming. Buying here gives us a 1:3 risk-reward ratio, which we think is attractive. Our trade is from this support level to the 200-day moving average. Should the triple bottom formation play out, it opens for a target well above the 200-day moving average giving the trade a 1:6 risk-reward. Our play here is to either stop out below our stop, or take half the profit on the 200-day moving average and keep the last half of the trade open, on a trailing stop, and sell at the formation target (around R117).
XLong
MCG - new deal, new highs?So MCG turned down Canal +, only to announce a content deal with Paramount Plus. This is certainly good news for MCG streaming subscribers. Here's looking good for new highs once this level is broken. We bought the break at R107, which may have been a bit early, but we think it should be ok in the end. Target is R123 with a stop at R100.
XLong
PAN African ResourcesPAN is breaking out of a long-term range.
Consider that this is a weekly chart looking at 5 years' worth of data. So, this price target will take a good long while to be reached and it certainly won't happen in a straight line.
That said, we really like this stock for the medium to longer-term.
XLong
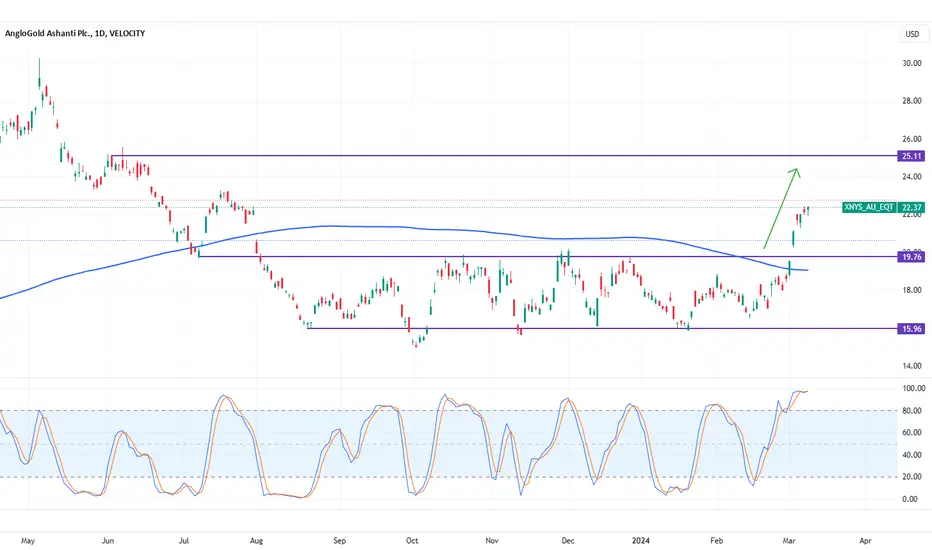
AngloGold Ashanti AU has run a bit already. We called it come time ago when it broke out of the range, so this post serves a little like an update.
We think AU reaches $26.
If you missed the breakout, it might be difficult chasing the stock here. You cold put a 2-day low trailing stop loss on if you wanted to get in now and still have a favourable risk-reward.
As is the case with Barrick Gold, AU has not run nearly as hard as it should have given the Gold price and it has a lot of catching up to do.
So even if you are late to the party here, we think there is still good money to be made.
Barrick GoldThe last time Gold was trading at $2100, Barrick Gold was at $26! Today it is still below $16. The world is obsessed with tech stocks while the gold stocks are deeply undervalued. This is such a strong buy.
This chart shows the physical Gold price versus Barrick Gold. Both have been rebased to 100 and so that they can be accurately compared. Gold has pushed to new highs while the mining stock has drifted lower and lower.
This gap will close, and we think the safest way to play it is to be long Barrick Gold.
Bottom picking AEMAEM is headed straight for key support. We like the idea of buying AEM in the buying zone indicated. It offers a great risk-reward. The stop is below the indicated buying zone with a target at the recent swing high. Great payoff, small amount of risk.
XLong
Barrick Gold, picking up nuggetsThis setup is almost identical to the AEM setup shared a short while ago. Barrick is in the high probability buying zone, thus offering a great risk-reward setup for new long trades. Stop loss below the buying zone and target at the recent swing high.
XLong