BX: Strong Buy Signal After Sharp One-Month RallyKey Highlights
BX stock closed at $143.93, down 3.61% on the day, down 15.63% over the past year, but up 17.62% over the past month.
The one-year chart shows a decline from the $180 area down through a low that printed below $120, followed by a recovery back to the current $143.93 level.
Blackstone's overall daily technical summary reads "Buy," with 14 bullish signals against 3 bearish and 9 neutral readings.
The Moving Averages summary specifically reads "Strong Buy," with 13 of 14 moving averages pointing higher.
The 14-day RSI sits at 63.31, a neutral-to-firm reading, while the Stochastic %K near 87 suggests the stock has moved quickly in the short term.
Classic pivot point resistance levels sit at $136.53, $145.30, and $163.94, with support at $117.89, $108.02, and $89.38.
Blackstone reported FY2025 net income of $3.02 billion on $13.65 billion in revenue, with an indicated dividend yield of 3.63% and a trailing P/E of 33.50.
Price Action: Where Things Stand
Blackstone shares closed at $143.93, falling 3.61% in a single session, with the stock also trading slightly lower after hours at $143.75.
Zooming out, the one-year chart tells a story of a sharp decline followed by a grinding recovery. BX traded near $180 at the start of the period, declined through the $150 pivot line, and bottomed below $120 before recovering. Over the past month alone, BX has gained 17.62%.
This pattern, a deep decline followed by a strong snapback rally, is common after a stock becomes oversold. The key question is whether the current bounce is the start of a new uptrend or simply a relief rally within a longer downtrend.
Moving Averages: A Trend-Following Perspective
For BX stock, the picture across nearly every major moving average is currently bullish. The 10-day SMA sits at $140.70 and the 20-day SMA at $134.19, both flagged "Buy." The 50-day SMA sits at $126.28, the 100-day at $122.74, and the 200-day at $131.08, all trending upward and below the current price.
This alignment, where shorter-term averages sit above longer-term ones and price sits above all of them, is often described as a "bullish stack."
The one outlier is the Hull Moving Average, which reads $149.88 with a "Sell" signal, since the stock's recent pullback from around $150 briefly dipped below this faster-moving line.
Momentum Indicators: RSI, MACD, and Stochastic
The 14-day RSI currently reads 63.31, neutral-to-firm territory, below the overbought threshold of 70. The Stochastic %K reading of 87.11 is more stretched, close to the classic overbought zone above 80. The Stochastic RSI Fast reading of 79.83 tells a similar story.
The MACD Level reading of 5.86 is flagged "Buy," with the MACD line sitting above its signal line, supporting an upward intermediate-term trend. On the other hand, the Commodity Channel Index at 120.77 is flagged "Sell," and Momentum(10) at 16.18 is also flagged "Sell." The overall Oscillators summary reads "Neutral" with 2 sell, 8 neutral, and only 1 buy signal.
Key Support and Resistance Levels
Support: S1 at $117.89, lining up closely with the stock's recent multi-month low. A break below could put S2 at $108.02 into focus, with S3 at $89.38 further down. The central pivot point sits at $126.66, aligning with the 50-day and 100-day moving averages.
Resistance: R1 at $136.53, already cleared given the current price. R2 at $145.30 sits just above current price as the immediate hurdle. R3 at $163.94 marks a more ambitious recovery target.
Business Fundamentals in Context
Blackstone reported full-year 2025 net income of $3.02 billion, up 8.74% from the prior year, on total revenue of $13.65 billion, up 9.60%. Trailing-twelve-month EBITDA came in at $7.72 billion, up 9.30% year over year.
Blackstone carries an indicated dividend yield of 3.63%, with a most recent dividend of $1.29 per share and an ex-dividend date of August 3, 2026. The stock trades at a trailing P/E of 33.50, with a market cap of approximately $178.74 billion. Blackstone insiders sold shares worth over $8 million on August 12, 2026.
Scenarios to Watch
Continuation scenario: BX holds above its rising 20-day and 50-day moving averages, clears R2 at $145.30, and pushes toward R3 at $163.94.
Consolidation scenario: BX trades sideways in the $126 to $145 range, allowing stretched short-term oscillators to cool off while moving averages continue trending higher.
Renewed downtrend scenario: BX breaks decisively below S1 at $117.89, and especially below S2 at $108.02, for the broader one-year downtrend to reassert itself.
Conclusion
Blackstone stock presents a genuinely two-sided technical picture. The one-year trend remains negative, down 15.63%, but the past month brought a sharp 17.62% recovery that pulled the stock back above nearly every major moving average, driving an overall "Buy" technical summary and a "Strong Buy" reading from moving averages. Faster oscillators like the Stochastic suggest the rally has moved quickly enough to be due for a pause, and the Hull Moving Average's "Sell" signal is a reminder that short-term momentum has already cooled slightly.
Key levels to watch: support near the $126 pivot point and $117.89, against resistance at $145.30 and $163.94.
This analysis is for informational purposes only and does not constitute investment advice. Indicator values and pivot levels are as of August 12-13, 2026 and subject to change. ABNB Stock Technical Analysis: Chart Signals & Price TargetKey Highlights
ABNB closed at $184.06, down $1.07 (-0.58%) in the latest session, with pre-market trading showing further softness at $183.02.
The stock has surged 53.37% over the past year and 26.3% over the past month, driven by a sharp late-session breakout above $180.
TradingView's technical summary rates ABNB a "Buy" overall, with Moving Averages at "Strong Buy" while Oscillators register a "Sell" signal.
Every tracked moving average from the 10-day through the 200-day is in Buy territory except the 9-day Hull Moving Average, which is the lone Sell signal at $190.05.
The RSI sits at 74.99, just above the overbought threshold of 70, a sign the recent rally may be due for a pause or pullback.
Classic pivot analysis places immediate resistance near $160.11 and support near $147.91, though the stock has already broken well above these older pivot levels following its recent surge.
Wall Street analysts maintain an overall "Buy" consensus on ABNB from 46 analysts, though the average 12-month price target of $175.53 is actually below the current price, implying limited near-term upside on a purely fundamental basis.
ABNB Stock Price Today: Chart Overview
Airbnb shares recently closed at $184.06, down 0.58% in a single session, a modest pullback after an extraordinary run. Pre-market activity showed further softness, with the stock trading at $183.02. On the one-year view, ABNB has delivered a 53.37% return, with much of that gain concentrated in a sharp burst rather than a steady climb.
Looking at the one-year candlestick chart, ABNB spent most of the period consolidating between roughly $120 and $155, working through several rounded bottoms and local peaks. Then, in the final weeks of the period, the stock broke sharply higher, with one large green candle carrying price from the $150s to above $180 in a matter of sessions. The move coincided with strong earnings momentum and renewed investor enthusiasm around the company's AI-driven platform strategy.
The breakout candle that took ABNB from the $150s to above $180 is one of the largest single moves on the entire one-year chart, and the stock has since traded in a tight range just below its highs, a pattern that often precedes either a continuation higher or a consolidation phase before the next move.
Moving Average Analysis: Is the Trend Bullish?
For ABNB, the picture is overwhelmingly bullish, with TradingView's Moving Average summary currently reading "Strong Buy" with 13 Buy signals against just 1 Sell and 1 Neutral reading.
Every standard moving average is comfortably below the current price. The 10-day EMA sits at $173.27 and the 10-day SMA at $170.17. The 20-day and 30-day averages (EMA $163.90 and $158.58, SMA $158.30 and $154.53) show the same pattern, as does the 50-day pairing (EMA $152.36, SMA $148.42) and the 100-day pairing (EMA $144.78, SMA $141.54).
The 200-day averages, at $138.62 (EMA) and $134.74 (SMA), sit far below the current price, underscoring how much ground ABNB has covered relative to its longer-term trend. The one outlier is the 9-day Hull Moving Average at $190.05, a fast-reacting indicator that registers a Sell signal simply because it sits slightly above the current price.
The wide gap between price and the 200-day moving averages is worth watching. While it confirms a powerful uptrend, it also means the stock is trading well above its historical trend line, which can increase the odds of a mean-reversion pullback even within an otherwise healthy bull trend.
RSI and MACD: Is ABNB Overbought?
Here, ABNB's readings lean cautious, with the overall Oscillators rating at "Sell" (4 Sell, 5 Neutral, 2 Buy), a signal worth taking seriously after such a sharp advance.
The Relative Strength Index (14) reads 74.99, just above the traditional overbought threshold of 70. Readings above 70 often indicate a stock has moved too far, too fast, and may be due for a cooling-off period even within a longer-term uptrend. The Commodity Channel Index at 127.10 and Williams Percent Range at -7.84 both register Sell signals for similar reasons, while Momentum (10) at 32.54 also flags as Sell.
Not every reading points to exhaustion. The MACD Level (12,26) at 10.43 registers a firm Buy signal, confirming that the underlying trend remains upward even if short-term momentum is stretched. The Ultimate Oscillator at 73.75 also leans Buy. Stochastic %K (91.10), Average Directional Index (34.61), Awesome Oscillator (29.51), Stochastic RSI Fast (77.53), and Bull Bear Power (31.10) all sit in neutral territory.
Taken together, the oscillator picture suggests ABNB's rally has been powerful but may be entering a phase where some consolidation or a pullback toward the 10-day and 20-day moving averages would be a healthy and fairly normal development, rather than a sign the broader uptrend is over.
Support and Resistance Levels: Key Pivot Points
Because ABNB just broke out so sharply, several classic pivot levels now sit below the current price and may act more as support on a pullback than as resistance on the way up.
Resistance levels: The classic R1 pivot sits at $160.11, already well below the current price, with R2 at $168.69 and R3 at $189.47. The R3 level, just above the current price, is arguably the more relevant near-term resistance marker, roughly aligning with the Hull Moving Average Sell signal at $190.05.
Support levels: The central pivot point (P) is calculated at $147.91, lining up closely with the 50-day moving averages. Below that, S1 sits at $139.33 and S2 at $127.13, both closer to the stock's pre-breakout trading range.
For traders watching the chart in real time, the $173-$190 zone is the most immediate area of interest, combining the 10-day moving averages, the recent breakout base, and the Hull Moving Average resistance near $190.
Stock Price Target: What Analysts Forecast
Based on ratings from 46 analysts issued over the past three months, the consensus rating is "Buy," though the breakdown shows real division: 20 rate it Strong Buy, 4 Buy, 18 Hold, 2 Sell, and 2 Strong Sell.
The average 12-month price target stands at $175.53, about 4.64% below the current price of $184.06, an unusual situation where the stock's recent rally has outpaced the average analyst target. Estimates from the 36 analysts offering 1-year price forecasts range from a low of $125.00 (-32.09%) to a high of $215.00 (+16.81%), reflecting a notably wide spread of opinion.
This divergence between a bullish technical setup and a more cautious average price target suggests the market has priced in more optimism than the typical analyst currently supports, at least on a 12-month view.
Trend Structure and What to Watch Next
ABNB's chart currently reflects a stock in a powerful uptrend that has just completed a sharp, high-volume breakout after a long consolidation phase. Every major moving average confirms the bullish trend, but the oscillators, led by an RSI just above 70, are flagging that the stock may be short-term overbought after such a fast move.
The key technical question is whether ABNB can hold above the $173-$180 zone, roughly where the 10-day moving averages sit, or whether it pulls back further toward the $160s to work off some of the recent momentum. A hold above the breakout zone with the RSI cooling back toward the 60s would be a constructive sign that the rally has legs. A decisive break back below $170 would suggest the breakout needs more time to consolidate.
It's also worth noting the disconnect between technicals and analyst targets. With the average price target sitting below the current price, some of the stock's recent strength may be running ahead of fundamental estimates, at least for now.
Conclusion
Airbnb (ABNB) stock is showing a powerful technical breakout following a long consolidation phase, with every major moving average confirming the new uptrend. That said, an RSI just above the overbought threshold and a Sell-rated oscillator summary suggest the stock may be due for a pause or pullback after such a sharp advance. Layered on top of that, the average analyst price target of $175.53 sits below the current price, a reminder that fundamentals and near-term technical momentum are not fully aligned right now. ABNB remains a stock worth tracking closely, particularly around the $170-$190 zone where near-term support and resistance are converging.
This analysis is for informational purposes only and does not constitute investment advice. Technical levels are based on TradingView chart data at time of writing and are subject to change.  Long
Long
AMD at the Edge of a Breakout: Key Levels to WatchExecutive Summary
Advanced Micro Devices (NASDAQ:AMD) closed Friday, August 14, 2026 at $514.39, up 6.5% on the session after pricing a $4.75 billion senior notes offering, its largest-ever dollar bond deal.
The notes settle today, Monday, August 17, 2026, making this a genuinely live event rather than old news.
The stock is now pressing directly into a trendline resistance zone near $519.94, with a secondary, more widely cited resistance around $530.
Support has formed in a band between $488 and $494, reinforced by a deeper zone around $463 to $479 built from multiple moving averages.
The 14-day RSI sits in a neutral-to-mildly-bullish range in the mid-50s, leaving room for further upside without flashing overbought.
AMD remains roughly 12% below its 52-week high of $584.73 and has climbed more than 179% over the past 12 months, meaning this breakout attempt sits within a much larger uptrend rather than a fresh reversal.
The Catalyst: A Record Debt Deal to Fund the AI Race
AMD's offering is structured across four maturities: $1.25 billion of 4.600% notes due 2029, $1.5 billion of 5.000% notes due 2031, $1 billion of 5.250% notes due 2033, and $1 billion of 5.500% notes due 2036, with yields ranging from 4.64% to 5.532%.
AMD ended its second quarter with $13.1 billion in cash and short-term investments, and management has said proceeds go toward general corporate purposes rather than plugging an operating shortfall.
AMD's second-quarter revenue reached a record $11.54 billion, up 50% year-over-year, with data center revenue more than doubling to $6.72 billion, now 58% of total sales. Third-quarter guidance calls for revenue around $13 billion, roughly 41% year-over-year growth at the midpoint.
The Technical Setup: Pressing Directly Into Resistance
Over the trailing month, AMD has traded in a $424.03 to $561.47 range, with Friday's close near $514 putting the stock almost exactly in the middle of that range, pressing against trendline resistance around $519.94. A wider lens puts the more commonly cited resistance closer to $530.
Support has organized into two layers: a nearer zone between $488 and $494, and a deeper band from roughly $463 to $479.
The 14-day RSI reads in the mid-50s, generally neutral with a mild bullish lean, well short of overbought territory above 70.
Bullish Case
The combination of a well-received debt deal, 50% revenue growth, doubling data center sales, and RSI still short of overbought gives the stock room to push through $519.94 and test $530. A confirmed close above that zone on strong volume could open a path toward $550 to $585, closing in on the 52-week high.
Bearish Case
AMD has a recent history of failing to hold single-session pops, most visibly reversing from a 7% intraday gain to an after-hours decline after its own earnings report two weeks earlier. A rejection at $519.94 or $530, followed by a fade back toward $488 to $494, would fit the pattern of a stock churning sideways rather than trending decisively.
Risk Implications
A close that holds above $519.94 on confirming volume would signal the breakout has legs. A failure to hold, particularly a slide below $494, would suggest the resistance zone is still doing its job, with the deeper $463 to $479 support band as the next real test.
Analyst price targets range widely from $235 to $1,250, averaging near $546.87 to $612.84, reflecting elevated uncertainty about how far this AI-driven rally can extend. AMD's move also traded alongside strength in Intel, Super Micro, and Nvidia, so any reversal in AI infrastructure sentiment across those names would likely pressure AMD's setup.
Conclusion
With resistance stacked between $519.94 and $530, support layered beneath at $488 to $494 and $463 to $479, and momentum still short of overbought, the setup is about as clean a decision point as this stock has offered in weeks.
This analysis is for informational purposes only and does not constitute financial advice.
 Long
Long
Reddit Below Both EMAs Ahead of Q2 EarningsExecutive Summary:
Reddit NYSE:RDDT fell 9.18% on July 23 after the Wall Street Journal reported the company is reconsidering its AI content licensing deal with Google
Shares are trading near $170, having broken below the 50-day EMA ($186.05) and 200-day EMA ($175.92), with a daily low of $166.13
14-day RSI sits near 31, close to oversold, while support levels stack at $166.10, $152.62, and $139.88
Wall Street's price target range is unusually wide, from $110 to $300, averaging around $221, even as Wedbush, Jefferies, and Piper Sandler all remain constructive
Reddit reports Q2 2026 earnings on July 30, with consensus at $0.97 EPS on $732.82 million in revenue, roughly 47% year-over-year growth
Reddit's stock just took one of its sharpest single-day hits of the year, and the trigger wasn't a earnings miss, a lawsuit, or a guidance cut. It was a report that the company might walk away from a deal, its roughly $60 million-a-year AI content licensing agreement with Google, that it currently has. The market sold first and is still waiting to find out whether Reddit actually pulls the trigger.
This drop didn't happen out of nowhere either. Reddit had already pulled back close to 16% from a recent high before this specific headline hit, part of a broader wave of profit-taking across internet and AI-monetization names in July, even as the stock's underlying growth numbers stayed some of the strongest in the sector. That context is important: this is now the second and sharper leg of a decline that started before the Google licensing story ever broke.
The Mechanics: A Clean Break Below Both Major Moving Averages
The technical damage here is specific and measurable. Reddit broke below both its 50-day EMA at $186.05 and its 200-day EMA at $175.92 in the same session, a double breakdown that flipped the near-term trend structure bearish. Price found a floor at $166.13 intraday before stabilizing slightly above the key $166.10 support zone.
RSI near 31 puts the stock close to oversold, which historically precedes at least a short-term bounce, but the broader momentum picture is mixed rather than confirming a reversal. CCI and Momentum indicators have shifted toward buy signals, suggesting the pace of selling may be fading, while MACD continues to reflect the recent downtrend. The first real recovery hurdle sits at the Hull Moving Average near $175.30, with a denser resistance cluster between $181 and $187 where several other moving averages converge.
Market Impact: The Real Question Is What the Deal Is Actually Worth
Reddit's $60 million-a-year licensing agreement with Google, signed in 2024, allows Google to train its AI models on Reddit's user-generated content. The complication is that Google's own AI Overviews feature has started answering user search queries directly, reducing the click-through traffic that would otherwise flow back to Reddit's platform, effectively meaning Reddit may be helping fund the exact AI feature that's cannibalizing its own traffic.
That tension explains why Reddit executives are reportedly reevaluating the arrangement rather than simply renewing it. But the market's reaction, a 9% single-day drop, treats this as a larger threat than the dollar figure alone would suggest. $60 million a year is a modest line item against $732.82 million in expected quarterly revenue. The bigger concern is what it signals about the durability of AI licensing revenue as a category, a growth narrative Wall Street has leaned on heavily to justify Reddit's valuation.
Competing Interpretations: Overreaction or Warning Sign
The bull case is built on fundamentals that haven't actually changed. Reddit just posted its seventh consecutive quarter of revenue growth above 60%, management's ambition to nearly double U.S. daily active users toward 100 million remains intact, and Wedbush, Jefferies, and Piper Sandler have all reiterated constructive ratings through the selloff, with Wedbush naming Reddit a top mid-cap internet pick specifically for its community engagement and AI monetization potential. A 16-23% pullback from recent highs, on a report about one licensing relationship rather than the core advertising business, reads to bulls as a buyable overreaction.
The bear case points to the pattern building underneath the headline. Reddit's Chief Operating Officer sold roughly $7.75 million in stock on July 15, just before this news broke, and institutional holder Allspring Global Investments reportedly cut its stake by nearly 60% in the first quarter. Layer in retail sentiment on Stocktwits turning bearish, with some traders openly calling the stock overvalued, and the Google deal uncertainty looks less like an isolated headline and more like a catalyst that gave existing skeptics a concrete reason to act.
Risk Implications
Buying this dip ahead of the July 30 earnings report means betting that the core advertising and user-growth story, still growing over 60% for a seventh straight quarter, matters more than the AI licensing uncertainty the market just repriced hard. With RSI near oversold and CCI/Momentum flashing early buy signals, a bounce toward the $175-187 resistance cluster is plausible even without the Google deal question being resolved.
Shorting or avoiding Reddit here means missing a stock where three separate analysts have stayed bullish through the drop, but it also means avoiding a name that just broke both major moving averages on a single headline, with recent insider selling and a large institutional stake reduction sitting in the background. The July 30 earnings report will likely be the first real test of which read was correct.
Conclusion
A 9% drop on an unconfirmed report about reconsidering one licensing deal is a strong reaction, and it tells you more about how nervous the market has become around AI licensing revenue broadly than it does about Reddit's core business, which hasn't shown any actual deterioration yet. The July 30 earnings report, and any update on where the Google conversation actually lands, will decide whether this was a buyable overreaction or the first sign of a bigger valuation reset.
Does a $60 million licensing question justify wiping out this much value from a business still growing 60%+ a quarter, or is the market right to treat AI licensing uncertainty as a bigger red flag than the dollar amount suggests? Curious how you're reading this one.
Disclaimer: This analysis is for informational and educational purposes only and does not constitute financial, investment, or trading advice. Technical levels and ratings are derived from a snapshot of trading-app data and are approximate; verify current levels on a live chart before making any decisions. Past performance does not guarantee future results. AAPL: New Highs, Now Comes the Earnings TestExecutive Summary:
Apple NASDAQ:AAPL hit an all-time high of $334.99 on July 17, 2026, its 15th intraday record of the year, lifting market value to nearly $5 trillion
The stock is up 20% year to date, adding more than half a trillion dollars in market value in July alone
HSBC upgraded Apple from Hold to Buy on July 17, raising its target from $260 to $366, calling the company at "an operational turning point"
Citi separately raised its target to $365, citing record $31 billion Services revenue, while the Street average consensus sits near $311 to $318, below the current price
Apple reports Q3 fiscal 2026 earnings on July 30, with consensus calling for $1.89 EPS (+20% YoY) on $108.85 to $108.89 billion in revenue
Apple has spent 2026 doing something most mega-cap stocks eventually stop being able to do: setting new all-time highs with almost boring regularity. The July 17 record, its 15th of the year, pushed the company's market value toward $5 trillion and briefly made it the most valuable company on earth again. Now comes the test that decides whether this run has been building toward something real or simply running ahead of itself: earnings, on July 30.
Context matters here too. Apple started the year as the stock investors were most skeptical about relative to Nvidia and the hyperscalers, viewed as a laggard in the AI trade because its business model doesn't center on capital-intensive infrastructure spending. That skepticism is exactly what's now reversing, and reversing fast, as banks reassess where the safer, more durable AI monetization actually sits.
The Mechanics: A Stock Trading Above Its Own Analyst Consensus
The technical setup here is unusual for a stock this size. AAPL is currently trading above the average Wall Street price target of roughly $311 to $318, meaning the market has already priced in more optimism than the typical covering analyst is modeling. That's not necessarily bearish, upgrades from Citi and HSBC to $365 and $366 respectively show real analysts are willing to follow the price higher, but it does mean the stock has less of an analyst-consensus cushion than it normally would heading into a binary earnings event.
RSI readings on the daily chart have been pushing into overbought territory as the rally extended through mid-July, a normal feature of a stock making 15 records in seven months, but combined with a trailing P/E near 38 to 39.67x, it leaves less room for anything short of a clean beat to keep the momentum going without at least a pause.
Market Impact: The Bull Case Just Got a Major Upgrade
What changed HSBC's mind is worth understanding, because it wasn't hype, it was a specific repositioning. Analyst Nicolas Cote-Colisson had spent most of 2026 preferring hyperscalers and memory chip makers over Apple, viewing them as better positioned to capture the immediate AI infrastructure boom. His upgrade reflects a different read: Apple sits in a different, arguably safer part of the AI economy, one built on Services compounding and selective pricing power rather than capital-intensive infrastructure spending.
Citi's case leans on a different but complementary data point: record $31 billion in Services revenue, the highest-margin part of Apple's business, growing steadily even as the device market itself slows. Combined with July 16 news that Apple received Chinese government approval to roll out Apple Intelligence features through Alibaba and Baidu partnerships, a move that pushed the stock up 4.2% in a single session, the bull case has stacked several genuinely new catalysts on top of the existing iPhone cycle story in a short window.
Competing Interpretations: Turning Point or Priced for Perfection
The bull case treats July 30 as confirmation, not risk. Services margin expansion, the China Apple Intelligence approval, and an iPhone 18 cycle that Citi frames as the key sentiment driver for the back half of the year all point toward a business hitting multiple growth levers at once rather than relying on any single product cycle. A beat here, on top of already-raised targets from two major banks, could justify the stock pushing well past $350.
The bear case is almost entirely about position, not fundamentals. Apple trades above its own average analyst target, carries a premium P/E near 39x, and needs to clear a bar that's now higher precisely because the stock ran 20% into the print. A miss, or even an in-line quarter that fails to show Services margin expansion or confidence in the iPhone 18 cycle, could trigger a sharp pullback simply because so much good news is already reflected in the price. Insider selling of $87.6 million over the past three months, while not unusual for a company this size, adds a small additional note of caution for anyone weighing the setup.
Risk Implications
Buying into strength this close to earnings means betting that HSBC and Citi's fresh upgrades are the start of a broader re-rating rather than the top of a sentiment wave. The stock's own history this year, 15 records without a major correction, suggests momentum has been genuinely durable, but a P/E near 39x with the stock above consensus targets leaves little cushion if the July 30 report disappoints on any of the specific catalysts, Services margin, China rollout traction, or iPhone 18 pre-order data, that bulls are currently pricing in.
Waiting for the earnings report to reduce risk carries its own cost: if Apple beats and the stock gaps higher the way it did on the China approval news, the entry point only gets more expensive.
Conclusion
Apple's chart says the market already believes the turning point story HSBC just upgraded the stock on. The earnings report on July 30 is where that belief gets tested against actual numbers for the first time. A stock trading above its own analyst consensus, at a premium multiple, heading into a binary event, is either about to earn a new, higher consensus, or about to find out it ran too far ahead of one.
Are you buying this strength into earnings, or waiting to see if $1.89 in EPS actually shows up before trusting the new $365-plus targets? Let me know how you're playing it.
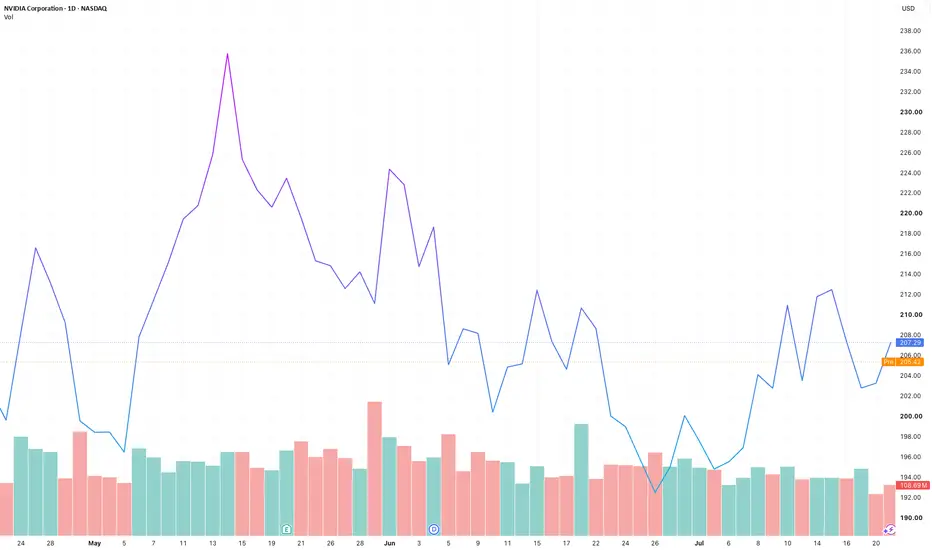
Disclaimer: This analysis is for informational and educational purposes only and does not constitute financial, investment, or trading advice. Technical levels and ratings are derived from a snapshot of trading-app data and are approximate; verify current levels on a live chart before making any decisions. Past performance does not guarantee future results. NVDA Chart Reflects Wall Street's OptimismNvidia's fundamental story hasn't gotten worse. If anything, it's gotten louder. CEO Jensen Huang continues to talk up trillion-dollar data center spending projections, and NVDA briefly touched a $5 trillion market cap earlier this year. The chart has finally started to reflect some of that optimism too: shares are up 1.4% today to $205.73, trading firmly above where they sat for most of July, and the stock's own technical indicators have flipped from a cautious, sit-on-your-hands read to an outright Buy signal.
Price Action: Climbing Back Toward the Top of the Range
NVDA ( NASDAQ:NVDA ) is trading at $205.73, up $2.92 (+1.44%) on the day. Zooming out to the 3-month view, the stock has round-tripped a wide $195–$240 range, spiking to roughly $240 in mid-May, cratering below $200 in June, and now grinding back toward the middle-to-upper end of that band. Over the past three months the stock is essentially flat, up just 2.8%, which tells the real story: this hasn't been a straight-line move, it's been a volatile chop.
The 1-year picture is more constructive. NVDA is up 19% over the past 12 months, having rallied from the mid-$160s to a 52-week high near $236 before settling into the current consolidation. The stock remains roughly in the upper-middle of that 1-year range, not at a new high, but well off the lows.
Support and Resistance
On the daily candlestick chart, the most recent swing high sits just above $213, reached in the middle of last week before sellers stepped back in. Price has since pulled back to test the $205–$206 zone, which is now acting as a pivot; today's move higher is the first real push back above it after a string of red candles.
Immediate support sits at $198–$203, an area that was tested repeatedly during the recent pullback and held. A clean break back below $198 would reopen the low-$190s. On the upside, the $210–$213 zone is the first real resistance shelf; a sustained close above $213 would put the stock back in range of a retest of the $220s and eventually the $236 high.
Technical Ratings: A Clear Shift to Buy
This is the headline change from the prior read. A composite technical summary across the 1-day timeframe now shows an overall Buy rating, with 15 indicators reading Buy, 8 Neutral, and only 3 reading Sell.
Category > Reading
Overall Summary (1-day) > Buy, Sell 3 / Neutral 8 / Buy 15
Oscillators (RSI, Stoch, MACD, etc.) > Buy, Sell 0 / Neutral 7 / Buy 4
Moving Averages > Leaning Buy (full breakdown not captured)
Current price > $205.73, +1.44% today
Notably, zero oscillators are flashing a Sell signal right now, a meaningfully cleaner setup than the "neutral, high-40s-to-mid-50s RSI" picture from a few weeks ago. That doesn't mean the stock is overbought or in danger of a sharp reversal; a 0-Sell / 7-Neutral / 4-Buy oscillator split is a healthy, un-stretched bullish tilt rather than an extreme reading.
Deeper Technical Read
Trend structure. NVDA's weekly uptrend remains intact; the June pullback to the low-$190s looks like a correction inside a broader rising channel rather than a reversal. The daily chart, which had been carving lower highs and lower lows since the June peak, is now showing the first signs of that pattern breaking: today's candle is pushing back above the recent pivot zone on a green volume bar.
Momentum. With oscillators reading 4 Buy / 7 Neutral / 0 Sell, momentum has turned constructive without yet being stretched. That leaves room for the move to continue before any classic overbought warning would kick in.
Volume. The daily chart shows a mix of red and green volume bars through the pullback, with today's advance accompanied by solid volume (~37M+ shares as of the snapshot), consistent with real buying interest rather than a low-volume drift higher.
Moving averages. The moving-average gauge is leaning toward Buy alongside the oscillators, suggesting price has moved back above at least some of the short-term averages that had been acting as resistance during the pullback. That aligns with the shift in the overall rating from a mixed picture to a broad-based Buy.
Two Scenarios From Here
Bullish case: Price holds above $205 and pushes through the $210–$213 resistance shelf on continued volume, opening the door back toward $220 and eventually a retest of the $236 high into or after the August 26 earnings report.
Bearish case: The advance stalls at $210–$213, oscillators roll back toward neutral, and price drifts back down to retest the $198–$203 support shelf, the base case if this bounce turns out to be a relief rally inside the broader consolidation rather than a fresh breakout.
The Bigger Question
The near-term setup has improved: a broad Buy rating, zero Sell oscillators, and price reclaiming ground it lost during the June–July pullback. But NVDA is still well off its $236 high, and the next real test is whether this bounce can clear the $210–$213 resistance shelf with conviction, or whether it fades back into the same range the stock has traded in for the past three months.
The longer-term question hasn't changed: whether the market can keep growing into a world where one chipmaker's valuation rivals the GDP of entire nations. That's a story that will keep being written in Nvidia's earnings reports; the next one lands August 26, not in a single day's candle.
Off to you: Is this the start of a real breakout, or just a bounce inside the same range NVDA has traded in since June?
Disclaimer: This analysis is for informational and educational purposes only and does not constitute financial, investment, or trading advice. Technical levels and ratings are derived from a snapshot of trading-app data and are approximate; verify current levels on a live chart before making any decisions. Past performance does not guarantee future results. MU: Key Support Broken, Watching $897.80 EMA ReclaimMicron ( NASDAQ:MU ) just delivered one of the sharpest two-day drawdowns of its historic 2026 run. Shares fell 8.02% on July 15, from $983.12 to $904.28, then extended the slide to around $853.20 on July 16 as a sector-wide semiconductor selloff, triggered in part by TSMC raising its capex guidance to as much as $60 billion, dragged memory names lower across the board. For a stock that was up nearly 700% over the past year, the pullback is testing whether the AI memory trade still has bulls in control.
The Mechanics: A Textbook Late-Cycle Pullback
The break below $898 is significant because it's not an isolated move, it's the failure of a level that had held for weeks. With the 50-day exponential moving average now rolling over near $897.80, the stock has lost the trend support that carried it through its 2026 rally. Technicians tracking the moving average convergence divergence indicator note a sell signal on the 3-month MACD, and a prior pivot-top sell signal from late June has already played out with a roughly 25% decline from that point.
The 14-day RSI sitting near 29 puts Micron in oversold territory, a reading that historically precedes short-term bounces but does not, on its own, signal a trend reversal. The technical picture stays bearish until MU can close back above its falling channel and reclaim its major moving averages, not simply stop falling.
Market Impact: Fundamentals Bullish, Sentiment Fragile
This is a case where the stock's chart and its fundamentals are telling different stories. On the bullish side, Micron's underlying business has never looked stronger: BofA projects cloud and AI capital expenditure reaching $1.5 trillion by 2027, and KeyBanc just raised its price target to $1,750 on a "tight memory environment through 2027" thesis, even as the stock was falling.
On the bearish side, the very strength of Micron's 2026 rally is what's now fueling the selloff. A stock that ran from double digits to a 52-week high of $1,255 became a crowded, high-beta trade, exactly the kind of position that gets sold hardest when sentiment turns, regardless of fundamentals. Michael Burry's high-profile put position, initiated near Micron's all-time high around $1,051.87, has added a visible bearish voice to the narrative, even though the structural memory demand story hasn't changed.
Competing Interpretations: Healthy Correction or Trend Change
Bullish Drivers
RSI near 29, technically oversold
KeyBanc raised target to $1,750 mid-selloff
BofA projects $1.5T AI capex by 2027
40 analysts rate MU a Buy, 0 sell
Six weeks until next earnings limits new catalysts
Bearish Concerns
50-day EMA broken, trend structure damaged
MACD sell signal active on 3-month basis
Stock still +188% YTD, room to give back gains
High-profile short bets (Burry) adding bearish narrative
Six weeks also means no fundamental catalyst to stop the slide
Bulls argue this is a garden-variety correction inside a structural bull market. The memory pricing story, tight supply, surging AI-driven demand, and a supportive analyst community, remains fully intact. An oversold RSI combined with a Strong Buy consensus from 40 analysts, none of whom rate the stock a sell, suggests the selloff is sentiment-driven rather than fundamentals-driven.
Bears note that markets don't need a fundamental reason to correct a stock that ran nearly 700% in a year. Capacity concerns are creeping into the narrative, as competitors respond to record memory pricing by expanding output, threatening the margin story that drove the rally in the first place. With six weeks until Micron's next earnings report on September 22, there's little on the immediate calendar to reverse the technical damage.
Risk Implications
The most dangerous trade here is catching the falling knife on the oversold RSI reading alone. Oversold conditions can persist, and MU has already shown it can extend a decline once a key support breaks, as it did dropping from $983 to $853 in barely two sessions. Traders looking for a bounce should wait for a reclaim of the 50-day EMA near $897.80 with volume confirmation before treating this as a low, rather than anticipating the bottom.
For bears, the risk sits on the other side: shorting a stock this volatile, with a beta above 3 and a Strong Buy analyst consensus, into an oversold RSI reading carries real squeeze risk, particularly given how sharply MU has reversed in both directions over the past year.
Conclusion
Micron's break below $898 turned a hot 2026 story into a genuine technical test. The fundamentals, tight memory supply, AI-driven demand, rising analyst targets, haven't cracked. The chart has. Until MU reclaims its 50-day EMA and closes back above the broken channel, the technical bias stays bearish, regardless of how bullish the long-term memory story remains.