Bond Market Uncertainty Weighs on NikkeiBy Pranay Yadav, Portfolio Analyst, Mint Finance
Rising bond yields and an unexpected economic slowdown in Japan pose new risks to the Nikkei 225, following its recovery from the tariff-driven decline.
Warning lights are flashing. Downside risk potential is present. Nikkei 225 is trading near its one-year average where it has previously shown a tendency to revert.
What could help an investor hedge the uncertainty in the Nikkei 225?
IMPACT OF RISING JGB YIELDS ON NIKKEI 225
Japan’s bond market witnessed renewed turmoil this spring, with a feeble 20-year auction pushing long-term yields to record highs. The 30-year JGB yield has hit an all-time high.
Chart 1: JGB yields soar, fueled by tightening expectations and inflation pressures.
Source: TradingView as of 23 May 2025
Rising yields pose potential risks for the Nikkei 225. Higher yields pressure the earnings-yield gap, eroding equity risk premium. In layman terms, when bond yields go up, investors will opt for the safety of higher bond returns instead of paying for equity risk premium.
Additionally, higher yields tighten financial conditions, raise borrowing costs and squeeze corporate profits, potentially weighing down on Nikkei 225.
Chart 2: 52-week correlation between JGB yields & Nikkei 225 has turned negative
Source: TradingView as of 30 May 2025
As bond prices tank to decade lows and the yield curve steepens significantly, markets are increasingly vulnerable to disruption from carry trade unwinding.
Chart 3: BoJ policy shift shocked the market last August, driving sharp adverse moves.
Source: TradingView as of 30 May 2025
Historically, volatility in the bond market has often spilled into equities. Past 30Y JGB spikes tended to be succeeded by sharp Nikkei 225 drops. Will history repeat itself?
Chart 4: Historically, JGB volatility spikes have triggered equity volatility.
Source: TradingView as of 30 May 2025
Monetary policy uncertainty & fragile global trade have pushed JGB into turmoil. The GDP contraction in Q1 is an additional factor which will potentially force a shift in BoJ’s policy path. Slowing growth weighs down on the equities through weaker domestic demand.
BoJ’s situation could get complicated due to slowing GDP and rising inflation which may push Japan towards stagflation.
Chart 5: Japan’s economy shrank in Q1 amid disruptive tariff impact.
NIKKEI TRADING AT LONG-TERM MEAN
The Nikkei 225 is trading at its long-term average and over the past year the index has shown strong mean reversion around this level, speaking volume about the need for understanding the market dynamics, economic conditions, and the specific characteristics of the Nikkei 225.
Chart 6: Mean reversion in Nikkei 225 over the past year
Source: TradingView as of 30 May 2025
While past trading levels suggest more upside for a short positioning, a sharp decline may occur if a major risk event unfolds.
Chart 7: Nikkei 225 technical indicators signal contrasting views.
Source: TradingView as of 29 May 2025
A bearish MA crossover is imminent which could suggest near term downside. Although, MACD signals that the recent bearish trend may be fading.
CONCLUSION AND CASE STUDIES
Risk signals are flashing with spiking JGB yields and slipping GDP. As Nikkei 225 trades near its long-term average, risks of mean reversion mount.
Chart 8: Hypothetical short position in CME Micro Nikkei-225 (Yen) futures expiring in September
Source: TradingView as of 6 June 2025
If an investor believes that these risks could materialize and that the Nikkei 225 could decline, they may consider shorting the CME Micro Nikkei 225 (Yen) futures. In this case, the yen-denominated Micro Nikkei Futures contract could further enhance the profit in USD due to the anticipated strengthening of the yen.
The investor should manage downside risk by placing a stop-loss. Based on Chart 8, one option is to set it just above the Jan high of 40,330, a potential resistance level, which would represent a maximum hypothetical loss of JPY 130,000 ((37,730 – 40,330) × 50 yen/contract). Investors with a lower risk tolerance may choose a closer stop-loss.
If the Nikkei 225 pulls back to around 32,250, a support level observed in mid-April, this hypothetical short position could yield JPY 274,000 ((37,730 – 32,250) × 50 yen/contract). However, market movements are unpredictable, and there is no guarantee that the index will reach this level before the futures contract expires.
Hypothetical Short Position:
Entry: 37,730
If Nikkei 225 Falls: 32,250
Stop Loss: 40,330
Potential Gains (JPY): JPY 274,000 ((37,730-32,250) x 50 yen/contract)
Potential Losses (JPY): JPY 130,000 ((37,730-40,330) x 50 yen/contract)
Conversely, investors who remain optimistic that risks highlighted above will not materialize in the near-term, may consider taking a long position in the Nikkei 225 as demonstrated in chart 9.
Chart 9: Hypothetical long position in CME Micro Nikkei-225 (Yen) futures expiring in September
Source: TradingView as of 06 June 2025
The investor could consider placing a stop-loss at the support level of 36,280, which was tested in March, based on Chart 9. This would represent a maximum hypothetical loss of JPY 72,500 ((36,280 – 37,730) × 50 yen/contract).
Assuming Nikkei 225 rises to 40,330, the previous high set in February, the hypothetical long position could yield JPY 130,000 ((40,330 – 37,730) × 50 yen/contract).
Hypothetical Long Position:
Entry: 37,730
If Nikkei 225 Rises: 40,330
Stop Loss: 36,280
Potential Gains (JPY): JPY 130,000 ((40,330-37,730) x 50 yen/contract)
Potential Losses (JPY): JPY 72,500 ((36,280-37,730) x 50 yen/contract)
Directional views on the Nikkei 225 come with inevitable uncertainty. Investors can opt for spread positions to reduce it.
A spread comprising a long position in the Nikkei 225 and a short position in the S&P 500 allows investors to maintain a bullish view on the Nikkei 225 while stay hedged against a potential drawdown through the short S&P 500 position.
We covered the hypothetical spread trade in detail in a previous paper . In brief, this spread trade helps the traders seize opportunities in the relative outperformance of Japan equities due to capital flows to Japan while remain insulated in case of a drawdown.
Foreign funds have been net buyers of Japanese stocks for seven weeks in a row as of May 2025.
Chart 10: Net weekly foreign investment in Japan stocks continues to ramp up
Chart 11: Hypothetical spread between CME Nikkei-225 (USD) and CME E-mini S&P 500 expiring in September
Source: TradingView as of 6 June 2025
Investors can deploy CME Micro E-mini S&P 500 futures alongside CME Micro Nikkei 225 (USD) futures to express this view. Alternatively, the standard E-mini S&P 500 and Nikkei 225 (USD) contracts can also be deployed.
A position consisting of 3 x MNKU2025 ($56,595 = 3 x 0.50 x 37,730) in notional) and 2 x MESU2025 ($60,250 = 2 x 5 x 6,025) in notional) roughly balances notional on both legs, allowing for a purely relative outperformance-based trade.
In this hypothetical trade-setup, the Micro Nikkei 225 (USD) contract is used to maintain P&L on both legs in the same currency, simplifying spread execution.
Looking at Chart 11, the Nikkei 225/S&P 500 ratio previously reached a high of 6.800 last July before retracing. If an investor exits at that level, the potential gain could range from $4,760 to $4,860, as outlined below.
To manage risk, the investor could set a stop-loss at the bottom of the spread range which hit a low of 5.890 in early 2022. This would imply a potential loss between $3,364.5 and $3,810.
www.phillipnova.com.sg
For now, Sayonara!
Micro Nikkei 225 (USD) and Micro E-mini S&P 500 spread tracks the performance of the standard contract spread. Capital Rotation: A Value Play Amidst Tariff HeadwindsNikkei 225 – Capital Rotation: A Value Play Amidst Tariff Headwinds
By Pranay Yadav, Portfolio Analyst, Mint Finance
The US Liberation Day announcement on April 2 sent Nikkei 225 plunging. Subsequent tariff pause led to a strong rebound. Since then, Nikkei has recouped the losses.
Significant risks remain, making renewed weakness possible if tariffs are reinstated after the pause. Major Japanese stocks are heavily reliant on exports to the US. Any disruption significantly hurts their revenues. While examining the tariff impact through the shift in Bank of Japan (BOJ)’s monetary policy, the paper also unpacks recent trend of capital rotation into Japan market.
Chart 1: Nikkei 225 price action on tariff and its pause
Tariffs & Shifting BOJ Outlook
Trade tensions have cast a long shadow over Japan’s economic outlook. At its May 1 meeting, the BOJ held its short-term interest rate at 0.5%, while sharply cutting upcoming growth forecasts.
Market expectations of BoJ rate trajectory have shifted. In a recent Reuters poll, expectation of a rate hike in Q3 2025 declined from nearly two-thirds to just over 50%. Meanwhile, 84% of respondents do not anticipate any rate hikes at BoJ’s June meeting.
Chart 2: The outlook of BoJ rate hikes has been pushed further out, but the terminal rate by the end of 2025 remains unchanged.
The BOJ halved the projected GDP growth for fiscal 2025/26 (to 0.5%) and pushed back the timeline for hitting its 2% inflation target by a full year to 2026.
Governor Kazuo Ueda warned that “recent developments surrounding tariffs will weigh on Japan’s economy by slowing global growth, hurting corporate profits, and prodding households and companies to hold off on spending”.
Policymakers struck a cautious tone, noting “extremely” high uncertainty around the outlook and indicating they will gauge data carefully before adjusting rates.
Downside Risks from Export Weakness
Nikkei has heavy weighting toward major exporters. U.S. tariffs pose a significant risk to their revenues.
Beyond the direct revenue impact, exporters feel the heat of a strong yen. A weaker yen boosts profits when foreign earnings are converted, but as the yen strengthens, the profits tend to shrink due to currency effects.
According to Toyota, one yen change in the USD/JPY currency pair impacts its operating profit by 50 billion yen.
Chart 3: Yen has appreciated 8.8% against the dollar YTD but remains 25% weaker from its 2022 level.
Chart 4: Historically, the Nikkei 225 has shown weaker performance when export volume losses coincided with yen-driven margin compression.
In particular, the tariffs risk impacting the Nikkei 225’s heavy technology exposure.
Chart 5: The Nikkei 225 is dominated (47% weightage) by the tech sector
In an earnings update, Tokyo Electron Management (which has a 5.6% weight) indicated a flat business environment for the year, citing a “lull in both automotive and power semiconductor investment, and investment by emerging Chinese manufacturers.” Strong growth is only expected in 2026.
The retail industry – a major index component (14%) – is dominated by Fast Retailing, which holds the single largest individual weight in the index at 11%.
Fast Retailing the holding company of Uniqlo chains, has already trimmed second-half profit guidance by roughly 2%-3% after accounting for potential duties, despite sourcing most U.S. inventory from lower-tariff Southeast-Asian plants.
Capital Rotation to Japan Through the lens of P/E Convergence
Despite these challenges, global investors are increasingly rotating capital into international equities amid intensifying trade tensions.
EU defence stocks have surged. Chinese equities have risen. Japanese stocks stand to benefit too. Foreign funds were net buyers of Japanese stocks for three weeks in a row in April.
Chart 6: Net weekly foreign investment in Japan stocks has started to ramp up
Japan offers a compelling relative value story. The Nikkei 225 trades at a P/E ratio of 18.3, roughly 34% cheaper than the S&P 500 (27.9 P/E). This valuation gap stands at near multi-decade highs, suggesting room for P/E multiple convergence as Japan’s capital market attracts more inflows.
Chart 7: Nikkei 225’s P/E Ratio is substantially lower than S&P 500, suggesting the potential for P/E convergence
Conclusion
The tariff impact on Japanese equities is multi-faceted. Delay in BoJ rate hikes offers near-term support for the equity market, potential long-term effects on growth & inflation could offset these gains. Moreover, given Japan’s export-dependent economy, tariffs pose a significant revenue risk—particularly for firms with a high index weighting in the Nikkei 225. Many of these companies are already issuing more conservative outlooks for the year ahead.
Chart 8: Technical signals point to a bullish sentiment on Nikkei 225 although resistance is on the horizon
Investors expecting a favourable trade deal may opt for a long position on the Nikkei 225. A hypothetical trade setup is outlined below. In this case, the yen-denominated Micro Nikkei Futures contract could further enhance the profit in USD due to the anticipated strengthening of the yen.
Chart 9: Hypothetical long position on CME Micro Nikkei 225 (Yen) futures expiring in June
Entry: 36,700
If Nikkei 225 rises: 38,500
Stop Loss: 35,200
Potential Gains (JPY): JPY 90,000 ((38,500 – 36,700) x 50 yen/contract)
Potential Losses (JPY): JPY 75,000 ((35,200 – 36,700) x 50 yen/contract)
Reward-to-Risk: 1.2x
Conversely, investors anticipating the continuation of tariffs may consider taking a short position on the Nikkei 225.
Chart 10: Hypothetical short position on CME Micro Nikkei 225 (Yen) futures expiring in June
Entry: 36,700
If Nikkei 225 falls: 34,500
Stop Loss: 38,200
Potential Gains (JPY): JPY 110,000 ((36,700 – 34,500) x 50 yen/contract)
Potential Losses (JPY): JPY 75,000 ((36,700 – 38,200) x 50 yen/contract)
Reward-to-Risk: 1.47x
For investors seeking to avoid directional exposure amid trade uncertainty, a spread trade may be suitable – going long CME Micro Nikkei 225 futures (USD-denominated) and short CME Micro E-mini S&P 500 futures.
Why choose a spread trade? It helps reduce outright risk amid near-term uncertainty. With trade disruptions still unresolved, the outlook remains unclear.
A spread trade taps into the relative outperformance through P/E convergence, limiting downside while capturing divergences in equity performance.
Spread trades help hedge global market shocks—such as the one in early April—while still offering meaningful upside potential.
Chart 11: Nikkei 225/S&P 500 spread protects against a sharp decline during risk events
Largest Decline (Past Year):
Nikkei 225 (Yen) Futures -6.0%
E-Mini S&P 500 Futures -6.1%
Spread -4.5%
Largest Increase (Past Year):
Nikkei 225 (Yen) Futures 7.8%
E-Mini S&P 500 Futures 9.0%
Spread 3.0%
A position consisting of 3 x MNKM2025 ($55,170 in notional) and 2 x MESM2025 ($56,650 in notional) roughly balances notional on both legs, allowing for a purely relative outperformance-based trade.
In this trade setup, the Micro Nikkei 225 (USD) contract is used to keep the P&L on both legs in the same currency for simpler spread execution.
Chart 12: Hypothetical spread position between CME Micro Nikkei 225 (USD) and CME Micro E-mini S&P 500 expiring in June
Scenario 1:
Sell 2 MESM2025 , Buy 3 MNKM2025,
MESM2025: 5,665 -> 5,409
MNKM2025: 36,780 (Unchanged)
Ratio: 6.8
Hypothetical Profit/Loss: USD 2,560 (5665-5409) x 5 x 2
Scenario 2:
Sell 2 MESM2025 , Buy 3 MNKM2025,
MESM2025: 5,665 (Unchanged)
MNKM2025: 36,780 -> 38,522
Ratio: 6.8
Hypothetical Profit/Loss: USD 2,613 (38522-36780) x 0.5 x 3
Scenario 3:
Sell 2 MESM2025 , Buy 3 MNKM2025,
MESM2025: 5,665 -> 5,885
MNKM2025: 36,780 (Unchanged)
Ratio: 6.25
Hypothetical Profit/Loss: USD -2,200 (5665-5885) x 5 x 2
Scenario 4:
Sell 2 MESM2025 , Buy 3 MNKM2025,
MESM2025: 55,665 (Unchanged)
MNKM2025: 36,780 -> 35,406
Ratio: 6.25
Hypothetical Profit/Loss: USD -2,061 (35406-36780) x 0.5 x 3
Trade Nikkei 225 Futures from 10 Cents/Lot*
Trade Nikkei 225 Futures from just 10 cents/lot. Learn more here and access this low-cost opportunity to start trading CME Micro Nikkei 225 with ease.
The author’s views are independent and do not represent that of Phillip Nova. For applicable terms and conditions and a full risk disclaimer, please refer to www.phillipnova.com.sg. This advertisement has not been reviewed by the Monetary Authority of Singapore.
Bullish Nikkei Faces Formidable HeadwindsJapan’s lost decades are behind us. Many long-term factors are driving resurgence in Japanese equities. Economic growth is accelerating – driven by strong domestic consumption. Radical market reforms have made Japan attractive for domestic and global investors. As a result, the benchmark Nikkei 225 set a new all-time-high after four decades.
However, the rally is facing challenges. Tightening monetary policy, trade uncertainties, and waning impact of corporate efficiency reforms pose near-term headwinds that could push the benchmark into a correction, followed by a period of consolidation.
BOJ’s rates hikes
The Bank of Japan (BoJ) plays a crucial role in the performance of Japanese equities. Since 2016, the BoJ instituted negative rates to support economic growth which boosted equity markets.
Chart 1: From 2015 to 2025, loose monetary policy boosted the Nikkei 225, but equities have stagnated since rates began rising
However, in March 2024, the BoJ hiked rates for the first time after two decades. Subsequently, rates were lifted twice, up to 0.5%, the highest since 2008. Crucially, it intends to raise rates further as part of a broader return to neutral policy rate – one that’s neither too restrictive nor too accommodative.
Chart 2: The Nikkei 225 tends to rise slightly before BoJ meetings but falls sharply afterward, especially following rate hike (2024 to Present)
The BoJ is expected to hike rates by 50 basis points by end of March 2026 according to a Reuters poll . Two-thirds expect the next rate hike in Q3, likely in July this year. Traditionally the wage hikes in spring serve as a critical indicator for the BOJ, influencing its decision to continue raising interest rates as part of its shift towards a more neutral monetary policy. This year, many economists expect the wage hikes to match or exceed 5.1% as seen in 2024. With yen’s slide halting, the BoJ will have more room to manoeuvre. Consequently, a rate hike seems likely forming additional headwinds to Japanese equities.
Fading impact of Corporate Reforms
Nikkei’s ascent is also thanks in part to TSE’s corporate reforms. For years, Japanese equities were seen as “value trap,” dissuading investors.
In 2023, to unlock the value trap, the TSE embarked on a campaign to enhance capital efficiency among listed Japanese firms to attract wider investment. New listing rules “urge” firms to deploy their capital better – either through shareholder returns or CAPEX.
These reforms were effective in the near-term, boosting key valuation metrics such as P/B and P/E ratios. However, the improvements from these reforms are starting to slow.
Chart 3: Japan’s Prime Market weighted average Price-to-Book ratio has fallen back to pre-reform levels over the past year (2023 to Present)
Average P/B and P/E ratios of the prime market firms listed on the TSE is back to pre-reform levels. The large short-term bump from these policies have faded, no longer providing an immediate tailwind.
Chart 4: Japan’s Prime Market weighted average Price-to-Earnings ratio has fallen back to pre-reform levels over the past year (2023 to Present)
Tariff Risks Haunt Markets
Perhaps the largest near-term risk facing the Nikkei 225 is the potential for trade disruptions.
Chart 5: Nikkei 225 daily returns show a sharp drop on the day tariffs were announced
Trump has announced a steep 25% tariff on imported cars, set to take effect on April 2, a dramatic 10-fold increase from the current 2.5%. Additionally, he has raised the steel and aluminium tariffs to 25%, with no exemptions or exceptions—a significant blow to Japan, one of America's key trade and security allies. Despite Japan’s trade minister Yoji Muto lobbying for relief in Washington, the U.S. has yet to offer any concessions.
US remains Japan’s largest export market, accounting for ¥21 trillion ($140. 6 billion) in trade, with automobiles making up nearly 28% of that figure. The impending tariff spike is expected to dent Japanese exports, slash domestic production, and squeeze profit margins.
Trade tariffs, especially those impacting some of the largest companies in the Nikkei 225 present a significant risk for investors.
Additionally, the tariffs are likely to lead to a shrinking trade surplus for Japan which may weaken the yen and further exacerbate inflationary pressures, prompting the BoJ to hike rates.
Nikkei 225 is Weighted Towards Exporters
The Nikkei 225 index is dominated by technology firms which makes up almost half of the index. This sector includes both Electronic Manufacturing firms and Software & Communications companies. Notable firms within this sector are Tokyo Electron (5.9%), Advantest (5.7%), Softbank Group (4.2%), and KDDI (2.5%).
Chart 6: Nikkei 225 sector weightings shows large weightage towards technology firms
Other notable categories are Consumer Goods and Materials. Consumer Goods is dominated by Fast Retailing, the single largest component of the index with a weight of 10.7%. The index is impacted substantially by trade given its heavy tilt towards manufacturing. Rising input costs from imports and reduced demand for exports can both stifle performance
Chart 7: Nikkei 225 Sector wise 1Y performance.
Over the past year, Finance has been one of the strongest sectors in the index. Contrastingly, Producer Manufacturing, which has a high weightage in the index, has been among the underperforming sectors. This trend is likely to continue, with trade disruptions and a slowing AI rally posing headwinds to major index components.
CME Group Nikkei 225 Futures
CME Group’s suite of Nikkei 225 futures provide a range of instruments to express views on Japan’s benchmark equity index. Futures are available in two different contract sizes – Standard and Micro. More information on these can be found at the Nikkei 225 Futures page .
Particularly, the newly launched Micro Nikkei 225 contract presents interesting possibilities for both trading & hedging exposure. Due to the smaller size, the contract requires lower margin, boosting capital efficiency for traders. For risk managers, it allows for precise hedging, reducing unwanted residual exposures.
A crucial use case of these futures is the expanded trading hours in the week. Investors can trade CME Group’s Nikkei futures 23 hours a day, 5 days a week, significantly longer than the underlying cash market. This allows futures to be an effective overnight hedging tool.
Chart 8: CME Micro Nikkei futures cumulative volume growth
The Micro Nikkei futures are available both as a yen-denominated, and USD-denominated product. Both provide for compelling use-cases to hedge FX volatility.
Investors can use the USD-denominated contract to negate any risk from movements in the yen, and trade directly using USD.
Conversely, the yen-denominated contract can be deployed strategically to benefit from a strengthening yen.
Technicals Signal Near-Term Bearishness
Technical summary of Nikkei 225 index shows a bearish outlook on the 1D chart timeframe. This suggests potential downside in the near-term.
Chart 9: Nikkei 225 technical indicator signals short-term bearish outlook
In the longer-term (1-month timeframe) Nikkei 225 technical indicators show a bullish signal.
Chart 10: Nikkei 225 long-term technical indicator signals bullish outlook
Looking at specific technical indicators, the rebound following the tariff related decline seems to be fading with MACD and RSI, signalling a weakening trend. With Nikkei 225 trading below a key support/resistance level, strong momentum may be required to pass this level. At present, that momentum is lacking.
Chart 11: Nikkei 225 RSI, Bollinger Bands, and MACD signal emerging bearish trend
Hypothetical Trade Setup
While Nikkei 225 has multiple long-term drivers that support secular growth, near-term risks are palpable. Tariff uncertainty, BoJ policy, and fading impact of the TSE market reforms support a short-term bearish view on the Nikkei 225.
Investors can express this view by deploying a short position on Micro Nikkei (JPY) denominated futures expiring on June 13 (MNIM25). The following hypothetical trade setup provides a reward to risk ratio of 1.8x. The same view can be expressed using CME Group’s standard Nikkei (JPY) denominated contract which would scale the below P&L by 10x.
Crucially, this position’s P&L is denominated in yen. The yen appreciation due to BoJ policy will further boost the USD value of this P&L, enhancing overall returns.
Chart 12: Shorting Micro Nikkei (JPY) futures expiring in June (hypothetical trade setup)
Entry: 37,650
Target: 36,300
Stop Loss: 38,400
Profit REACHED at Target: JPY 67,500 = ((37,650-36,300) x JPY 50), which is around ~USD 450
Loss at Stop: JPY 37,500= ((37,650-38,400) x JPY 50), which is around ~USD 250
Reward to Risk: 1.8x
Trade Nikkei 225 Futures with Phillip Nova from 10 Cents/Lot*
Start trading Nikkei 225 Futures with Phillip Nova from just 10 cents/lot*. Since its inception in 1983, Phillip Nova (formerly Phillip Futures) has become one of the region's top brokerages, offering access to Futures, Stocks, CFDs, Forex. ETFs and Commodities. With clearing memberships in 21 global exchanges, including CME, HKEX, SGX, and more, Phillip Nova offers you a seamless trading experience.
Trade CME Micro Nikkei 225 with a lower barrier to entry. CapitaLand (9CI) Ready to Soar? Watch This Key Level!By Eric Lee , Sales Director of Phillip Nova
CapitaLand Investment (SGX: 9CI) has been in a downtrend since October 2024, falling from its peak of $3.20. However, recent technical signals suggest that accumulation may be taking place, with a potential breakout on the horizon. The volume profile indicates significant trading activity in the $2.40 to $2.60 range, which could signify either accumulation or distribution. Given the bullish signals emerging from other indicators, accumulation appears more likely.
The stock has recently broken out of a Bollinger Band squeeze, typically a sign of increased volatility. The price action suggests buyers are stepping in, pushing the stock above short-term resistance levels. The Know Sure Thing (KST) momentum indicator, displayed in the lower panel, is in a strong upward trajectory, reinforcing bullish sentiment. This suggests that positive momentum is building, potentially supporting a move higher.
Key levels to watch include $2.63 as immediate resistance, with a breakout above this level potentially confirming the bullish trend and setting the next upside target around $3.00. On the downside, $2.40 remains a critical support level. A failure to hold above this level could indicate further weakness. Investors and traders should watch for confirmation signals before taking positions.
Long
S&P500 & Bitcoin Dancing Off Key SupportsBy Eric Lee , Sales Director of Phillip Nova
The E-mini S&P 500 index futures are currently exhibiting a symmetrical triangle formation, a technical pattern that typically indicates a period of consolidation before a potential breakout.
The price is testing the lower boundary of this triangle, suggesting a possible breakdown. Additionally, the index is hovering near the 200-day moving average (MA), a critical long-term support level. A break below this MA could signal further bearish momentum, with the next significant support level based on the triangle formation around 5550.
The correlation between the S&P 500 index and Bitcoin has been a topic of interest, as both assets have shown periods of synchronized movements, particularly during times of market stress.
The recent drop in Bitcoin's price may be indicative of broader market sentiment, potentially foreshadowing a breakdown in the E-mini S&P 500 index futures. If Bitcoin's decline continues, it could exacerbate selling pressure in the equity markets, leading to a more pronounced downturn in the S&P 500 futures. Traders should closely monitor these developments, as a confirmed breakdown could lead to increased volatility and a test of lower support levels. How Yen Trends & Wage Growth Signal Opportunities in Nikkei 225 By Danish Lim Zhi Lin, Investment Analyst
Current Performance of Nikkei 225 Index:
Since our last trade idea ( ), the Nikkei 225 Index has rebounded from around 36,215 on 9 September to 39,480 at the close on 6 November, a gain of about 9%.
Nevertheless, Japanese equities are yet to hit their July record highs, as a stronger Yen, political uncertainty, and potentially higher interest rates weighed on sentiment.
Green Shoots in Japan:
In our previous posting, we highlighted how the fundamentals behind Japanese equities remained unchanged despite a bout of volatility in August and September. We viewed the August drawdown in equities as temporary and believed it was tied to headwinds in the global economy rather than Japan itself. Rising real wages provided further optimism that a virtuous wage-price spiral could be achieved, potentially boosting consumer spending and sentiment.
The latest data on wages supported our view, as Japanese workers’ base salaries saw the largest increase in over 3 decades, backing the BOJ’s view that the economy remains on the recovery track. Base pay advanced 2.6% YoY in September, up from 2.4% in August, the strongest increase in over 31 years. Scheduled cash earnings, a more stable measure of wage trends that excludes overtime pay, rose by 2.9% YoY, up from 2.8%. However, real wages fell for a 2nd straight month.
Nevertheless, wage hike momentum remains steady despite pockets of weakness, this could fuel spending and lead to demand-led inflation. At the same time, corporate reforms and growing shareholder activism have also led to higher dividends, more share buybacks and stronger balance sheets.
While the BOJ kept rates unchanged at its last policy meeting, there is still a possibility of another rate hike further down the road.
US Elections and USD/JPY:
On 6 November, the Nikkei 225 closed up by 2.61%, as the USD/JPY currency pair rose to 153.93 at 15:39 SGT, potentially on the verge of testing the key psychological level of 155. The negative correlation between the Nikkei 225 and USD/JPY has been well documented, with a weaker Yen benefitting many export-heavy Japanese firms such as Toyota and Fast Retailing, parent of Uniqlo.
The rise in the Dollar was driven by an increase in yields across the Treasuries curve following the US election results; as traders positioned for Trump’s tariffs to drive up inflation and tax cuts to boost the budget deficit.
In our view, we believe that the USD/JPY currency pair has more room to extend its rally for the remainder of the year. This could potentially provide further support for the Nikkei 225.
Back in 2016, Trump’s election victory saw the Dollar Index surge over 3% in October, similar to what happened last month. However, the Dollar Index rallied another 3% in November 2016. We could see a similar picture playing out this year. We also expect the Fed to slow its pace of rate cuts, given the inflation-inducing policies Trump is expected to push.
BOJ: To Hike or Not to Hike?
Following Donald Trump’s election win, Japan’s chief currency official Atsushi Mimura said that “we’re seeing one-sided, sudden moves in the currency market” as the yen weakened towards the 155 level against the Dollar. Mimura added that the central bank will monitor markets with a “very high sense of urgency”.
A weak Yen has the potential to boost imported inflation, putting pressure on the BOJ to raise rates. We expect to see verbal intervention from officials if Dollar strength remains in place. A breach of the 160 level could prompt actual currency intervention from the government.
Japan’s Politics
The situation is further complicated by the recent loss of a parliamentary majority by Japan’s ruling Liberal Democratic Party (LDP) in last month’s lower house election. This outcome could force the LDP to form a new coalition, potentially leading to power-sharing agreements that introduce political uncertainty.
Such developments could delay the Bank of Japan's (BOJ) anticipated rate hike, with opposition parties—some of which may become pivotal in coalition negotiations—advocating for a more dovish monetary stance.
Notably, Yuichiro Tamaki, leader of the opposition Democratic Party for the People (DPP), has called for a six-month delay before any further rate hikes.
As a result, the prospects of delayed BOJ tightening, combined with rising US yields driven by the policies of a potential Trump administration, have led to a widening of the interest rate differential between Japan and the US, now at its most pronounced since July. This dynamic has exerted upward pressure on the USD/JPY exchange rate.
The US-Japan 10-year yield spread has increased from its September low, which aligns with the recent rise in the USD/JPY currency pair. ()
Nikkei 225 Outlook & Trading Opportunity:
In our view, we see Trump's election victory as tactically positive for Japanese equities and the Nikkei 225.
The underlying economic fundamentals remain robust, with real wages on a positive growth trajectory. The resurgence of healthy inflation coupled with rising wages could trigger a virtuous cycle of price and wage increases, which would provide a broad economic boost and, by extension, benefit the equity market.
Trump's election victory could also alter the flow of capital into 2 of Asia's largest equity markets. Specifically, as investors adopt a more cautious stance towards potential tariffs on China, we anticipate that funds will increasingly flow into Japan.
We expect the Nikkei 225 to benefit from Trump’s inflationary policies - which could keep US interest rates high, which could in turn strengthen the Dollar and weaken the Yen to the advantage of the Japanese equity market. However, upside could be limited given the risk of a currency intervention by Japanese authorities to stem Yen weakness.
If China's expected stimulus measures fall short of market expectations, we anticipate that investors may rotate their positions out of China and into Japan, a pattern we already observed during the lead-up to China’s previous round of stimulus announcements..
Expressing Our View:
We maintain our previous trade setup:
Long Nikkei 225 Index Futures
Based on a Fibonacci Extension drawn from the October 2023 to the July 2024 high, the daily chart shows the index rebounding from the 5 August low of 31,156; but has since consolidated within 37,700 – 39,500.
If Dollar strength remains, we expect an appreciation in USD/JPY to send the Nikkei 225 Index upwards towards resistance at the 0.786% extension level around 40,500 within the month of November. If breached, we see the next resistance level at around 43,000 – 43,050.
• Entry Level: 39,000
• Target Level: 40,500 (1-Month target)
• Stop Loss Level: 38,500 (trailing stop preferred)
• Profit at Target: 1500 x ¥500= ¥750,000
• Loss at Stop: 500 x ¥500= ¥250,500
• Reward: Risk Ratio: 3x
Trade Nikkei 225 with Phillip Nova now
Long
Hidden Link Between Hedge Funds’ Yen Positions & Nikkei225 TrendBy Eric Lee , Sales Director of Phillip Nova
Tracking the GBP/JPY and Nikkei 225 Relationship for Futures Trading
In my previous analysis of the Nikkei 225, I pointed out its strong correlation with the GBP/JPY currency pair, highlighting it as a key factor for traders to watch when trading Nikkei 225 futures. The Japanese yen’s strength is largely shaped by the monetary policies of the Bank of Japan (BOJ). While these policies can be complex and challenging for everyday investors to grasp, hedge funds, armed with advanced models and PhD-level experts, have a clearer understanding. But what if you could gain insight into the bets hedge funds are making on the Japanese yen? Wouldn’t that be a game changer?
Understanding Hedge Fund Insights on Japanese Yen Through CFTC Reports
Here’s how you can: The Commodity Futures Trading Commission (CFTC), a U.S. regulatory agency overseeing futures markets, mandates that all financial institutions= report their futures positions every Friday. This means hedge funds trading Japanese yen futures on the CME must disclose their positions weekly.
Using Hedge Fund Trends to Anticipate Nikkei 225 and GBP/JPY Movements
Take a look at the COT (Commitment of Traders) chart of CME Japanese yen futures. I’ve highlighted the key trend in purple. This shows the aggregate positions that leveraged funds, or hedge funds, are taking on yen futures. Notice how hedge funds began accumulating yen positions in July, and as of the most recent data, they’re more bullish on the yen than they’ve been in the past three years.
Every Friday, traders should pay attention to the updated COT chart. If hedge funds continue to build long positions in the yen, it’s a strong sign that GBP/JPY may weaken, pushing the Nikkei 225 lower. Conversely, if hedge funds shift toward short positions, GBP/JPY could rise, causing the Nikkei 225 to move higher.
Trade the smallest Nikkei Futures from $400 with Phillip Nova today Navigating volatility in the Nikkei225:Start of a Virtuous CycleBy Danish Lim Zhi Lin, Investment Analyst
Current Performance of Nikkei 225 Index:
As of 9 September, the Nikkei 225 Index was down by -0.48%, after falling as much as 3% as weak US Payroll added to slowdown fears and dampened risk appetite. The Nikkei 225 Index saw a 5th straight decline, with data showing Japan’s Q2 GDP expanded less than expected at 2.9% QoQ, but still advancing enough to keep the BOJ on track to hike rates later this year. At the same time, China CPI and PPI data fell short of forecasts, adding to global growth headwinds that could weigh on Japanese equities.
With the upcoming US elections and Japan’s leadership race, the path ahead for the tech-focused Nikkei 225 Index is likely to see added volatility, even as investors countdown to the Fed’s rate first rate cut in 4 years.
“The Time Has Come”
“The time has come” was a memorable phrase from Chair Powell’s speech at the Jackson Hole Symposium. After several premature bets on Fed rate cuts earlier in the year, it appears that cuts are finally on their way. We expect discussion to shift towards the pace and reason behind Fed rate cuts.
In this backdrop, the Nikkei 225’s performance will largely depend on why rates are moving lower - with equities likely to outperform in a “soft landing”, but underperform in a “hard landing”.
With the US economy likely shifting from expansion into deceleration and a potential recession; and with previously-inflated valuations, a negative economic surprise such as last Friday’s payrolls data can trigger an outsized market reaction towards the downside. In other words, “Bad news will be Bad news” moving forward.
Green Shoots in Japan
However, fundamentals appear unchanged and we are inclined to believe that the recent bout of volatility is tied to weakness in the global economy rather than Japan itself. As mentioned in our previous post , we anticipated the August drawdown to be temporary as we viewed the increase in real wages, the first in 27 months, to be a key catalyst for the realization of a virtuous wage-price cycle that is expected to support consumer spending and boost sentiment. We also expect the BOJ to tread more cautiously regarding monetary policy moving forward, likely resulting in a more stable Yen.
At the same time, the government also presented its view that business investment is showing signs of picking up in its August monthly economic report, upgrading its monthly economic assessment for the first time in 15 months on signs of a consumption recovery.
Corporate reforms and growing shareholder activism have also led to higher dividends, more share buybacks and stronger balance sheets.
Other developments
Japan PM Fumio Kishida stepped down from his position and said he will not seek re-election on 14 August, paving the way for the ruling party to vote on his successor on September 27. A leadership vote in the ruling Liberal Democratic party set for Sept 27 will determine Kishida’s successor. Official campaigning for the LDP race starts on Sept 12, with about 10 candidates expected to run.
Geopolitical risks remain due to the upcoming US elections and potential chip curbs by foreign countries .
Nikkei 225 Outlook & Trading Opportunity:
In our view, we believe recent events have not altered the long-term fundamentals of the Japanese market. Nevertheless, volatility is to be expected with the upcoming US elections and global growth concerns lingering in the background; although we believe the overall trajectory for Japanese equities will be positive.
Alongside Fed rate cuts, a more moderate Yen could be beneficial for Japanese equities by lowering imported inflation and supporting consumer spending. In combination with wage hikes of around 5% expected in 2H, we expect real household income and private consumption to continue trending upwards, providing support to the Nikkei 225 despite a volatile backdrop.
In line with our view, we prefer to take entry on weakness, as we believe it provides an attractive entry point. Near-term volatility could see the Nikkei 225 Index under pressure; but we favour a long position in the long-run with a trailing stop-loss to help limit losses in the event of a sudden market downturn.
Expressing Our View:
We prefer the trade setup below to express our view:
Long Nikkei 225 Index Futures
Based on a Fibonacci Extension drawn from the October 2023 to the July 2024 high, the daily chart shows the index experiencing a brief rebound from the 5 August low of 31,156; but has since broken below the 0.382% extension level at around 37,000 – 37,100. We take this level as immediate resistance.
We expect to near-term volatility to bring the Nikkei 225 Index further down towards the 0.500% extension level around 35,697 – 35,700. We set this level as our entry point with a 5% trailing stop-loss, bringing our stop loss level to around 33,915. Our target level will be the 0.786% extension level around 40,499 – 40,500.
Several technical indicators support our view for near-term volatility:
- The MACD line is shown to have crossed below the signal line in a bearish crossover.
- Prices are below the 50-, 100-, and 200-day moving averages.
Alternatively, traders can consider a short position to take advantage of near-term volatility. But the risk-reward for a long position looks more promising, in our opinion.
We also favour an 5% trailing stop loss to pair with our long position, allowing us to lock in profits if the price moves favourably.
• Entry Level: 35,700
• Target Level: 40,500
• Stop Loss Level: 33,915 (trailing stop preferred)
• Profit at Target: 4800 x ¥500= ¥2,400,000
• Loss at Stop: 1785 x ¥500= ¥892,500
• Reward: Risk Ratio: 2.69x
Trade Nikkei 225 with Phillip Nova now
Long
Navigating the Nikkei 225: A Pivotal Moment for TradersNavigating the Nikkei 225: Key Technical Indicators Suggest a Pivotal Moment for Traders
By Eric Lee , Sales Director of Phillip Nova
The Nikkei 225 index is currently at an inflection point, with several technical indicators pointing to a tug-of-war between buyers and sellers.
Technical Indicators to watch out for:
1. GBP/JPY:
The GBP/JPY currency pair had shown strong correlation to Nikkei225. Given the range-bound nature of both GBP/JPY and Nikkei 225 since August 14, 2024, a breakout in either could signal a similar move in the other.
2. Volume Profile Analysis:
The volume profile indicator for the Nikkei 225 had suggested a resistance zone between 38,000 and 38,500, where trading volume has been concentrated. This suggests that there may be significant selling pressure at these levels.
The next major resistance level is at 40,000, a psychological barrier that has historically acted as a cap on upward movements.
On the downside, a minor support is observed around the 36,000 level, which could serve as a cushion in case of a downturn.
3.Stochastic Oscillator:
The stochastic oscillator is currently hovering in the overbought region, indicating that the index might be due for a correction or at least a pause in its recent upward trajectory. Since the start of 2024, Stochastic at overbought and oversold levels had offered good signals in term of market timing.
Trading Strategy Insights: Preparing for Breakouts or Breakdowns
Traders can consider keeping an eye on the GBP/JPY currency pair, as its movements could provide valuable clues about the next direction for the Nikkei 225. Price action wise, a breakout of Nikkei225 above 38,500 could pave the way toward the 40,000 resistance level, while a breakdown below 38,000 could signal further declines to next support level of 36,000.
Trade Nikkei 225 with Phillip Nova now.
Nikkei rebound inline with expectations- Where Next?By Danish Lim Zhi Lin, Investment Analyst
Current Performance of SGX Nikkei 225:
The Nikkei 225 Index looks to have recovered from a dreadful start to the month where the Nikkei 225 Index plunged -12.40% on a single day on 5 August due to an unfavourable combination of carry trade unwinding, tighter BOJ monetary policy, and US recession fears.
Since then, the index has rallied by over 20%. As mentioned in the previous post , this recovery was in-line with our forecast as we expected the BOJ to tread more carefully regarding monetary policy moving forward.
At the same time, the importance of the increase in real wages, the first in 27 months, cannot
be understated, as we view it as a key ingredient of the long sought-after wage-price cycle that
will support consumer spending and boost sentiment.
Lastly, US recession fears have eased following upbeat retail sales data and CPI readings that met estimates. Markets are now pricing in 100bps of rate cuts by year-end (CME FedWatch Tool).
Japan seeing Green Shoots
Japan Q2 GDP expanded by 3.1% QoQ, well above estimates of 2.3% and a notable increase from the previous reading which showed a decline of -2.3%. Growth was led by private consumption, which rose 1.0% vs estimates of 0.6%. Business spending also rose 0.9% vs estimates of 0.8%.
This fuelled optimism that a virtuous cycle linking rising wages to increased spending may be emerging, helping spur stable demand-led inflation.
Other developments
BOJ deputy governor Shinichi Uchida played down any further chances of a rate hike, stating that recent market moves were “extremely volatile” and that they won’t raise rates when the market is unstable.
Japan PM Fumio Kishida stepped down from his position and said he will not seek re-election on 14 August, paving the way for the ruling party to vote on his successor on September 27. The Yen moved slightly higher following his decision. It appears that the timing of the decision came as a surprise but the decision itself may not have been much of a surprise, given Kishida’s unpopularity and poor public support.
Investors will be watching the leadership change closely and its potential implications on the Yen. Although we believe greater emphasis will be placed on the BOJ’s monetary policy.
Nikkei 225 Outlook & Trading Opportunity:
With the key downside catalysts having eased, we expect markets to re-focus on the medium- to long-term fundamentals that provide support for Japan. Private spending and consumption are likely to continue gaining momentum.
The recent strengthening of the yen may also help soothe consumers’ concerns about imported inflation, with the Yen recently gaining amid expectations for the US-Japan interest rate differential to narrow as the Fed responds to cooling inflation and a slowing job market with rate cuts as early as September.
Expressing Our View:
We maintain our trade setup below to express our view:
Long SGX Nikkei 225 Index Futures
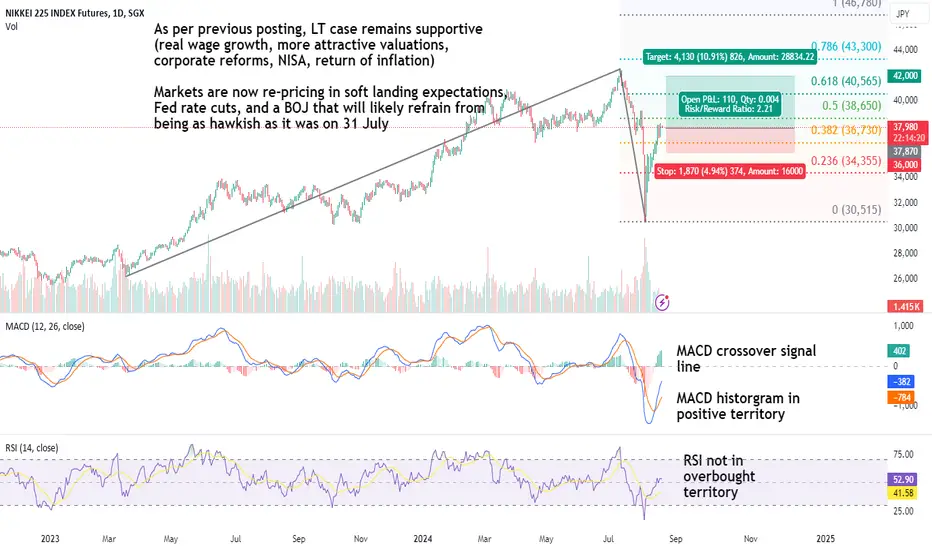
Based on a Fibonacci Extension drawn from the March 2023 low to the July 2024 high, the daily chart shows the contract having bounced back up from the 5 August low of 30,515 to around the 0.500% extension level at 38,185 as of noon on 20 August.
Several technical indicators support our bullish bias:
- The MACD line is shown to have crossed over the signal line.
- The MACD histogram is also in positive territory.
- RSI is not in overbought territory of 70
Entry is set at our previous target price of 37,870.
We see near-term resistance at the 0.500% extension level at 38,650. If this level is breached, the contract could push higher towards the 0.618% extension level at 40,565. We set our target price at 42,000, close to the all-time high set by the index in July 2024.
• Entry Level: 37,870 (Previous target that was hit)
• Target Level: 42,000
• Stop Loss Level: 36,000
• Profit at Target: 3020 x ¥500= ¥2,065,000
• Loss at Stop: 1750 x ¥500= ¥935,000
• Reward: Risk Ratio: 2.21x
Trade Nikkei 225 at only 50 cents* now
Capitalise on the Nikkei 225’s movements—trade SGX Nikkei 225 Index Futures at only 50 cents* now with Phillip Nova.
*For applicable terms and conditions and a full risk disclaimer, please refer to www.phillipnova.com.sg. This ad has not been reviewed by MAS.
Long
Navigating the Nikkei225's VolatilityNavigating the Nikkei225's Volatility: BOJ's Rate Hike, Market Reactions, and Future Implications
By Eric Lee , Sales Director of Phillip Nova
BOJ’s Surprise Rate Hike and the Initial Market Reaction
After Bank of Japan surprised the market by increasing its interest rate by 0.25% on 31 July and BOJ Gov. Kazuo Ueda said at a news conference then of the possibility of further rate hikes, it sent Nikkei225 into a sharp dive, falling 8000 over points in less than a week.
Compounding Factors: U.S. Employment Data and Middle-East Tensions
To be fair, a confluence of other factors such as bad U.S. employment data and fear of Middle East conflict expanding into a full-out war between Iran and Israel, probably added fuel to the sharp decline. Yet, BOJ got the bad press for it as the rapid unwinding of Yen carry trades caused a selling down in the global markets as well as investors fled to safe haven assets such as bonds and gold.
www.reuters.com
The Yen Carry Trade Unwinds: A Global Market Phenomenon
In a turn of events, BOJ Deputy Gov. Shinichi Uchida, in contrast to Ueda’s hawkish comments the previous week, then assured the market that they will not be hiking rates when market is unstable. Since then, Nikkei225 rebounded to the current level of 36,000.`
Nevertheless, the can of worms had been opened, and market had woken up to their complacency of the Yen carry trade problem, and in view of the expectation of rate cut by Fed in September, global investors may make use of the rebound to continue unwind their carry trades, which may add some selling pressure in Nikkei225 and GBP/JPY.
Looking Ahead: Potential Continued Pressure on Nikkei225 and GBP/JPY
In my previous post, I’ve introduced referring to GBP/JPY as a proxy on the strength of Nikkei225 due to their correlation. From the attached 4-hourly chart of Nikkei225, we can determine that the resistance levels are around 38000 and 41000, based on the concentration of trades done around those levels, as highlighted by Volume Profile indicator.
Short-term traders can refer to MACD indicator and GBP/JPY to signal them on the possible change of trends on the 4-hourly chart.
Trade Nikkei 225 at only 50 cents* now
Long
Navigating Volatility in Japan; LT Fundamentals UnchangedBy Danish Lim Zhi Lin, Investment Analyst
Current Performance of SGX Nikkei 225:
The Nikkei 225 Index plunged -12.40% on 5 August, its steepest single-day decline since 1987. Investors fled equities as a stronger yen hammered export stocks, tighter monetary policy led to an unwinding of carry trades, US recession fears, and a rotation out of Tech amid “AI bubble” concerns.
While the decline was broad, Tech was particularly hard hit, with stalwarts like Softbank Group (-18.66%) and Tokyo Electron (-18.48%) down by nearly 20%. This is important as Tech has roughly a 49% weightage in the Nikkei 225 index, meaning a decline in Tech has an outsized effect on the index.
Nevertheless, the index rebounded on 6 August. The SGX Nikkei 225 Index Futures contract rallied by 9.21%. We attribute this rebound to strong overnight US Services data that provided comfort economic growth could hold, easing recession fears.
Thus, it seems apparent that US recession fears will take center stage moving forwards
Dovish BOJ
On 7 August, the SGX Nikkei 225 Index closed up by 1.19% as BOJ deputy governor Shinichi Uchida sent a dovish signal to markets, likely with the intention of stemming panic selling. He stated that recent market moves were “extremely volatile” and that they won’t raise rate when the market is unstable. Uchida added that the US economy is likely to have a soft landing and that the rate trajectory will shift if market moves affect the overall.
Currency stability, US recession, and market volatility, are all key factors that will determine the path ahead for Japanese equities. The BOJ will likely proceed with more caution for future rate decisions.
Unwinding of Carry Trades
The elephant in the room is the ongoing unwinding of carry trades. A carry trade typically involves borrowing the lower-yielding yen and investing that borrowed money into higher yielding assets.
Because of the BOJ’s recent rate hike which led to yen appreciation, and the potential for more rate cuts by the Fed due to recession fears, carry returns have seen a decline as interest rate differentials narrow.
As carry trades get liquidated, traders will have to buy back yen to repay loans taken to fund the carry trade, traders may also sell off assets, including stocks, to cover their positions.
Positives
On the bright side, recent data showed an increase in real wages for the first time in 27 months. This could have contributed to the rebound in Japanese equities as traders saw hope that a virtuous wage-price cycle could emerge to support consumer spending and sentiment.
Japanese households have also poured 7.5 trillion yen ($52b) of funds into new tax-free investment accounts called NISA during 1H 2024, according to Japan Securities Dealers Association. Should costs ease and real wages continue to grow, we expect domestic demand recovery to be the next key growth catalyst for Japanese equities.
However, over the coming months, until recession fears recede and USD/JPY stabilizes, Japanese equity momentum could be limited due to the re-pricing of recession risks and the unwinding of carry trades.
Nikkei 225 Outlook & Trading Opportunity:
Volatility is likely to remain elevated due to the unwinding of carry trades and US recession fears which we believe are in the process of being priced-in.
With the selloff bringing prices back down to more reasonable levels, we could see dip-buying provide temporary support to the market.
Expressing Our View:
We maintain our trade setup below to express our view:
Long SGX Nikkei 225 Index Futures
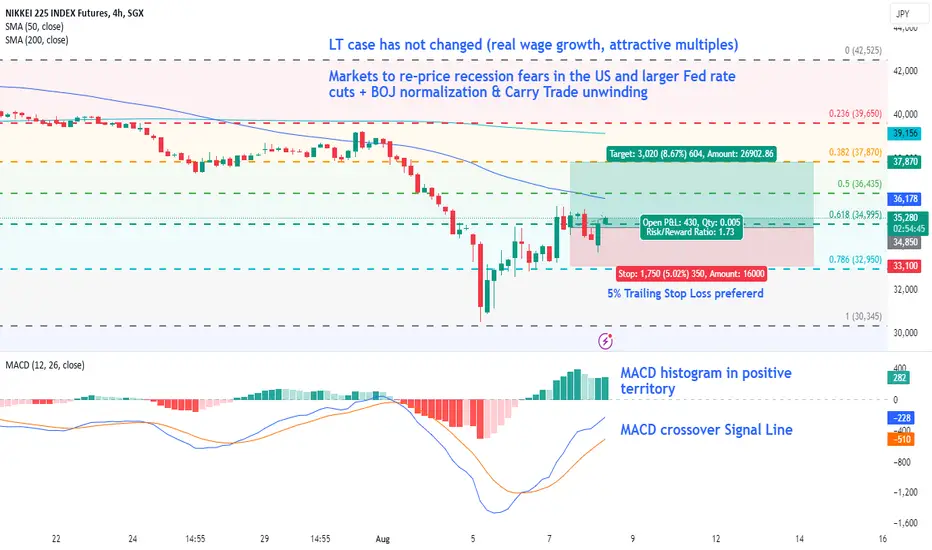
Based on a Fibonacci Retracement drawn from the October 2023 low to the July high, the 4 hourly chart shows the contract having broken below the 0.786% retracement level before bouncing back to around the 0.618% level at around 35,000 as of market close on 7 August. Based on the Moving Average Convergence Divergence Indicator (MACD), we maintain a long bias on the contract as:
- The MACD line is shown to have crossed over the signal line.
- The MACD histogram is also in positive territory.
Entry is set at assumed market price of 34,850, although we prefer to enter on dips. We favour a 5% trailing stop loss to protect gains and limit losses amid elevated volatility. This brings us to a trailing stop at ~33,100 (roughly 5% below market price).
We see near-term resistance near the 50-day moving average and 0.500% retracement level at 36,435. If this level is breached, the contract could push higher to the 0.382% retracement level at near 37,870.
• Entry Level: 34,850 (Market)
• Target Level: 37,870
• Stop Loss Level: 5% Trailing Stop loss at 33,100
• Profit at Target: 3020 x ¥500= ¥1,510,000
• Loss at Stop: 1750 x ¥500= ¥870,000
• Reward: Risk Ratio: 1.73x
Trade Nikkei 225 at only 50 cents* now
Capitalise on the Nikkei 225’s movements—trade SGX Nikkei 225 Index Futures at only 50 cents* now and stand to win a pair of air tickets to Japan. Learn more here .
*For applicable terms and conditions and a full risk disclaimer, please refer to www.phillipnova.com.sg. This ad has not been reviewed by MAS
Long
Navigating the Key Technical Levels and Upcoming BOJ DecisionBy Eric Lee , Sales Director from Phillip Nova
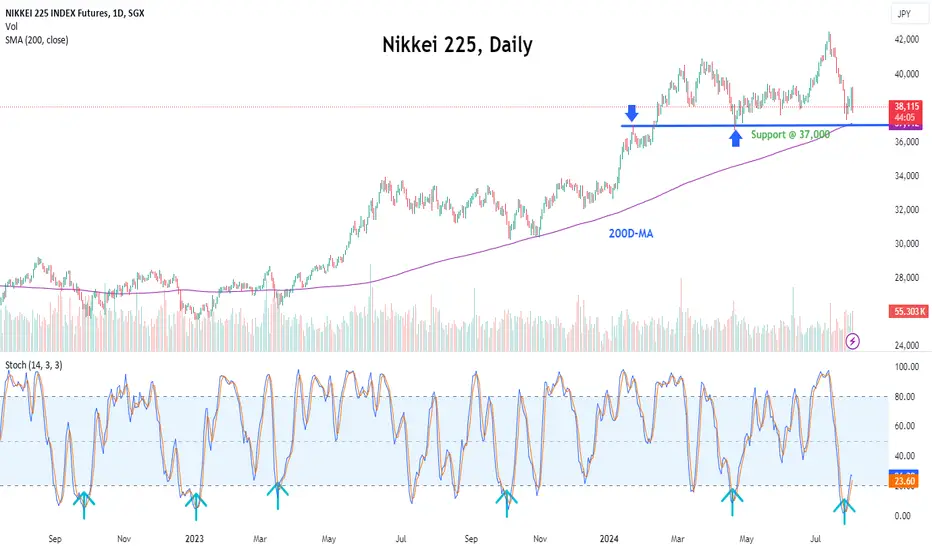
The Nikkei 225 index is currently trading near its 200-day moving average (200D-MA), a crucial technical indicator that often signifies long-term market trends. At the same time, the index is hovering around the 37,000 level, a significant support that has held firm multiple times in the past.
Technical Indicators:
1. 200-Day Moving Average (200D-MA):
The 200D-MA is trending upwards, underscoring a long-term bullish sentiment.
The index's proximity to this moving average suggests it is at a critical juncture where historical trends show potential for support.
2. Support at 37,000:
The 37,000 level has acted as a robust support point, providing a floor during previous price corrections.
This level coinciding with the 200D-MA enhances its significance as a potential stronghold for the index.
3. Stochastic Oscillator:
Currently, the stochastic oscillator is in oversold territory (below 20).
Historically, when the stochastic oscillator is oversold and the index is near the 200D-MA, it has often indicated strong support, leading to subsequent price rallies.
Impact of the Bank of Japan’s Policy Decision
A potential catalyst that could influence the Nikkei 225’s movement is the upcoming policy decision by the Bank of Japan (BOJ). The BOJ is considering raising interest rates to 0.25%, a move that could significantly impact market sentiment. Investors should closely monitor the BOJ's announcements, as changes in interest rates can lead to increased market volatility and affect the index's performance. (asia.nikkei.com)
Trade Nikkei 225 at only 50 cents* now
Capitalise on the Nikkei 225’s movements—trade SGX Nikkei 225 Index Futures at only 50 cents* now and stand to win a pair of air tickets to Japan. Learn more here .
*For applicable terms and conditions and a full risk disclaimer, please refer to www.phillipnova.com.sg. This ad has not been reviewed by MAS
Long
Tech Rotation Presents a Buying Opportunity for the Nikkei 225By Danish Lim Zhi Lin, Investment Analyst
Current Performance of SGX Nikkei 225
As of 22 July, the SGX Nikkei 225 September contract has slipped below the 40,000 level, hovering around 39,710 at around 11:04 SGT.
Much of the decline can be attributed to a stock rotation out of Tech and into cyclicals and small caps across the globe. Semiconductors & Semiconductor Equipment Makers, in particular, saw a rout after an explosive first half.
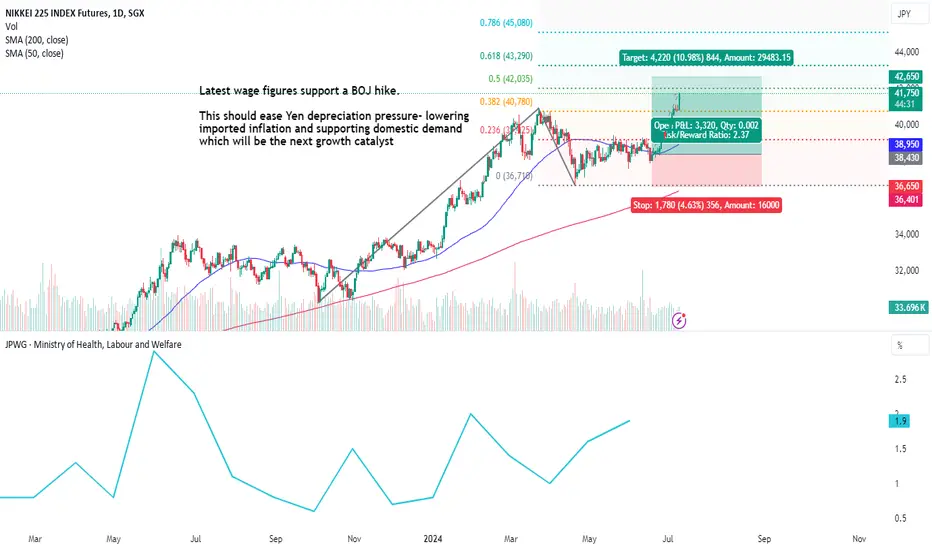
Nevertheless, we believe the direction forward appears to be aligning with our previous forecast of upcoming BOJ rate hikes and Fed rate cuts to translate into an eventual easing of yen depreciation pressure- supporting equity outperformance.
We maintain our price target range of 42,00 – 43,300, with a midpoint target at around 42,650.
Latest Developments
The tech rotation was kick started by US CPI data which came in lower than expected, as well as unemployment figures which were higher than expected. The readings essentially cemented a September rate cut, with Fed fund futures pricing in a 91.7% probability for a September cut. US Treasury yields tumbled, resulting in a weaker Dollar that helped ease Yen depreciation pressure.
Hawkish BOJ
Meanwhile, in Japan, calls for another rate hike increased after National Core CPI data for June came in higher than expected.
There was also a suspected intervention by the BOJ following the release of the softer than expected US CPI figures. On 11 July, the USDJPY currency pair plunged from 161.69 to as low as 157.44 in a little over half an hour, gaining more than 2% against the Dollar and prompting speculation that the BOJ had intervened in the market.
Regarding the suspected intervention, Chief currency official Masato Kanda said that he’s “not in a position” to comment on whether Japan had intervened and that “our practice is basically not to say whether we have intervened or not”.
Kanda also mentioned that “many see moves as one-sided, not matching fundamentals”, and that the BOJ doesn’t “see forex moves as stable”. Crucially he also spoke about the adverse impact of the weak yen on people’s livelihoods- as higher imported inflation resulted in a higher cost of living.
We interpret his comments as hawkish tilt for the BOJ. With the path of least resistance pointing to a rate hike in the coming months. Kanda mentioned that the BOJ will disclose at month-end if intervention was conducted.
Path Ahead
Going forward, we maintain our call for upcoming Fed cuts and BOJ rate hikes to eventually normalize Yen depreciation pressure. Dollar strength will ease while Yen will see a boost from rate hikes, easing Yen weakness and boosting domestic spending that should translate into improved performance for domestic-demand stocks. We believe this could offset waning momentum in Tech and serve as the next growth catalyst for Japanese equities.
We keep an eye out for real wages to turn positive, which could occur in the coming months once annual wage hikes are more fully reflected in the data. Should costs ease and wages continue to grow, we expect to domestic demand recovery to be the next key growth catalyst for Japanese equities.
We maintain our price target range of 42,000 – 43,300, with a midpoint target at around 42,650.
Nikkei 225 Outlook & Trading Opportunity:
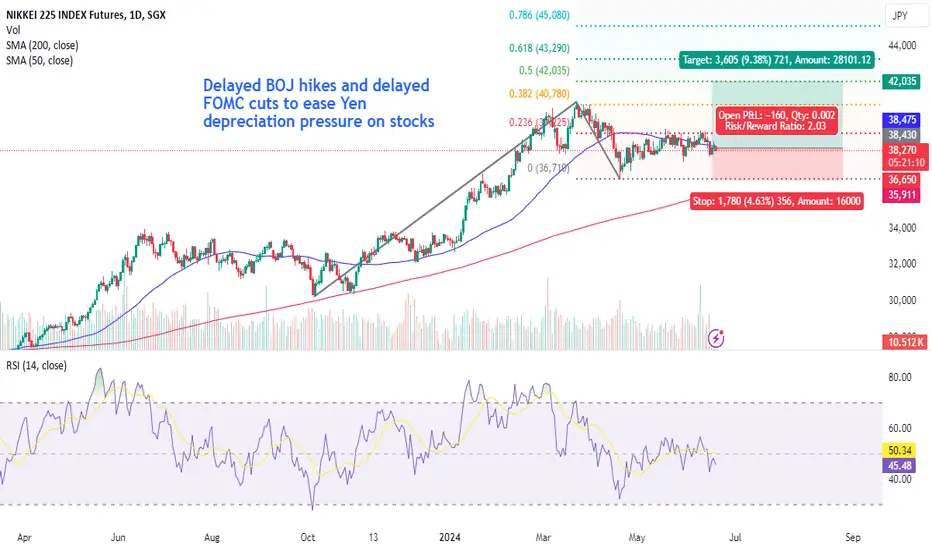
In our opinion, we expect BOJ rate hikes and delayed FOMC rate cuts to eventually translate into an eventual easing of yen depreciation pressure.
This will support a Yen rebound to more comfortable levels- easing imported inflation and supporting consumer spending. We expect this to enable Japanese equities to sustainably outperform in 2H 2024. Corporate governance reforms should provide support for Japanese equities over the medium to long term.
We see any near-term weakness or pullback as an entry opportunity.
Expressing Our View:
We maintain our trade setup below to express our view:
Long SGX Nikkei 225 Index Futures
The daily chart shows the contract having slipped below the key 40,000 level and hovering near the 0.236% Fibonacci extension level around 39,225.
With a Trend-based Fibonacci Extension drawn from the October 2023 low, we set our target range between the 0.50% extension level around 42,000, and the 0.618% extension level around 43,300. Stop loss is set below the key support level at 36,650. This setup delivers a reward: risk ratio of 2.37x.
• Entry Level: 38,430 (previous entry level)
• Target Level: 42,650
• Stop Loss Level: 36,650
• Profit at Target: 3620 x ¥500= ¥2,110,000
• Loss at Stop: 1780 x ¥500= ¥890,000
• Reward: Risk Ratio: 2.37x
Trade Nikkei 225 at only 50 cents* now
Capitalise on the Nikkei 225’s movements—trade SGX Nikkei 225 Index Futures at only 50 cents* now and stand to win a pair of air tickets to Japan. Learn more here .
*For applicable terms and conditions and a full risk disclaimer, please refer to www.phillipnova.com.sg. This ad has not been reviewed by MAS
Long
Analytical Perspective on Correlation between Nikkei225 & GBPBy Eric Lee , Sales Director of Phillip Nova
Substantial Upward Trends in GBP/JPY and Nikkei 225 from 2020 to 2024
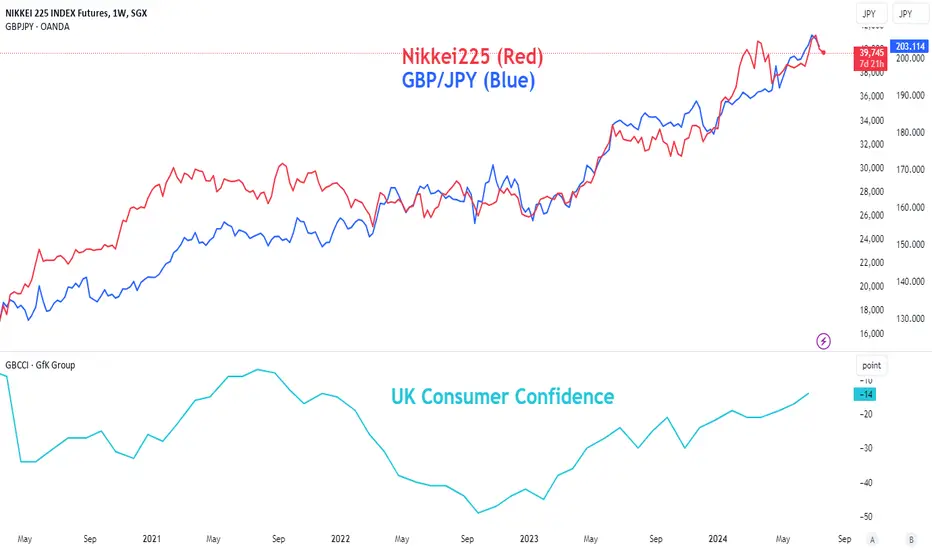
Over the past 4 years, from 2020 to 2024, both the GBP/JPY exchange rate and the Nikkei 225 index have shown substantial upward trends. The chart below indicates a close correlation between these two financial indicators, particularly from late 2022 to mid2024. The GBP/JPY (in blue) and the Nikkei 225 (in red) have both risen significantly over the observed period, with the Nikkei 225 reaching a recent peak around 40,500 and the GBP/JPY exchange rate climbing to approximately 203.886
Strong Correlation Between GBP/JPY and Nikkei 225 Movements
There are notable periods where the movements of the GBP/JPY and the Nikkei 225 are closely aligned, suggesting a strong correlation between the two. This is particularly evident from late 2022 onwards, where both indices exhibit synchronized peaks and troughs. The Nikkei 225 has experienced periods of high volatility, with sharp rises and falls, particularly in 2023. According to Nikkei Asia, one significant factor contributing to the rise in Japanese stocks is the influx of foreign investment, notably $51 billion led by the U.K. This influx has boosted the Nikkei 225, highlighting the importance of foreign capital in driving market performance
asia.nikkei.com
Impact of GBP/JPY Exchange Rate on Japanese Equity Investments
A strong GBP/JPY rate can indicate increased purchasing power for British investors, enabling them to invest more heavily in Japanese equities. The recent surge in the Nikkei 225 aligns with the period of increased foreign investment, as highlighted by the $51 billion influx led by U.K. investors. Currency strength often reflects broader economic sentiment. A rising GBP/JPY rate can signal confidence in the U.K. economy, encouraging investment in higher-yielding assets like Japanese stocks. Conversely, a weaker JPY can make Japanese exports more competitive, boosting corporate profits and positively impacting the Nikkei 225. Fluctuations in the GBP/JPY rate can influence global risk appetite. A stronger GBP against the JPY might indicate a shift towards riskier assets, including equities in robust markets like Japan
UK Consumer Confidence and Its Correlation to GBP and Nikkei 225
According to data from GfK, the Consumer Confidence indicator in the UK rose to -14 in June 2024 from -17 in May, marking the third consecutive month of improvement and reaching its highest level since November 2021, surpassing forecasts of -16. That may explain the strength in GBP and its correlation to Nikkei225 as well.
Global Financial Interconnectivity and Strategic Insights for Traders
In conclusion, the global financial market is highly interconnected. The influx of foreign capital, particularly from U.K., has significantly boosted Japanese stocks, driving Nikkei225 to new heights. Thus, when trading a stock index such as Nikkei225, traders should consider the influence of currency movements and the dynamics the economic performance of related countries can have in providing valuable insights in their strategic decision making
Trade Nikkei 225 at only 50 cents* now
Capitalise on the Nikkei 225’s movements—trade SGX Nikkei 225 Index Futures at only 50 cents* now and stand to win a pair of air tickets to Japan. Learn more here .
*For applicable terms and conditions and a full risk disclaimer, please refer to www.phillipnova.com.sg. This ad has not been reviewed by the MAS Analytical Perspective on Correlation Between Nikkei225 & GBPBy Eric Lee , Sales Director of Phillip Nova
Substantial Upward Trends in GBP/JPY and Nikkei 225 from 2020 to 2024
Over the past 4 years, from 2020 to 2024, both the GBP/JPY exchange rate and the Nikkei
225 index have shown substantial upward trends. The chart below indicates a close
correlation between these two financial indicators, particularly from late 2022 to mid2024. The GBP/JPY (in blue) and the Nikkei 225 (in red) have both risen significantly over
the observed period, with the Nikkei 225 reaching a recent peak around 40,500 and the
GBP/JPY exchange rate climbing to approximately 203.886.
Strong Correlation Between GBP/JPY and Nikkei 225 Movements
There are notable periods where the movements of the GBP/JPY and the Nikkei 225 are
closely aligned, suggesting a strong correlation between the two. This is particularly
evident from late 2022 onwards, where both indices exhibit synchronized peaks and
troughs. The Nikkei 225 has experienced periods of high volatility, with sharp rises and
falls, particularly in 2023. According to Nikkei Asia, one significant factor contributing to
the rise in Japanese stocks is the influx of foreign investment, notably $51 billion led by
the U.K. This influx has boosted the Nikkei 225, highlighting the importance of foreign
capital in driving market performance
asia.nikkei.com
Impact of GBP/JPY Exchange Rate on Japanese Equity Investments
A strong GBP/JPY rate can indicate increased purchasing power for British investors,
enabling them to invest more heavily in Japanese equities. The recent surge in the Nikkei
225 aligns with the period of increased foreign investment, as highlighted by the $51
billion influx led by U.K. investors. Currency strength often reflects broader economic
sentiment. A rising GBP/JPY rate can signal confidence in the U.K. economy,
encouraging investment in higher-yielding assets like Japanese stocks. Conversely, a
weaker JPY can make Japanese exports more competitive, boosting corporate profits
and positively impacting the Nikkei 225. Fluctuations in the GBP/JPY rate can influence
global risk appetite. A stronger GBP against the JPY might indicate a shift towards riskier
assets, including equities in robust markets like Japan.
UK Consumer Confidence and Its Correlation to GBP and Nikkei 225
According to data from GfK, the Consumer Confidence indicator in the UK rose to -14 in
June 2024 from -17 in May, marking the third consecutive month of improvement and
reaching its highest level since November 2021, surpassing forecasts of -16. That may
explain the strength in GBP and its correlation to Nikkei225 as well.
Global Financial Interconnectivity and Strategic Insights for Traders
In conclusion, the global financial market is highly interconnected. The influx of foreign
capital, particularly from U.K., has significantly boosted Japanese stocks, driving
Nikkei225 to new heights. Thus, when trading a stock index such as Nikkei225, traders
should consider the influence of currency movements and the dynamics the economic
performance of related countries can have in providing valuable insights in their
strategic decision making
Trade Nikkei 225 at only 50 cents* now
Capitalise on the Nikkei 225’s movements—trade SGX Nikkei 225 Index Futures at only
50 cents* now and stand to win a pair of air tickets to Japan. Learn more here .
*For applicable terms and conditions and a full risk disclaimer, please refer to
www.phillipnova.com.sg. This ad has not been reviewed by the MAS Nikkei 225 Breaches 41,000- Where Next?By Danish Lim Zhi Lin, Investment Analyst
Current Performance of SGX Nikkei 225:
As of 9 July, the SGX Nikkei 225 September contract briefly topped the 41,000 level, gaining 1.32% as of 11:01 SGT. The movements tracked overnight gains in US semiconductor shares, as investors remain optimistic ahead of Powell's semi-annual testimony to congress and inflation readings later this week.
As of 10:35 SGT, gains were led by Fujikura Ltd (+11.66%), Tokyo Electron (+3.88%), Advantest (3.17%). This comes ahead of TSMC's earnings results next week, where it is widely expected to post an earnings beat and raise guidance.
We maintain our previous thesis of BOJ rate hikes and delayed FOMC rate cuts to translate into an eventual easing of yen depreciation pressure- supporting equity outperformance. We update our price target to a range of 42,00 – 43,300, reflecting updated information. This puts our target price at the midpoint of the range at around 42,650.
BOJ Hike in the Cards:
Government data released Monday showed that Japanese workers saw their average base pay climb 2.5% YoY in in May, the fastest pace in 31 years; and higher than the headline figure which grew 1.9%. Overtime wages, a leading indicator of labour demand, grew by 2.3% YoY.
This comes as this year’s “shunto” wage negotiation was able to secure an average wage increase of 5.1%, the largest since 1991.
However, on an inflation-adjusted basis, real wages continue to lag behind inflation, as real cash earnings fell by -1.4%, in negative territory for the 26th straight month. We believe falling real wages further highlights the need for the BOJ to tighten monetary policy.
At the same time, the BOJ’s June Tankan Survey indicated that corporate sentiment improved, with all-firms current sentiment index unchanged at 12, while the forecast index ticked up to 10 from 9 in March. Sentiment among both manufacturers and non-manufacturers also improved.
Thus, we believe the improvement in wages will give the BOJ confidence that the wage-price cycle they seek could be emerging, giving room for the BOJ to normalize policy. This could help ease yen depreciation pressure- which has weighed on consumer sentiment and spending due to higher imported inflation.
We keep an eye out for real wages to turn positive, which could occur in the coming months once annual wage hikes are more fully reflected in the data. The BOJ said it forecasts private consumption to recover in the coming months after 4 quarters of decline, underpinning an economic recovery.
Should costs ease and wages continue to grow, we expect to domestic demand recovery to be the next key growth catalyst for Japanese equities.
Nikkei 225 Outlook & Trading Opportunity:
In our opinion, we expect BOJ rate hikes and delayed FOMC rate cuts to eventually translate into an eventual easing of yen depreciation pressure.
This will support a Yen rebound to more comfortable levels- easing imported inflation and supporting consumer spending. We expect this to enable Japanese equities to sustainably outperform in 2H 2024. Corporate governance reforms should provide support for Japanese equities over the medium to long term.
We see any near-term weakness or pullback as an entry opportunity.
Expressing Our View:
We maintain our trade setup below to express our view:
Long SGX Nikkei 225 Index Futures:
The daily chart shows the contract having broken above the 0.382% Fibonacci extension level and has been hovering around psychological resistance at 41,000.
With a Trend-based Fibonacci Extension drawn from the October 2023 low, we set our target range between the 0.50% extension level around 42,000, and the 0.618% extension level around 43,300. Stop loss is set below the key support level at 36,650. This setup delivers a reward: risk ratio of 2.37x.
•Entry Level: 38,430 (previous entry level)
• Target Level: 42,650
• Stop Loss Level: 36,650
• Profit at Target: 3620 x ¥500= ¥2,110,000
• Loss at Stop: 1780 x ¥500= ¥890,000
• Reward: Risk Ratio: 2.37x
Trade Nikkei 225 at only 50 cents* now
Capitalise on the Nikkei 225’s movements—trade SGX Nikkei 225 Index Futures at only 50 cents* now and stand to win a pair of air tickets to Japan. Learn more here .
*For applicable terms and conditions and a full risk disclaimer, please refer to www.phillipnova.com.sg. This ad has not been reviewed by MAS
Long
Impact of Japan’s Largest Pay Raise on Nikkei 225Impact of Japan’s Largest Pay Raise on Nikkei 225: Market Insights & Trading Ideas
Historic Pay Raise Boosts Japanese Economy
By Eric Lee , Sales Director from Phillip Nova
On March 22nd, Japan’s largest union group, Rengo, announced that Japanese firms have
agreed to raise salary by 5.25% this year. This is the biggest raise the country had seen
since 2013 . Given that Personal Consumption constituted 55% of Japan’s GDP, the pay
raise is deemed to be positive for the economy and stock market as well.
Source
Correlation Between Disposable Income and Nikkei 225
Attached is the monthly chart comparing the performance of Nikkei 225 (in blue) with
the 12-Months Average of Japan’s Disposable Personal Income since 1996. Their
correlation explained the impact having higher disposable income had on the stock
prices.
Since its bottom in December 2023, the 12-Month Average Disposable Personal Income
had been rising. Market should expect this to rise further with the announcement of
higher salary by the union group
Nikkei 225 Breaks Above Symmetrical Triangle Formation
On a short-term basis, Nikkei 225 had broken above the Symmetrical Triangle formation
it’s been in since April. Based on Classical Technical Analysis technique, we can set the
target level for such formation at 42,700 and the cut-loss level at below the triangle
formation which is at 37,900 at the moment.
Trade Nikkei 225 at only 50 cents* now
Capitalise on the Nikkei 225’s movements— trade SGX Nikkei 225 Index Futures at
only 50 cents* now and stand to win a pair of air tickets to Japan . Learn
more here
Long
Bullish SGX Nikkei 225 Futures on delayed BOJ hike and Fed cutBy Danish Lim Zhi Lin, Investment Analyst
Current Performance of SGX Nikkei 225:
As of 26 June, at 10:40 SGT, the SGX Nikkei 225 Index Futures contract was up by 1.52%, led by
semiconductor-related stocks Tokyo Electron and Advantest. Sumitomo Pharma surged following
reports it is considering layoffs and a new plant. This would mark the 3rd consecutively daily gain, underpinned by dip-buying activity following a weak April (-5.03%) and May (-0.05%).
Based on our technical target levels, the contract looks to have breached immediate resistance at around 39,225. We believe this puts it on track to hit our target level at around 42,050 by end-2024.
Continued Yen Depreciation:
As of 27 June, the Yen has continued to depreciate, weakening to almost 160.9 per Dollar, the lowest level since 1986, ramping up intervention risks by the BOJ. Top currency official Masato Kanda reiterated that the government will take appropriate measures if there are excessive currency moves.
This comes as last week’s CPI ex fresh food reading rose by 2.5% YoY in May, up from 2.2% in April. We believe the reading gives room for the BOJ to consider hiking rates in the coming months. However, the Yen continues to depreciate due to its interest rate gulf with the US, further exacerbated by the timing of Fed rate cuts being pushed back later into the year.
Although a weaker yen has traditionally benefitted exporters, we believe yen weakness has gone too far and has resulted in higher imported inflation, eroding consumers’ purchasing power. Our research shows the correlation between the Nikkei 225 and USDJPY started turning flat once USDJPY went past 155.
Corporates have cited levels around 120-130 against the USD to be “preferable”. As such, we believe a sustainable equity rebound would require further easing of yen weakness.
Nikkei 225 Outlook & Trading Opportunity:
In our opinion, we expect delayed BOJ rate hikes and delayed FOMC rate cuts to eventually translate into an eventual easing of yen depreciation pressure.
This will support a Yen rebound to more comfortable levels- enabling Japanese equities to sustainably outperform in 2H 2024. Corporate governance reforms should provide support for Japanese equities over the medium to long term.
We see any near-term weakness or pullback as an entry opportunity.
Expressing Our View:
We maintain our trade setup below to express our view:
Long SGX Nikkei 225 Index Futures
The daily chart shows the contract having broken above the 0.236% Fibonacci extension level and is headed towards the 0.382% extension level at around 40,780.
With a Trend-based Fibonacci Extension drawn from the October 2023 low, we set our target level at the 0.50% extension level around 42,050. Stop loss is set below the key support level at 36,650.
This setup delivers a reward: risk ratio of 2.03x.
• Entry Level: 38,430 (previous entry level)
• Target Level: 42,050
• Stop Loss Level: 36,650
• Profit at Target: 3620 x ¥500= ¥1,810,000
• Loss at Stop: 1780 x ¥500= ¥890,000
• Reward: Risk Ratio: 2.03x
Trade Nikkei 225 at only 50 cents* now
Ride the waves of the Nikkei 225—trade SGX Nikkei 225 Index Futures for as low as 50 cents* and you could win a pair of air tickets to Japan. Discover more here.
*For applicable terms and conditions and a full risk disclaimer, please refer to
www.phillipnova.com.sg. This ad has not been reviewed by MA
Long
Has Japan’s Stock Market Peaked? Buy on DipsBy Danish Lim Zhi Lin, Investment Analyst
Current Performance of SGX Nikkei 225:
The SGX Nikkei 225 Index Futures contract underperformed in April (-5.03%) and was nearly flat in May (-0.05%) as the rise in 10-year JGB yields following the BOJ’s March and May meetings weighed on semiconductor names and other growth stocks.
Impact of Yen Depreciation:
However, despite rising yields, due to interest rate differentials and carry trades, the Yen continued to depreciate against the Dollar. Although a depreciating currency previously helped the Nikkei 225 climb to new record highs, it has also resulted in higher imported inflation, weighing on companies including retailers and railway operators that rely on domestic spending.
A survey conducted by Teikoku Databank on May 17 reported that about 64% of firms surveyed said the recent depreciation of the yen has eroded their profits.
Nikkei 225 Outlook & Trading Opportunity:
In our opinion, yen depreciation, once a key growth driver, now exerts downward pressure on the stock market. We note that the correlation between a weaker yen and stronger stock prices started turning flat once the yen depreciated past ¥155/$.
Nevertheless, we anticipate delayed BOJ rate hikes and delayed FOMC rate cuts to translate into an easing of yen depreciation pressure- supporting a Yen rebound and enabling Japanese equities to outperform in 2H 2024. Corporate governance reforms should provide support for Japanese equities over the medium to long term.
We see any near-term weakness or pullback as an entry opportunity.
Expressing Our View:
We favor the hypothetical trade setup below to express our view:
Long SGX Nikkei 225 Index Futures
The daily chart shows the contract consolidating around the 38,000 – 39,500 level.
With a Trend-based Fibonacci Extension drawn from the October 2023 low, we prefer to take entry at around 38,430, as we view current weakness as an entry opportunity. The 14-day RSI indicates that the contract is currently not at overbought levels.
We set our target level at the 0.50% extension level around 42,035. Stop loss is set below the key support level at 36,650. This setup delivers a reward: risk ratio of 2.03x.
• Entry Level: 38,430
• Target Level: 42,050
• Stop Loss Level: 36,650
• Profit at Target: 3620 x ¥500= ¥1,810,000
• Loss at Stop: 1780 x ¥500= ¥890,000
• Reward: Risk Ratio: 2.03x
Trade Nikkei 225 at only 50 cents* now
Capitalise on the Nikkei 225’s movements—trade SGX Nikkei 225 Index Futures at only 50 cents* now and stand to win a pair of air tickets to Japan. Learn more here .
*For applicable terms and conditions and a full risk disclaimer, please refer to www.phillipnova.com.sg. This ad has not been reviewed by MAS
Long
Analysing the Nikkei 225: Insights from the 50D-Moving AverageBy Eric Lee , Sales Director from Phillip Nova
50-day Moving Average and Historical Scenario
The 50-day moving average often serves as a key consolidation level for the Nikkei 225.
Historically, after significant up or down movements, the index tends to consolidate around
this average before resuming its trend. A notable example occurred between mid-July and
mid-November 2023. Following a rise from 26,000 to 34,000 points from mid-March to midJune 2023, the index consolidated around the 50-day moving average for 5.5 months before
breaking out and continuing its uptrend.
Current Market Performance
Currently, since early April, the Nikkei 225 has been oscillating along the 50-day moving
average. The suggested resistance level is at 39,460 points. A break above this level could
indicate a resumption of the uptrend. Conversely, if the index falls below 36,700 points, it
would be prudent to exit positions as this level serves as a cut-loss point. Monitoring these
levels can help in making informed trading decisions.
Trade Nikkei 225 at only 50 cents* now
Capitalising on the Nikkei 225’s movements— trade SGX Nikkei 225 Index Futures at only
50 cents* now and stand to win a pair of air tickets to Japan . Learn more here .
*For applicable terms and conditions and a full risk disclaimer, please refer to
www.phillipnova.com.sg. This ad has not been reviewed by MAS Weekly Analysis: USDJPY Bullish on Ascending Triangle BreakoutOn weekly chart, the USDJPY continues soaring after a bullish breakout from a long term ascending triangle formed since 2022. The bullish breakout occurred on 10th of April when the pair decisively pierced above the 152 resistance zone, and the breakout with an upside target of 176 (measured by triangles height) remains valid as the subsequent weeks continued closing higher beyond 152.
While BOJ had already exited from its negative interest rates policy, the interest rates differential between USD and JPY remains jarringly wide. The movement of USDJPY is largely dependent of the USD strength, with recent sticky inflation data, the Fed is expected to push back on its interest rates cut, which means that the yield spread in USDJPY is to remain higher for longer, favoring the greenback against the yen. In the short term however, given the sharp and rapid depreciation of the yen, traders should be cautious of a potential FX intervention by the BOJ, which would trigger a whipsaw (suspected to have taken place on 29 April after the sharp spike to 160). In the intermediate term, the fundamentals are aligned for further appreciation of the USDJPY pair.
This broad uptrend in the USDJPY offers short-term traders opportunities to capitalize on short-term price swings by aligning their trades with the overall bullish momentum. They can use technical analysis tools to identify entry and exit points within the uptrend, potentially profiting from smaller price movements. Green Bull Flag in FCPO From a technical standpoint, prices have consolidated into a bull flag consolidation pattern since 14 March, breaking out of the flag resistance (orange trend channel) yesterday, albeit with normal volume. This localised breakout coupled with the breakout of the long-term parabolic bowl accumulation pattern at 4,150, a pattern forming since July 2023, signalled a possible continuation of the bullish climb to retest 4350 levels.
Fibonacci retracements can be seen respected at 61%, 50% and 38% respectively. Immediate support is foreseen around the 4,200 levels, a zone created from a combination of both 50% fibo and the high from previous surge – green line support.
Sustained prices above the bull flag pattern for the next two days are likely to drive further upward movement, aiming to breach the 4,350 level and potentially reaching 4,500 levels. This upward momentum may be fueled by short liquidations and breakout buys. Conversely, a drop below the 4,150 level could prompt a retreat towards the crucial support level of 4,000.
Regarding correlated edible oils, technical indicators for CBOT soyoil futures indicate a bullish divergence, with prices rebounding noticeably from recent lows. The trajectory suggests a continuation of the bullish trend following a retracement to the 47-48 cents per pound levels last week.
Trading Idea:
Entry: Long 2 lots FCPO @ 4230
SL: 4190
TP: 1 lot @ 4330 ; another @ 4480
- Darren, Phillip Nova Analyst
Long