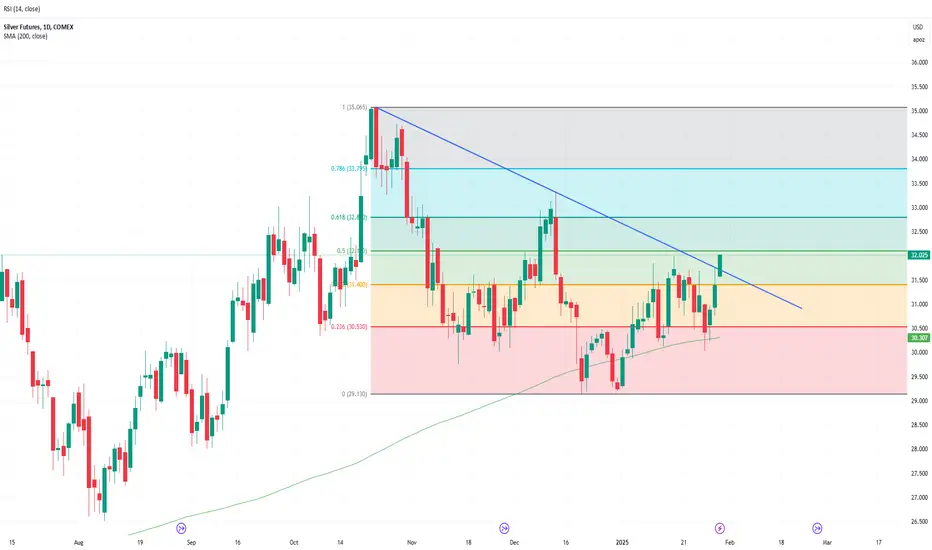
Gold’s deleveraging pullback spurs fresh demandSpot gold's initial response to the steepest US trade barriers in more than 100 years was a move to a fresh record high of USD 3,167 per troy ounce on heightened inflation risks, before surging volatility in response to collapsing stock markets saw traders turn their attention to capital preservation and deleveraging—the dash-for-cash focus hurt all leveraged positions across the commodities sector, including those in silver, which experienced a brutal 16.5% top-to-bottom slump, but also bullion, which despite its safe haven label during times of turmoil fell by around 4% before finding solid support around USD 2,950.
As the dust begins to settle following one of the worst risk reduction periods in recent years, demand for silver and especially gold has re-emerged, with gold has reaching a fresh all-time-high above USD 3,200, while silver has managed to retrace half of what was lost during the first week of April, both strongly suggesting that underlying concerns remain.
A combination of heightened global economic tensions, the risk of stagflation – a combination of lower employment, growth and rising inflation - a weaker dollar, will, in our opinion, continue to support bullion, and to a certain extent also silver. Adding to this is a market that is now aggressively positioning for the Fed to deliver more cuts this year—at current count more than 75 basis points of easing by year-end, and not least continued demand from central banks and high net worth individuals looking to reduce or hedge their exposure to US government bonds and the dollar.
With all the mentioned developments in mind, we maintain our forecast for gold reaching a minimum of USD 3,300 this year, while silver, given its industrious exposure and recession worries, may struggle to materially outperform gold as we had previously forecast. Instead, based on the XAU/XAG ratio returning below 90 from above 100 currently, we see silver eventually making it higher towards USD 37. Brent crude: We maintain our USD 65 to USD 85 range for the yearBrent crude's current momentum has taken prices to a three-week high, with the latest move being supported by a combination of underinvested hedge funds, improved risk sentiment following a softening in the tone regarding tariffs after Trump indicated some nations could receive breaks from "reciprocal" tariffs starting next week on 2 April, and not least, the mentioned secondary tariffs on buyers of Venezuelan crude, which, together with Iran sanctions, may help tighten supply.
Overall, we maintain our USD 65 to USD 85 range for the year, with the near-term upside potential being limited by resistance now seen in a band between USD 73.80, the 0.382 Fibonacci retracement of the January to March selloff, and USD 74.10, a level that provided support on several occasions last month before the eventual break triggered a slump extension to near USD 68. Silver-led profit-taking weighing on goldGold reached a fresh record high above USD 3,050 an ounce before some end-of-week profit-taking, led by silver and platinum, helped trigger another, so far shallow, correction. The recent rally has pushed the price of a standard 400-ounce (12.4 kg) gold bar—held by central banks globally—above USD 1,200,000, a tenfold increase since the start of the 21st century. Beyond reinforcing gold’s status as a long-term buy-and-hold asset, this surge reflects growing global instability, which has fueled strong demand for safe havens like gold and, to some extent, also silver.
Since the November 2022 low, gold has rallied by around 80%—a phenomenal performance by an asset often criticized by Warren Buffett, famously calling it an unproductive asset, with his argument being that gold does not generate income, unlike stocks, bonds, or real estate, which can produce dividends, interest, or rental income.
While managed money accounts have been net sellers during the past seven weeks, reducing their net long by 5.2 million ounces to 18.2 million, potentially signalling a short-term peak, asset managers and other more long-term-focused investors have increased total holdings across exchange-traded funds by 2.9 million ounces to 86.2 million—still a far cry from the pre-US rate hike peak at 106.8 million ounces—highlighting plenty of room for additional demand should the underlying trends continue to support. Read more in our latest gold update here.
Technical analysis suggests that gold’s short-term peak is around USD 3,100, potentially followed by a period of consolidation before a renewed attempt toward our year-end target of USD 3,300 per ounce. After three failed attempts, last year’s breakout above USD 2,074 confirmed the completion of a cup and handle formation, developed over a 13-year period (2011–2024). Using the distance from the cup’s bottom (large box) to the handle’s top (small box), the technical target is USD 3,100. Gold and silver see fresh gains as Trump 2.0 era beginsGold has rallied strongly this week, with the move accelerating after breaking resistance—now support—at USD 2,725, clearing the path to retest last year’s record high at USD 2,790. In our recently published Q1 2025 outlook, we reiterated our long-held bullish view on both gold and silver. Demand for investment metals continues to be fueled by an uncertain geopolitical landscape, where global tensions and economic shifts have led investors to seek safer assets. With Trump 2.0 upon us, this development shows no signs of fading, given the potential risks of tariffs causing inflation to move higher and the dollar eventually weakening, thereby removing an obstacle standing in the way of further gains.
Central bank buying looks set to continue, thereby providing a soft floor under the market, as they seek to diversify away from the USD and USD-based assets such as bonds. Together with concerns about mounting global debt, particularly in the United States, investors continue to seek a hedge against economic instability by turning to precious metals, including both gold and silver.
We forecast a potential decline in the gold-to-silver ratio, which currently trades above 89, possibly moving towards 75—a level seen earlier in 2024. If this occurs, and with gold reaching our current forecast of USD 2,900 per ounce, silver might trade above USD 38 per ounce, both well above the cost of carry.
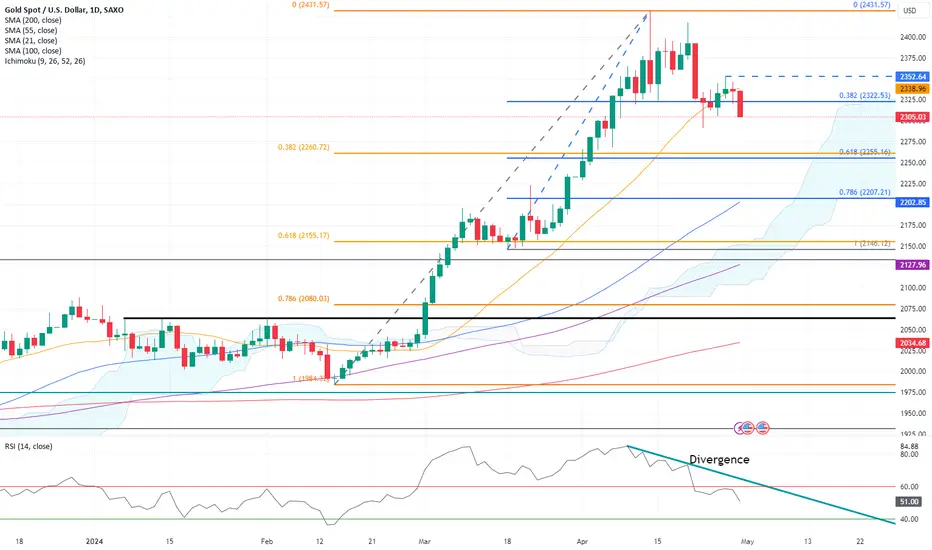
Correction in Gold unfolding, potential down to 2,200Gold (XAUUSD) is back below key support at 2,319 after failing to close above 2,350, which would have confirmed the resumption of an uptrend. If Gold breaks below 2,291, it is likely to face a sell-off down to between 2,260 and 2,255, and possibly even lower to around 2,207, which is the 0.786 retracement of the leg up since March.
The strength indicator RSI has been showing divergence for quite some time, a sign of trend exhaustion. A correction is needed. However, if Gold jumps back to close above 2,352, this likely bearish scenario would be negated, potentially reversing to an uptrend with a target of 2,400.  Short
Short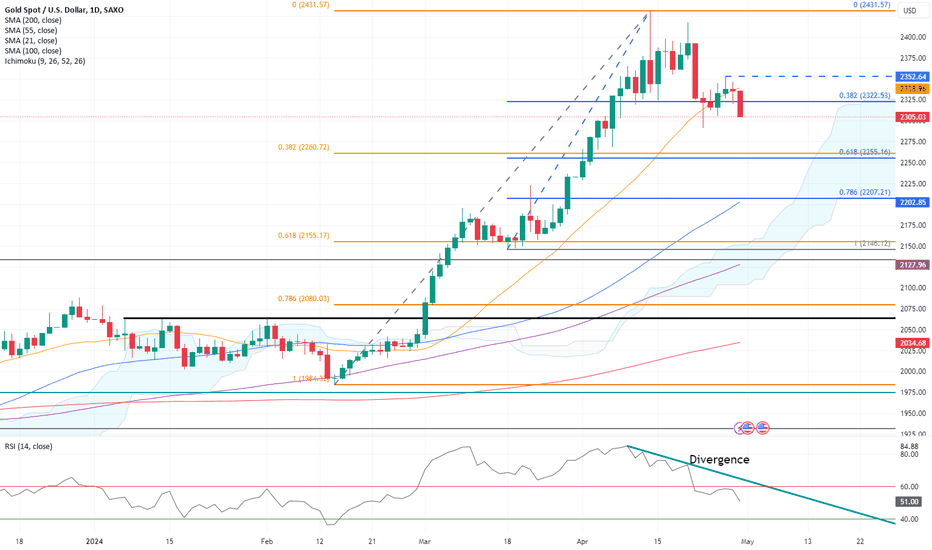
Ethereum is testing resistance. A break above paves the road towEthereum ETHUSD is testing key resistance at around USD 3,677 and the 0.618 retracement.
A break above is likely to fuel a rally towards all-time highs at around USD 4,092. Some resistance at the 0.786 retracement at USD 3,870.
If breaking above USD 4,092, there is further upside potential to the 1.382 projection at USD 4,486, possibly to the 1.618 projection at USD 4,730.
If ETH is closing above USD 3,697, the strength indicator RSI is also likely closing back above the 60 thresholds, confirming the uptrend.
Conversely, a close below USD 3,200 is necessary to reverse the bullish picture  Long
Long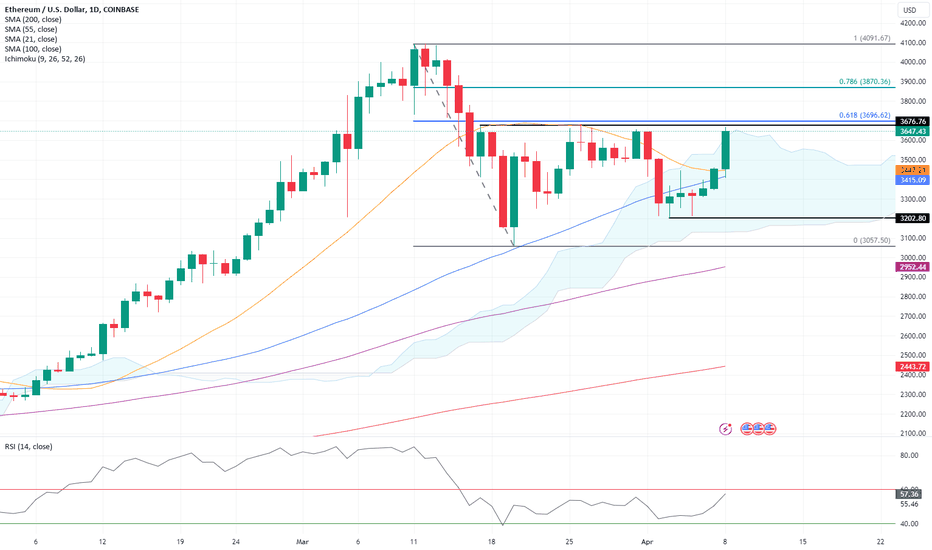
Bitcpoin breaking bullish out of triangle. Upside potential to UBitcoin BTCUSD is breaking bullish out of its corrective symmetrical triangle pattern and is currently above minor resistance at around USD 71,790.
If breaking above all-time highs at around USD 73,835, Bitcoin has upside potential to the 1.618 projection of the top to the bottom of the triangle at USD 81,909, but could move as high as to the 1.764 projection at USD 83,816, which is also the same distance from the top to the bottom of the triangle – as illustrated by the two vertical blue dotted lines.
Bitcoin could experience a throwback after the breakout. A throwback is where the traded instrument is sliding back, testing the upper (falling) trendline of the pattern from the upper side. Bitcoin should not close back below, which would then hurt the upside potential. However, to reverse this bullish outlook, a close below USD 64,500 is necessary.
RSI is, at the time of writing, above the falling trendline and back above the 60 thresholds, supporting the view of Bitcoin resuming an uptrend  Long
Long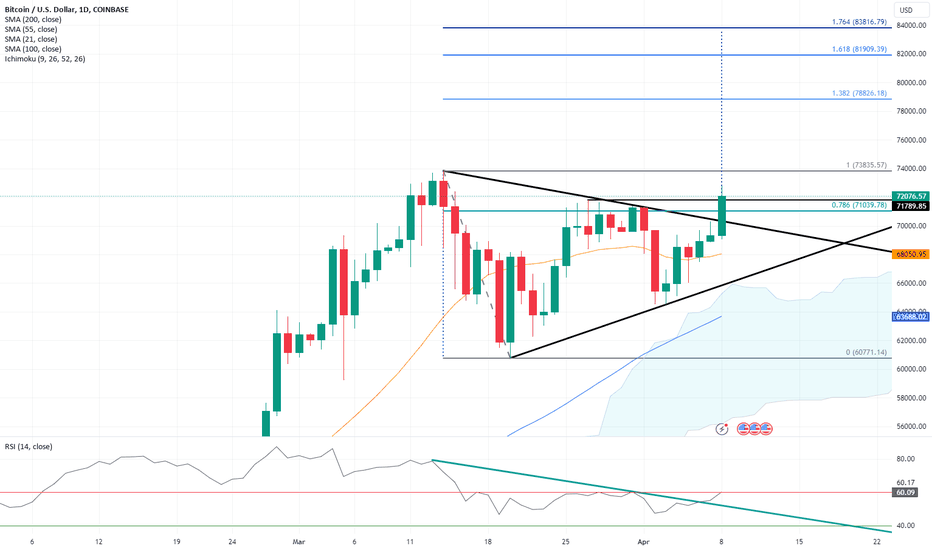
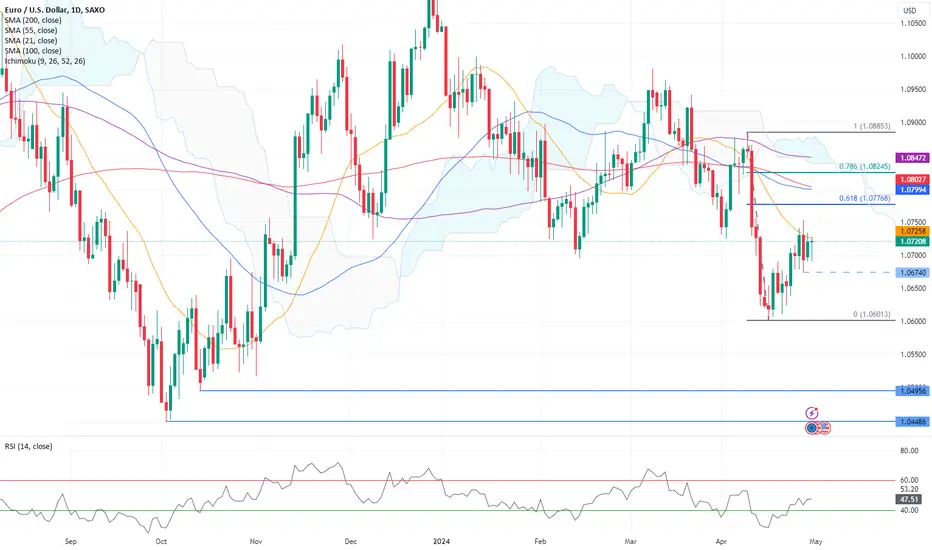
Technical Update - Volatile EURUSD without clear directionEURUSD is experiencing considerable volatility, partly due to conflicting signals from its daily moving averages (DMAs). With the 21 DMA rising, the 55 DMA declining, the 100 DMA rising, and the 200 DMA almost flat, the currency pair lacks a clear directional trend across short-, medium-, and long-term perspectives.
Fibonacci retracement levels are key in understanding EURUSD's recent movements:
1. In early March, EURUSD reached the 0.618 Fibonacci level at 1.0970 and then retracted
2. It then declined to the 0.50 retracement of the mid-February to mid-March uptrend and the 0.786 retracement of the early March uptrend at 1.0835
3. The pair rebounded from 1.0835, approaching the 0.786 retracement at 1.0949 but closed below the 0.618 level at 1.0925
4.EURUSD is now testing the 0.618 retracement of the mid-February to mid-March uptrend at 1.0804
A close below 1.0795 could lead to further declines toward the 0.786 level at 1.0756. EURUSD is nearing strong support at the 0.618 retracement around 1.08. A rebound from this level and a break above 1.0945 could signal a resumption of the uptrend, supported by positive sentiment indicated by the RSI.
Conversely, a close below 1.0795, potentially pushing the RSI below 40, would suggest a bearish outlook, possibly targeting the February lows around 1.07