Weekly Technical Analysis — 14 September 2026
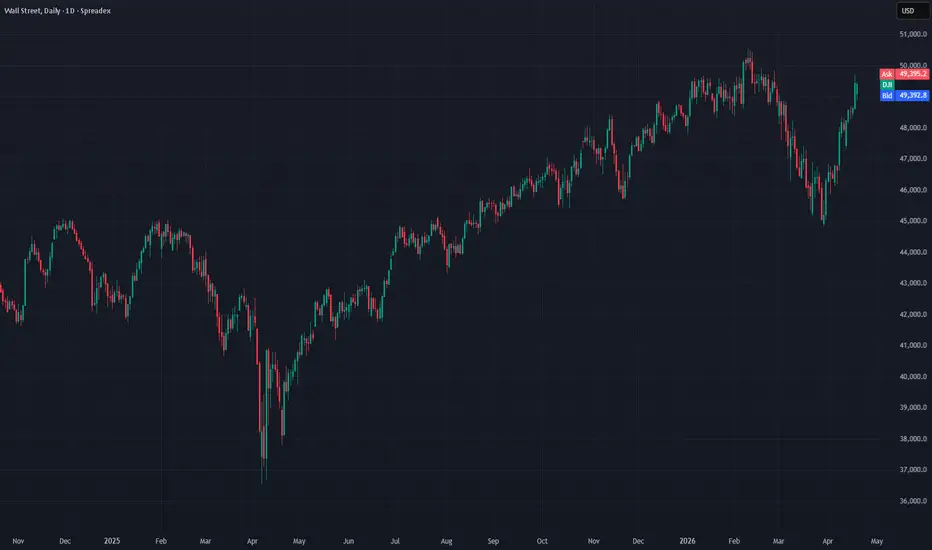
Wall Street's pullback from August's highs near 55,000 has deepened, with price now testing the 100-day SMA while the descending trendline from that high continues to cap rallies overhead. The longer-running rising trendline underneath still underpins the broader uptrend, and RSI's slide into the low-40s reflects further cooling rather than a reversal. Holding the SMA and rising trendline together would keep the bullish structure intact, while a break of both would risk a slide toward the lower band.
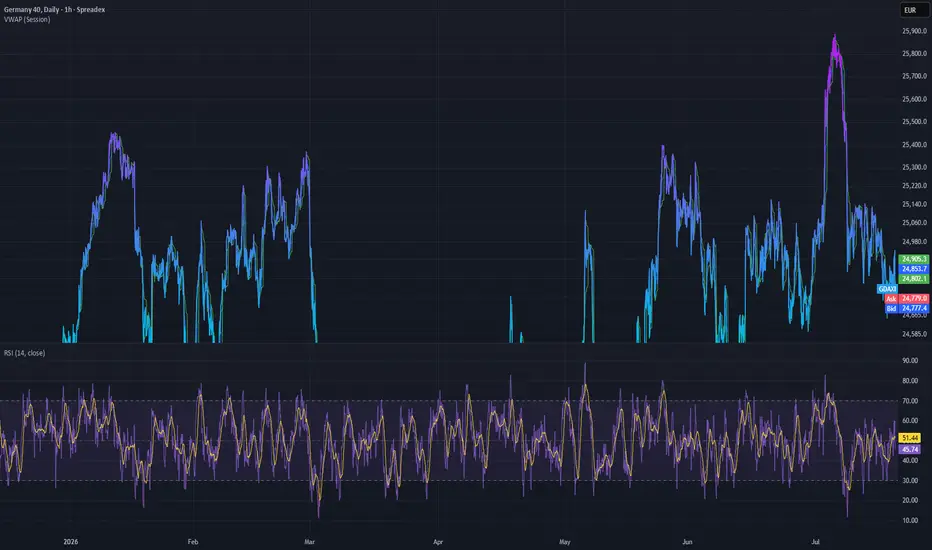
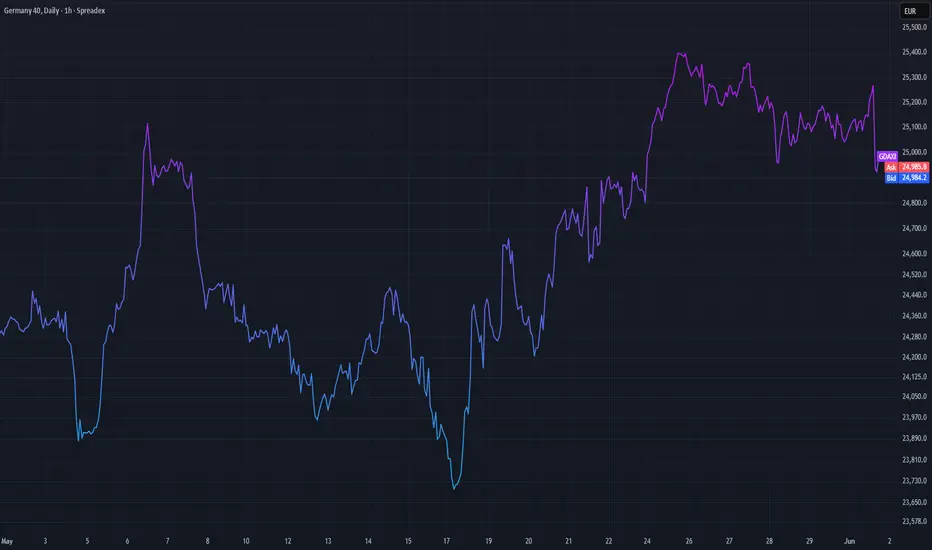
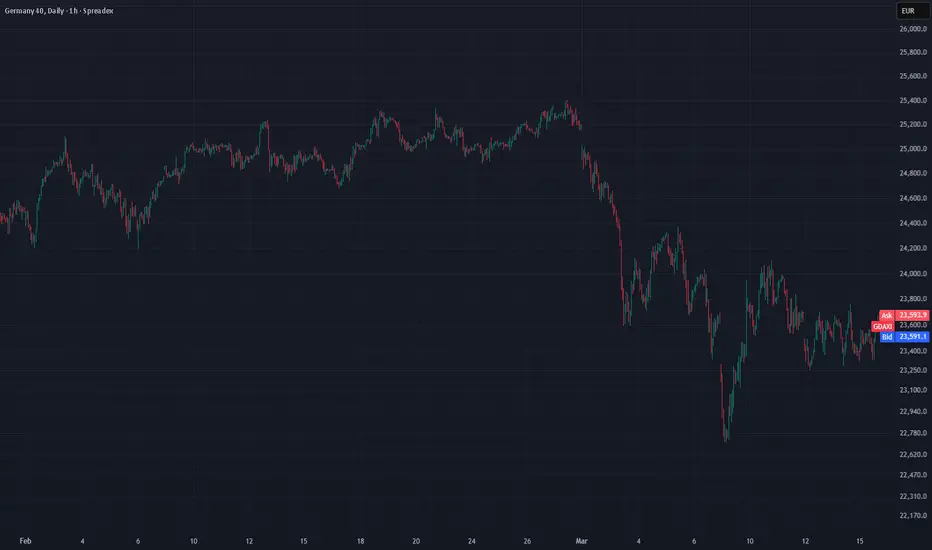
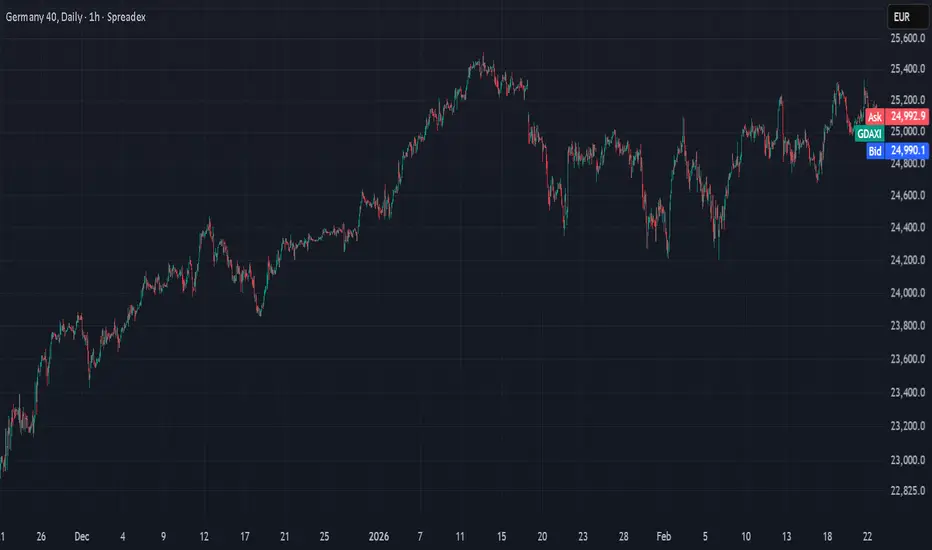
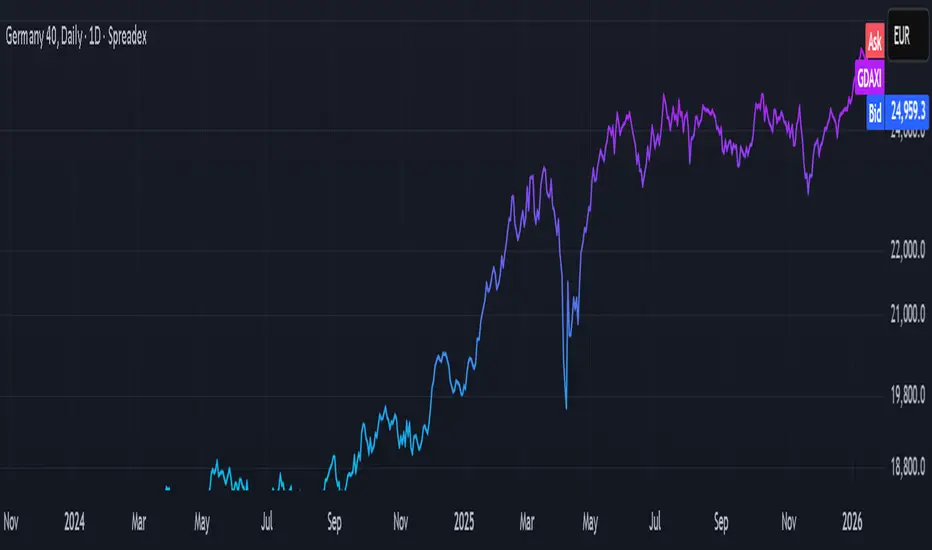
Germany 40's pullback has extended, with price sitting right on the 100-day SMA after failing to hold the push above 26,500. The index remains above its rising trendline, keeping the broader uptrend technically intact, though RSI's slip into the mid-30s points to a more pronounced loss of momentum than in recent weeks. A bounce off the SMA and trendline would restore bullish momentum, while a clean break below would open the door to a deeper correction.
UK 100 is consolidating just below its recent high, with price holding modestly above the 100-day SMA as the index digests its August rally. A descending short-term trendline is capping the advance for now, but the broader gradual uptrend remains intact with RSI sitting around neutral. A break above trendline resistance would reopen the path to fresh highs, while a slip back below the SMA would flag a deeper pullback toward support.
Cable continues to consolidate inside its narrowing wedge, with price easing back to trade just above the 100-day SMA in a shallow pullback. The rising trendline underneath keeps the near term bullish structure intact, while the descending trendline capping the wedge from above still needs to give way before fresh highs are in view, and RSI's return to the low-40s reflects fading upside momentum rather than a reversal. A break of trendline support would risk a deeper slide toward support.
EUR/USD has turned decisively lower, breaking down through its short-term rising trendline to the 100 day SMA, while the longer descending trendline overhead continues to cap the broader multi-month decline. The pair's failure to hold August's bounce, together with RSI slipping into the high-30s, points to sellers regaining control rather than a continuation of the recent range. A reclaim of the broken trendline would be needed to stabilise the pair, while a fresh push below the 100 SMA would confirm the downside break.
USD/JPY remains under pressure, still below its lower band despite several days of consolidation as the week prior's sharp breakdown continues to play out. Price sits well below the 100-day SMA, and RSI in the high-30s shows momentum still tilted lower even after the earlier plunge into oversold territory. Further downside is favoured while price holds below the lower band support, with a reclaim of the SMA needed to meaningfully challenge the bearish structure.
Gold has pulled back toward its 100-day SMA in an attempted break of the H&S neckline we mentioned in our daily report last week. The descending trendline above continues to cap the topside, giving back a portion of its September recovery. RSI's retreat to around 40 reflects a downwards shift momentum with room to spare until its oversold. A break above the descending trendline would reopen the path higher, while a clean break of the SMA risks a deeper correction toward support.
Brent Crude has broken out above both its upper band, extending its impulsive advance in strong fashion. RSI's push to around 70 underlines the strength of the move, though it also raises the risk of a near-term pause- already reflected in the dark cloud cover candle pattern. The longer rising trendline is now sitting well beneath as a distant support. A close back below the SMA would be needed to really suspect this leg is losing steam, while holding above the band favours further gains.
Weekly Technical Analysis — 7 September 2026Wall Street has eased into a shallow pullback after tagging fresh highs near 55,000 in August, with price now sitting just below VWAP inside the upper half of its band. The rising trendline continues to underpin the broader uptrend, and RSI's retreat to the high-40s reflects cooling momentum rather than a reversal. A reclaim of VWAP would keep the bullish structure intact, while a break of trendline support risks a slide toward the lower band.
Germany 40 has pulled back from its recent highs, with price now trading just below VWAP after failing to sustain the push above 26,500. The index remains well above its rising trendline, keeping the broader uptrend intact, and RSI's slip to the mid-40s points to a pause rather than a trend change. A recovery back above VWAP would restore bullish momentum, while a break of trendline support would open the door to a deeper correction.
UK 100 is consolidating just below its recent high, with price holding modestly above VWAP as the index digests its August rally. A descending short-term trendline is capping the advance for now, but the broader uptrend remains intact with RSI sitting comfortably above neutral. A break above trendline resistance would reopen the path to fresh highs, while a slip back below VWAP would flag a deeper pullback toward support.
Cable has eased back from its recent push toward 1.3670, with price now trading just below VWAP in a shallow pullback. The pair remains above its rising trendline, keeping the broader bullish structure intact, and RSI's return to neutral reflects fading upside momentum rather than a reversal. A reclaim of VWAP would put resistance back in view, while a break of trendline support would risk a deeper slide toward 1.3460.
EUR/USD continues to chop without a clear direction, with price oscillating around VWAP inside a well-defined range between support and resistance. The pair has recovered a large share of its summer decline but has yet to challenge the descending trendline capping the topside, and RSI sitting near neutral offers no strong directional edge. A decisive break of either the trendline or the range extremes would be needed to establish a fresh trend.
USD/JPY has turned sharply bearish, breaking down through both VWAP and its support trendline as sellers took firm control of the pair over the past week. The move lower has been impulsive, with RSI plunging into oversold territory as downside momentum accelerates. VWAP now acts as resistance on any bounce, with further downside favoured while price holds below the broken trendline.
Gold has pulled back from its recent push toward 4,500, with price now trading just below VWAP after the rally stalled beneath the descending trendline. The broader recovery from the year's lows remains intact, and RSI's retreat to neutral reflects a pause in momentum rather than a reversal. A break above the trendline would reopen the path higher, while holding below VWAP risks a deeper correction toward support.
Brent Crude has extended its rally in impulsive fashion, trading well clear of VWAP as it presses against the horizontal resistance that has capped price since the spring. RSI's push into the mid-60s underlines the strength of the current move, with the trend showing no signs of stalling yet. A break above resistance would open the door to fresh highs, while a close back below VWAP would be the first sign this leg is losing steam.
Technical Analysis, 24th August, 2026Wall Street has pulled back from its early-August record high, easing below VWAP at 53,662 as it consolidates beneath the descending trendline drawn from that peak. The index continues to hold above the longer rising trendline from the April low, and with RSI at a neutral 51 the broader bullish structure remains intact. Support at 52,772 and resistance at 54,553 frame the range as price looks to reclaim VWAP and challenge the recent high.
Germany 40 remains in pullback mode, easing below VWAP at 26,241 as it consolidates beneath the descending trendline drawn from July's record high. Price continues to hold above the rising trendline extending from June, and with RSI at 55 the retracement still looks shallow within the broader bullish structure. Resistance at 26,587 caps the recovery for now, with the rising trendline and support at 25,894 the key downside levels to watch.
UK 100 is in pullback, having eased back from its early-August high but continuing to hold above the rising trendline drawn from July's low. Price remains above VWAP near 10,750, and with RSI at 56 momentum stays constructive even as the index consolidates beneath the longer descending trendline from the March high. Support at 10,702 underpins the pullback, while resistance at 10,947 is the level to clear for the advance to resume.
Cable has broken decisively above the descending trendline that had capped its recovery since February, an impulsive move that marks a shift in the broader structure. Price at 1.36441 trades comfortably above VWAP at 1.35291, with RSI stretched to 72 confirming the strength of the advance while also flagging scope for near-term consolidation. The rising trendline and support at 1.33921 provide a fresh base underneath, with resistance at 1.36661 the next level in sight.
EUR/USD has broken sharply higher out of its multi-month range, clearing the descending trendline from May's high in an impulsive move that has pushed price well above VWAP at 1.15804. At 1.16700 the pair trades close to resistance at 1.16994, and with RSI stretched to 71 it looks overbought after the sharp advance. The rising trendline from July's low now underpins the move, with support at 1.14614 the key level to hold on any pullback.
USD/JPY is consolidating in a range following August's sharp break below the rising trendline that had supported the advance since May, with price at 158.97 hovering just above VWAP at 158.49. RSI has cooled to a neutral 44, reflecting the loss of momentum after the reversal from the July highs near the descending trendline. Support at 156.94 and resistance at 160.03 now bound the range as the pair looks for direction.
Gold has broken forcefully above the descending trendline from May's peak, an impulsive move that has carried price above both VWAP at 4,354 and the prior resistance level at 4,497. RSI has surged to 75, signalling overbought conditions after the sharp advance off the rising trendline support from early July. Price at 4,663.86 leaves support at 4,010 as the key level well below, with the market now testing how far this breakout can extend.
Brent Crude continues its impulsive advance, holding above VWAP at 8,637 and pressing toward resistance at 9,497 as it extends the recovery off the rising trendline from July's low. Price at 9,149.20 remains capped for now by the descending trendline drawn from the recent high, with RSI at 60 showing firm but not yet overbought momentum. A clean break of that trendline and resistance would confirm the next leg higher, with support at 7,776 the key level below.
Technical Analysis, 10th August, 2026Wall Street has extended last week's breakout to fresh record highs, with the former flat resistance zone now acting as support underneath. Price remains well clear of VWAP and momentum stays firm, keeping the near-term structure decisively bullish, though the pace of the advance leaves scope for a pause.
The index has pushed to new highs following its breakout from the summer range, with the prior resistance shelf now underpinning price as support. Momentum remains strong and RSI is edging toward overbought, so while the trend stays firmly higher, the move is becoming stretched.
UK 100 is consolidating just beneath its recent highs after last week's impulsive advance, with price still comfortably above VWAP and the rising trendline beneath it. The pause looks corrective within an intact uptrend rather than a change in direction.
Cable has pushed higher off its rising trendline support, closing in on the descending trendline from May that has capped previous rallies. The strength of the move keeps the near-term bias bullish, though a rejection at that overhead trendline would keep price within its broader sideways range.
EUR/USD is extending the breakout above its descending trendline, holding well above VWAP with the advance continuing to build. The structure remains constructive, though the pair is yet to have reached overbought and the bullish change of trend is not confirmed.
USD/JPY is stabilising after last week's sharp breakdown, bouncing off a flat support (155) that has now been tested twice. Price remains below VWAP and the broken rising trendline overhead, so this looks like a corrective recovery within a fresh downtrend rather than a reversal - though the previous similar drops did indeed reverse.
Gold has broken decisively higher out of its multi-week triangle, pushing to fresh highs with strong momentum and RSI approaching overbought. The breakout marks a clear shift from the prior downtrend, with the former triangle top now the level to hold on any pullback.
Brent Crude is consolidating after failing to clear its recent high, drifting back below VWAP while holding above rising trendline support. The broader recovery structure remains intact, but the rejection at resistance suggests a period of sideways digestion before the next directional move.
Technical Analysis, 3rd August, 2026Wall Street has broken back above its descending trendline resistance, confirming a resumption of the broader uptrend after several weeks of consolidation. Price is trading comfortably above VWAP with momentum turning constructive again. A close above the recent swing high would open the door to fresh record territory.
The index has pushed into record territory, out of its tightening triangle, breaking the descending trendline that had capped price since early July. With price extended above VWAP and momentum firm, the bias favours continuation, though the risk of another failed breakout remains.
UK 100 has made a new record high, extending the impulsive move that began with last week's trendline breakout. Price remains well supported above VWAP and the rising trendline beneath it, keeping the near-term structure firmly bullish with the main counterfactual the possibility of a long term double top.
Cable has staged a recovery off its rising trendline support but remains capped beneath the long descending trendline from May, keeping this a corrective bounce within a broader range. Price sits above VWAP for now, though a rejection at the overhead trendline would tilt the bias back toward the downside.
EUR/USD has broken decisively above its descending trendline, reclaiming VWAP with a strong impulsive move after months of grinding lower. The break marks a meaningful shift in near-term structure, though the pair is now testing the upper region of its recent range and could consolidate before extending further.
USD/JPY has suffered a crushingly sharp, high-momentum breakdown, slicing through its rising trendline support and falling well below VWAP in the space of a few sessions. This marks a significant reversal from the prevailing uptrend, with the speed of the move suggesting an extended and potentially overdone decline.
Gold remains locked in a narrowing corrective range, with price hovering close to VWAP and showing little directional conviction. The pattern suggests indecision after the broader downtrend from the February peak, with a break of either boundary likely to set the next direction.
Brent Crude is consolidating after its sharp recovery rally, pulling back toward its rising trendline support while holding beneath VWAP. The broader structure remains constructive following the bounce off multi-month lows, with the trendline now the key level to hold for the recovery to stay intact.
Technical Analysis. 27 July, 2026Wall Street remains in a broad bullish structure, though price has pulled back from recent highs and is consolidating just above its VWAP. A rising trendline continues to underpin the advance, while the descending line from the peak now caps near-term upside. Momentum has eased from overbought extremes but stays constructive overall.
Germany 40 continues to trend higher after a sharp impulsive rally, though price is now correcting within a converging range as the descending resistance line meets a firmer rising support. The index holds comfortably above its VWAP, keeping the broader bias intact. A decisive break of either boundary should confirm the next directional move.
UK 100 has broken back above its long-standing descending resistance trendline, reinforcing an impulsive bullish tone. Price trades above its VWAP with a rising floor of support beneath, and momentum is firming in tandem with the advance. The breakout keeps the index on track for a test of higher levels.
GBP/USD remains in an overall range following its recent bounce, easing back toward the recently formed rising trendline going back to the July low. The pair sits below its VWAP, with the broader bias still tilted slightly bearish given the retreat from the descending resistance line. Momentum is neutral, leaving the near-term path reliant on the support trendline holding.
EUR/USD is consolidating within a narrowing range, hemmed in by a descending resistance line and a firmer rising support beneath. Price is trading marginally below its VWAP, keeping the broader bearish bias intact even as the pair attempts to stabilise. The break of the lower boundary should set the tone for the week ahead.
USD/JPY continues to press higher within a well-defined impulsive uptrend, holding above both its VWAP and rising trendline support. Momentum remains firm, having recently touched overbought territory, underscoring the strength of the advance. Pullbacks continue to be shallow and well supported.
Gold remains corrective, consolidating in a tightening range as a descending resistance line converges with rising support above the big $4k level. Price is holding close to its VWAP, with momentum neutral, reflecting the indecision after the broader pullback from earlier highs. A clear break from the range should clarify the next leg.
Brent Crude remains the standout mover, having staged a strong impulsive rally off its multi-month low. Price has now gapped below 9,000 from resistance and is now correcting back towards its VWAP and rising trendline support. Momentum has cooled from recent strength but continues to support the broader recovery.
Technical Analysis, 20th July, 2026Wall Street has slipped back below VWAP after last week's stall, easing off the highs but continuing to hold well above the broader rising trendline from the April low. The pullback remains shallow in the context of the multi-month advance, and with RSI back to a neutral 51, the index has room to resume higher provided VWAP is reclaimed on the next push.
Germany 40 has extended its pullback from the July high, slipping below VWAP for the first time in several weeks with what has become a failed breakout into record highs. The rising trendline from April is now the key support to watch, and with RSI easing to 46, a hold above this level would keep the broader bullish structure intact.
UK 100 has stabilised after last week's rejection, reclaiming VWAP and holding above the rising trendline drawn from the July low. The index remains capped by the long-standing descending trendline from the March high, but firmer RSI at 55 points to improving momentum as price works to challenge that resistance again.
Cable has broken decisively above the descending trendline that had capped the recovery for the past two months, confirming a shift in short-term structure. Price is now comfortably above VWAP with RSI firming to 58, and the rising trendline from the July low offers a fresh line of support underneath as the pair pushes toward the next resistance band.
EUR/USD remains squeezed inside its symmetrical triangle, with price hovering just above VWAP as the descending and rising trendlines continue to converge. RSI sits at a neutral 47, reflecting the ongoing indecision, and a decisive break of either trendline is still needed to confirm the pair's next directional move.
USD/JPY continues to consolidate in a tight range just below its recent highs, holding above both VWAP and the rising trendline support in place since May. RSI at 59 reflects steady, unextended momentum, leaving the pair well positioned to resume its climb once the current pause resolves.
Gold has slipped back below VWAP and continues to trade beneath the descending trendline resistance from the May peak, keeping the metal capped within its broader wedge. The rising trendline from early July remains the key support underneath, and with RSI soft at 42, the medium-term bias remains tilted to the downside while price stays below VWAP.
Brent has extended its recovery for a second straight week, pushing further above VWAP and back toward the horizontal resistance that has capped the market since May. RSI has climbed to 61, confirming the improvement in momentum, and a clean break of that resistance would mark a meaningful shift away from the prior downtrend.
Technical Analysis, 13th July, 2026
Wall Street has eased back from last week's highs, pulling through the rising trendline that had guided the advance since June and consolidating just above VWAP. The broader uptrend from the April low remains intact, with price still comfortably above the mid-band, but the cooling RSI reading points to a period of digestion rather than continued acceleration. A hold above VWAP would keep the path of least resistance to the upside.
Germany 40 has pulled back sharply from last week's breakout high, giving back a large portion of the advance and now consolidating at the apex of a converging trendline pattern. Price is hovering close to VWAP, with the descending trendline from the July peak and the rising trendline from April now squeezing into a narrow range. A neutral RSI reading reflects the indecision, with a decisive break of either trendline likely to set the next directional move.
UK 100 was rejected once again at the long-standing descending trendline resistance from the March high, and has since fallen back below VWAP and through the rising trendline that had supported the advance from the July low. This leaves the index sitting at a confluence of support just above 10,332, with a neutral RSI reflecting the loss of short-term momentum following the failed breakout attempt.
Cable's corrective rebound has continued for a second week, with price holding above VWAP and grinding higher toward the descending trendline resistance from the May high. The recovery remains constructive, with RSI firming into the mid-50s, though the pair is now approaching the same trendline that capped the previous bounce attempt, making this a key level to watch for either a breakout or renewed rejection.
EUR/USD is consolidating in a tightening symmetrical triangle, with the descending trendline from the June high converging with the rising trendline from the early-July low. Price is hovering just below VWAP, and a neutral RSI reading reflects the balanced tension in the pattern. A decisive break of either trendline should signal the pair's next directional move.
USD/JPY continues to consolidate just below its recent highs, holding above both VWAP and the rising trendline support that has underpinned the advance since May. RSI remains firm without being overbought, and the pair looks well placed to push for fresh highs provided the trendline and VWAP continue to hold on any further pullback.
Gold remains capped within a descending wedge, with price consolidating below both VWAP and the trendline resistance drawn from the May peak, while the rising trendline from the early-July low continues to offer support underneath. RSI remains soft, in keeping with the still-bearish medium-term structure, with a break of either trendline needed to resolve the current squeeze.
Brent has staged a sharp relief bounce off the multi-month trendline support that has now been tested and held, reclaiming VWAP in the process. RSI has recovered from deeply oversold levels back into neutral territory, supporting the case for further near-term upside, though the broader trend from the May peak remains bearish until the market can clear the horizontal resistance overhead.
Technical Analysis, 6 July 2026Wall Street remains firmly in an impulsive uptrend, extending the rally that began in April into a fresh record high last week after a steady sequence of higher highs and higher lows. Price continues to track above VWAP and is riding the ascending trendline drawn from the June low. RSI in overbought territory reflects the strength of the move, though it leaves the index vulnerable to a short-term pullback toward the trendline or VWAP.
Germany 40 has broken decisively above the horizontal resistance that had capped rallies since March, confirming a fresh impulsive leg higher into new all-time highs. Price is comfortably above both VWAP and the rising trendline support established from the early-June low, and the strong RSI reading confirms bullish momentum is intact. A retest of the breakout level as new support would be the ideal follow-through.
UK 100 has pushed out of the ascending triangle that formed through May and June, breaking above the trendline resistance that had twice rejected price. VWAP and the rising trendline sit comfortably below the current market, supporting the bullish structure, while a firm RSI reading points to continuing upside momentum as long as the breakout level holds as support on any pullback.
Cable has staged a corrective bounce within its broader downtrend, having rebounded sharply off 1.32, forming a double bottom with the April low. Price is now testing the descending trendline resistance from the May high, with VWAP reclaimed in the process. A break above this trendline would open the door to a deeper recovery, while rejection here would reaffirm the dominant bearish structure.
EUR/USD continues to trade within a well-defined downtrend, though price has bounced from trendline support and is now pressing into the broken 1.14 level, while still well off the resistance drawn from the June highs. VWAP is the next barrier to any further up-move, and RSI sits in neutral territory, leaving the pair at an inflection point between a deeper corrective recovery and a resumption of the broader downtrend.
USD/JPY remains in a strong uptrend but remains subject to sporadic sharp sell-offs, with the recent pullback bringing price back toward VWAP and the rising trendline support that has underpinned the advance since May. RSI has eased back from overbought extremes, giving the pair room to resume its climb provided the trendline and VWAP continue to hold as support on this retracement.
Gold is attracting some interest at 4,000 which is now clear support but remains in a corrective phase within its broader downtrend from the March highs. The market is now testing the descending trendline resistance drawn from the May peak, with VWAP sitting just below current levels. A neutral RSI reading reflects the tug-of-war between the recovering short-term momentum and the still-bearish medium-term structure.
Brent remains under sustained selling pressure, extending the impulsive downtrend that has been in place since the May peak. However, momentum has slowed around the key $70 level. Price continues to trade well below both VWAP and the broken trendline support, which now acts as overhead resistance. RSI in deeply oversold territory raises the prospect of a near-term relief bounce.
Technical Analysis, 29 June 2026Wall Street continues to trade in an impulsive uptrend, with price holding above VWAP and an ascending trendline providing dynamic support from the April lows. The index has reclaimed the year-to-date highs and RSI remains in bullish territory, reflecting sustained buying momentum heading into the week.
Germany 40 is in a corrective phase within its broader uptrend, with price consolidating above VWAP and beneath a descending resistance trendline. RSI is neutral. A breakout through trendline resistance looks most likely but a resolution of this range either way will likely dictate the next directional move.
UK 100 remains stuck inside a short term and longer term trading range, with price sitting in the middle of flat resistance and support levels - broadly at 11k and 10k respectively, while RSI holds in mid-range.
GBP/USD is in a downtrend near term, while testing longer term support, with price trading below VWAP following a sharp sell-off from the May highs. A short descending trendline is capping recovery attempts, and while RSI has ticked up from recent lows.
EUR/USD is bouncing after a break below long term support inside a clear downtrend, with price below VWAP. A descending trendline applies pressure from above, and RSI at oversold-adjacent levels suggests some potential for a further bounce, though the directional bias remains negative.
USD/JPY is in a clear impulsive uptrend, though volatility has shrunk after the price broke to new 40-year highs. An ascending trendline is driving the advance. RSI is in overbought territory, reflecting the strength of the move, though traders should be alert to the risk of a short-term pullback at these levels - especially given the chance of BOJ intervention.
Gold remains in a downtrend and impulsive phase, with price trading below a declining VWAP following a break of the kye $4k level. Price is attempting to stabilise near key support, and RSI is at levels consistent with prior corrective bounces, but the broader bearish structure remains in place.
Brent Crude is in an impulsive downtrend, with price trading well below VWAP and continuing to make lower lows throughout the period. RSI is approaching oversold territory, which could attract some short-term interest, but there are no signs yet of a structural reversal and the path of least resistance remains lower.
Technical Analysis Weekly (02-06-26)Wall Street is pushing into new all-time high territory, extending the bullish breakout above the descending trendline that had capped the market since the February highs. Price is trading well above the VWAP and momentum remains firmly with the bulls. RSI is elevated but not yet overbought. The former resistance level is now the key support to hold on any pullback.
Germany 40 has pulled back from flat/descending trendline resistance - setting up a possible breakout on the next attempt. Momentum remains strong and the index is comfortably above flat/rising support under 24K. A sustained close above that ceiling would open the door to fresh record highs.
UK 100 remains in a neutral sideways range, with price broadly in line with the VWAP and RSI at a neutral level. The descending upper trendline continues to cap upside while the ascending lower trendline limits the downside. A decisive break in either direction is needed to shift the bias.
GBP/USD is in a neutral range, consolidating within a converging triangle as price and VWAP remain closely aligned. RSI is neutral, reflecting the lack of directional conviction. The narrowing range points toward a breakout resolution — another close above the descending trendline would be bullish, while a break of ascending support would reassert downside pressure.
EUR/USD is in a neutral range, trading within a tightening triangle between the descending upper trendline and the ascending lower support. RSI carries a mild bearish tilt. The pair is at a decision point since a break above the descending trendline would be a significant bullish development, while a failure of ascending support would put the March lows back in focus.
USD/JPY is in a neutral range but with a building bullish bias, trading above the VWAP and pressing toward the flat upper resistance. RSI reflects solid momentum. A sustained break above that resistance would confirm the next leg higher, while the ascending support trendline remains the key downside reference.
Gold remains in a gradual bearish correction, trading below the VWAP within a tight down sloping channel. RSI reflects continued corrective pressure. The broken ascending lower trendline adds a bearish bias. A recovery above the VWAP and descending trendline would be needed to restore a bullish bias.
Brent Crude has deteriorated towards the bottom end of its months-long trading range, trading well below the VWAP after breaking under rising trendline support. RSI reflects sustained selling pressure. The April low is the key downside reference, while the VWAP then the flat upper resistance both represent significant overhead barriers to any recovery.
Technical Analysis Weekly (02-06-26)Wall Street
Wall Street is pushing into new all-time high territory, extending the bullish breakout above the descending trendline that had capped the market since the February highs. Price is trading well above the VWAP and momentum remains firmly with the bulls. RSI is elevated but not yet overbought. The former resistance level is now the key support to hold on any pullback.
Germany 40
The Germany 40 has pulled back from flat/descending trendline resistance - setting up a possible breakout on the next attempt. Momentum remains strong and the index is comfortably above flat/rising support under 24K. A sustained close above that ceiling would open the door to fresh record highs.
UK 100
The UK 100 remains in a neutral sideways range, with price broadly in line with the VWAP and RSI at a neutral level. The descending upper trendline continues to cap upside while the ascending lower trendline limits the downside. A decisive break in either direction is needed to shift the bias.
GBP/USD
GBP/USD is in a neutral range, consolidating within a converging triangle as price and VWAP remain closely aligned. RSI is neutral, reflecting the lack of directional conviction. The narrowing range points toward a breakout resolution — another close above the descending trendline would be bullish, while a break of ascending support would reassert downside pressure.
EUR/USD
EUR/USD is in a neutral range, trading within a tightening triangle between the descending upper trendline and the ascending lower support. RSI carries a mild bearish tilt. The pair is at a decision point since a break above the descending trendline would be a significant bullish development, while a failure of ascending support would put the March lows back in focus.
USD/JPY
USD/JPY is in a neutral range but with a building bullish bias, trading above the VWAP and pressing toward the flat upper resistance. RSI reflects solid momentum. A sustained break above that resistance would confirm the next leg higher, while the ascending support trendline remains the key downside reference.
Gold
Gold remains in a gradual bearish correction, trading below the VWAP within a tight down sloping channel. RSI reflects continued corrective pressure. The broken ascending lower trendline adds a bearish bias. A recovery above the VWAP and descending trendline would be needed to restore a bullish bias.
Brent Crude
Brent Crude has deteriorated towards the bottom end of its months-long trading range, trading well below the VWAP after breaking under rising trendline support. RSI reflects sustained selling pressure. The April low is the key downside reference, while the VWAP then the flat upper resistance both represent significant overhead barriers to any recovery. Technical Analysis Weekly (18-05-26)
Wall Street is correcting sideways after a strong upwards move, with price and VWAP closely aligned around 49,250. The RSI at 50 is perfectly neutral. A break above the descending trendline near 50,150 would be a significant bullish development; a break below the ascending support would shift the bias lower.
Germany 40 is in a neutral range phase, trading near the VWAP between the descending upper trendline resistance and the ascending lower support trendline. The RSI at 47 reflects slightly subdued momentum. Price is coiling within this narrowing structure, and the direction of the eventual breakout will be significant for the weeks ahead.
UK 100 is also neutral, trading just below the VWAP as it pulls back within the descending channel formed by the upper trendline resistance and the ascending lower support trendline. The RSI at 43 reflects the corrective pressure. The broader bullish trend remains intact while ascending support holds, and a break above the descending trendline would be the key signal to re-engage the upside.
GBP/USD is still rangebound but turned short term bearish, breaking sharply below the VWAP and through the ascending support trendline that had provided a floor. Price is testing the lower support band near 1.3334, with the RSI at 41 reflecting sustained selling pressure. The flat resistance near 1.3708 is now a distant target; the key downside level is around 1.32.
EUR/USD is trading sideways, recently breaking below the VWAP and through the ascending support trendline after failing at the descending upper trendline resistance. Price at 1.1640 is approaching the lower support band near 1.1621, with the RSI at 42 reflecting bearish momentum. A hold at the lower band could trigger a bounce; a break below it would extend the downside toward 1.15.
USD/JPY is neutral, recovering strongly above the VWAP after bouncing off the ‘intervention’ lows. Price at 158.85 has reclaimed the VWAP and is pushing toward the flat horizontal resistance near 160.18, with the RSI at 56 reflecting solid bullish momentum. The ascending support trendline continues to underpin the broader uptrend, and a break above the 160 resistance would be a significant bullish development.
Gold is neutral, trading below the VWAP but inside the tightening 2 standard deviation bands. Price has broken below the lower rising trendline, with the RSI at 40 the bias has turned bearish. The March low remains critical support.
Brent Crude is in a near term bullish pullback phase, tracking above the VWAP and pressing towards the flat upper resistance trend line. The RSI at 56 reflects some bullish momentum. The ascending lower support trendline continues to provide a floor, and a sustained break above the resistance would be a significant bullish development targeting new highs.
Technical Analysis Weekly (11-05-26)Wall Street
Wall Street is pulling back within its recent bullish structure, consolidating near the VWAP just below the descending upper trendline. Price has recovered close to the February highs, and the RSI at 57 reflects modest positive momentum. The ascending support trendline from below continues to hold, and a decisive break above the descending trendline near 50,000 would be required to confirm a resumption of the prior uptrend.
Germany 40
The Germany 40 is in a neutral range phase, trading near the VWAP between the descending upper trendline resistance near 24,748 and the ascending support trendline below. The RSI at 52 is neutral. Price remains in a well-defined compression zone, and the direction of the eventual break will be significant. Above the descending trendline targets new highs, while a break of ascending support re-opens the downside.
UK 100
The UK 100 is still rangebound, having pulled back below the VWAP after failing to sustain the break above the descending upper trendline. Price is mid-channel between the descending trendline above and the ascending support trendline below near 10,119, with the RSI at 44 reflecting the corrective momentum. The broader bullish trend remains intact while ascending support holds, and a successful break above the descending trendline would be the key bullish trigger.
GBP/USD
GBP/USD is in a bullish pullback phase, dipping slightly from recent highs but holding above the VWAP and the broken descending trendline from the February highs. The RSI at 56 remains constructive, and the ascending support trendline continues to provide a floor. A hold above the descending trendline now acting as support near 1.3450 would confirm the breakout and target the upper resistance band near 1.3634.
EUR/USD
EUR/USD is in a neutral range phase, trading near the VWAP in the middle of the compression zone between the descending upper trendline near 1.1790 and the ascending lower support trendline near 1.1668. The RSI at 56 has nudged slightly higher but remains neutral. The pair continues to coil, and a break in either direction from this structure will be the key event to watch.
USD/JPY
USD/JPY is in a bullish correction phase, rebounding from its recent lows but still trading below the VWAP after breaking through the horizontal support near 157.50. The RSI at 43 reflects recovering but still subdued momentum. The broader bullish trend from the
chart start is intact, but price needs to reclaim the VWAP and the broken support level, now resistance, near 157.50 to reassert a bullish bias.
Gold
Gold is in a bullish correction phase, consolidating at the VWAP within the wedge formed by the descending upper trendline and the ascending lower support trendline from late 2025. Price at 4,672 is compressing toward the apex of this structure, with the RSI at 49 reflecting neutral momentum. The long-term uptrend remains intact while the ascending support holds, and a break above the descending trendline would signal a resumption of the bull trend toward all-time highs.
Brent Crude
Brent Crude is still trading broadly sideways, currently just above the VWAP and sitting right in the middle of the $90-115 range. The RSI at 52 is neutral after easing from last week's highs. The ascending lower support trendline continues to underpin the structure, and a break above the descending upper trendline would be a significant bullish development; failure to break it keeps the range conditions in play.
Technical Analysis Weekly (04-05-26)Wall Street is in a neutral range phase, consolidating near the VWAP as the market lacks clear directional conviction. The advance in price is being held back by the descending upper trendline resistance. The RSI at 59 is mildly positive but not decisive. A break above the descending trendline would favour the bulls; a break below the VWAP would shift momentum lower.
Germany 40 is in a neutral range phase, consolidating just above the VWAP between the descending upper trendline resistance and the ascending support trendline below. The RSI at 57 reflects neutral momentum. A break above the descending trendline would be bullish; a loss of the ascending support would shift the bias lower.
UK 100 is trading below the VWAP and its lower band in an extended drop from a down trendline connecting the last two major peaks. The RSI at 46 reflects subdued momentum. The direction of the next break from this structure will be significant — a break above the descending trendline would be bullish, while a break below ascending support targets the lower band near 10,188.
GBP/USD is stalling around 1.35, pulling back toward the VWAP after pushing above the descending trendline from the February highs last week. Price remains above the VWAP and the ascending support trendline, with the RSI at 57 still constructive. The descending trendline has been broken but a retest and hold above it would confirm the breakout and set up a run toward the upper band near 1.3817.
EUR/USD is in a neutral range phase, trading near the VWAP between the descending upper trendline resistance near 1.18 and the ascending lower support trendline near 1.17. The RSI at 52 reflects indecision. A break above the descending trendline would open the path toward 1.19+; a failure of the ascending support would reassert downside pressure.
USD/JPY has shifted to a bearish bias, breaking sharply below the VWAP and through the horizontal support that had contained the pair since the middle of March. Price has found support around 156, with the RSI at 38 approaching oversold territory. The flat resistance near 161 is now a distant target; the key question is whether the former support line flips into resistance, opening up further declines.
Gold is in a bearish impulsive phase, trading below the VWAP but still well above the March low. Price is pressing toward the ascending support trendline from late 2025 near 4,526, with the RSI at 41 reflecting sustained bearish momentum. The descending trendline from the February highs continues to act as overhead resistance.
Brent Crude is testing the upper limits of the correction that has been in place since its rapid ascent in March, trading well above the VWAP. The RSI at 61 reflects solid bullish momentum. The ascending lower support trendline continues to provide a floor. A decisive break above the descending upper trendline would be a meaningful bullish signal targeting new highs.
Technical Analysis Weekly (20-04-26)Wall Street is in a new bullish impulsive phase, extending its recovery well above the VWAP and pressing against the upper resistance band. Price has cleared the descending trendline from the selloff, and the RSI at 65 reflects strong bullish momentum. A break to record highs would confirm current bullish conditions.
Germany 40 is undergoing a slight pullback after a 3-week surge, trading above the VWAP. Price has broken above the descending trendline from the March highs, with the long-term ascending support trendline providing a floor. The RSI at 60 reflects solid momentum, though the February highs remain the key test for the broader price range.
UK 100 continues its new bullish trend, trading above the VWAP as the recovery consolidates just below the record high set in February. Price is pressing against the descending trendline from the all-time high, which is acting as near-term resistance, while the long-term ascending support trendline from below continues to provide a foundation. The RSI at 57 remains constructive.
GBP/USD has made a short term breakout above the descending trendline from the February highs, trading above the VWAP. The RSI at 58 supports continued upside but the bigger picture is rangebound price action. The long-term ascending support trendline around 1.31 underpins the current upside push.
EUR/USD is broadly trendless but breaking to the top side near term, trading above the VWAP after breaking above the descending trendline from the February highs. The RSI at 60 reflects strong momentum, and the long-term ascending support trendline around 1.14 continues to anchor the bullish tilt. A break above 1.20 is needed to really confirm any long term bullish trend.
USD/JPY remains in a bullish consolidation phase, with price and VWAP converging around 159 as the pair consolidates between the ascending support trendline below and the flat horizontal resistance. The RSI at 50 is perfectly neutral. The low volatility ‘squeeze’ of the bands suggest a range expansion is coming - but can never know which way in advance, except that the upside has the support of the long term uptrend.
Gold is in a bearish correction phase, trading above the VWAP. It has broken the descending trendline from the February peak but with little follow-though. The RSI at 52 is mildly constructive, and the long-term ascending support trendline from late 2025 continues to underpin the broader structure. A sustained break above the descending trendline opens the path back toward all-time highs, whereas a failure opens up the March low.
Brent Crude broke below its triangle pattern but with little follow through, trading below the VWAP. Price is drifting around the lower trendline, and the RSI at 45 reflects fading momentum. The range holds while ascending support remains intact, but a sustained break below it would be a significant bearish development; a break of the upper trendline targets a retest of 11,000+.
Technical Analysis Weekly (05-04-26)Wall Street is pulling back within its near term bearish trend, trading just below the VWAP as price attempts to stabilise following the sharp multi-week selloff. The RSI has recovered to the mid-40s, suggesting some tentative buying interest is emerging, though the index needs a convincing close back above the VWAP to confirm a meaningful shift.
Germany 40 is in a bearish correction phase, trading just below the VWAP as it attempts to find a base after the brutal selloff of recent weeks. The RSI has recovered to near 50, indicating that the worst of the selling pressure may have passed, though sellers will likely defend the VWAP and the downtrend line above remains a significant hurdle.
UK 100 has bounced strongly from its recent lows and is now trading above the VWAP in a pullback phase within the broader bearish trend. The RSI has recovered to nearly 60, reflecting the strength of the rebound. However, the index faces resistance near the prior breakdown zone, and whether this bounce becomes a sustained recovery or a bear market rally will be the key question for the week ahead.
GBP/USD continues its sluggish bearish trend, while trading below the VWAP as the pair continues to drift lower from its February highs. The RSI remains in the low 40s, reflecting modest but persistent bearish pressure. The pair is approaching long-term support near 1.30, and a break of this level could accelerate selling, while a bounce would keep the broader sideways range intact.
EUR/USD is in a bearish correction phase, trading right on top of the VWAP as it consolidates the recent sharp decline from February highs. The RSI has stabilised in the mid-40s, suggesting the pace of selling has eased. A sustained move above 1.16 and down-trendline resistance would be needed to signal a more meaningful recovery, while the long-term uptrend support line around 1.14 remains the key level to watch on the downside.
USD/JPY continues its tight consolidation below the 160 threshold, with price and VWAP essentially aligned around 159.5 as the pair consolidates near multi-month highs. The RSI is in neutral-to-bullish territory, consistent with a measured pause rather than a reversal. A clear break above 160.50 resistance would be a significant bullish development, while a failure here risks a retest of the 157-158 support zone.
Gold remains in a broader sideways range, having gathered steam above 4500, trading on top of the VWAP and a down trendline. The RSI has recovered to the mid-40s, offering some relief. Bulls will probably need to see a sustained reclaim of the 5,000 level to signal the downtrend is losing momentum.
Brent Crude continues inside a triangle pattern as price makes higher lows towards the double top formed at 120. The RSI sits in the low 60s, consistent with healthy momentum after the surge a month ago. Price is consolidating within the upper half of the recent range. A breakout higher from the triangle would target new highs, while a break of VWAP support would put the bullish thesis under pressure.
Technical Analysis Weekly (30-02-26)Germany 40 continues to trade well below the VWAP as bearish momentum persists following the sharp sell-off of recent weeks. The RSI remains depressed but has recovered from its most extreme readings. The index remains in an impulsive mode, with the VWAP and downtrend line acting as the first meaningful resistance overhead.
Wall Street remains under pressure, continuing to trade below the VWAP as the bearish trend persists. The RSI is holding in oversold-adjacent territory, suggesting sellers remain in control, though the pace of decline has moderated slightly. A reclaim of the VWAP is needed to shift the near-term bias.
UK 100 has pulled back sharply from its all-time highs and is trading below the VWAP, though it is showing tentative signs of stabilisation after the recent steep decline. The RSI has recovered from its most oversold levels and is now in moderate territory, suggesting selling pressure may be easing. The index remains in an impulsive phase until a sustained move back above the VWAP.
GBP/USD has been trading in a 200-pip range for most of March, now trading below a flat VWAP. The RSI has softened to 40 after touching 50, reflecting the modest but steady bearish pressure. The long-term range remains intact, and the pair will need to take out the high or lows of the range to start a new trend.
EUR/USD is back below the VWAP after a strong bounce off long term support ~1.14 with the bearish trend persisting. The RSI is hovering around the mid-40s, reflecting a neutral-to-bearish bias rather than extreme pessimism. A move back above 1.16 would be required to shift the near-term outlook, while a break below the recent swing low at 1.14 would reinforce the downtrend.
USD/JPY continues to trade near its highs but volatility has compressed around 160 and it is only just above the VWAP. The RSI remains comfortably above the midpoint, suggesting healthy momentum. A decisive break and hold above 160 would be a significant technical development, while a fakeout would open a return to 2026 lows.
Gold remains well below the VWAP, though selling pressure has eased after a long pin-bar ~4100. The RSI has recovered only slightly from oversold territory, suggesting the lows might still not be in. However, bulls will need to reclaim the VWAP to signal a genuine recovery is underway rather than just a temporary pause in the downtrend.
Brent Crude is sitting inside a volatile triangle pattern as it continues to trade above the VWAP, maintaining the broader bullish structure. The RSI has eased from overbought levels into more neutral territory, consistent with a healthy consolidation after the explosive move higher. The uptrend means a breakout is higher probability but a breakdown through the triangle support and VWAO could signal a double top.
Technical Analysis Weekly (16-03-26)Germany 40 is in a bearish correction phase, having pulled back sharply from its recent highs and falling well below the VWAP. Price is attempting to stabilise near the lower standard deviation band, but RSI remains subdued in the mid-30s, indicating that sellers retain the upper hand and any recovery could face significant overhead resistance.
Wall Street remains in a bearish correction phase, trading significantly below its VWAP with no clear sign of stabilisation. RSI has recovered slightly from deeply oversold levels but remains weak, and price continues to hover near the lower boundary of its volatility bands, suggesting the path of least resistance is still lower.
UK 100 is in a bearish correction phase, having pulled back from its highs and trading below the VWAP. While RSI has bounced off recent lows and is recovering toward the midpoint, price action remains subdued, with the index consolidating in the lower half of its volatility range as it searches for a base.
GBP/USD remains in a bearish near term trend within its broader sideways range, trading below the VWAP as it consolidates its recent losses. RSI has recovered from oversold levels into the low 40s, suggesting some stabilisation, though the pair remains vulnerable to further weakness while it holds beneath the VWAP.
EUR/USD remains in a bearish impulsive phase, extending its decline below the VWAP as momentum continues to deteriorate. RSI is holding in oversold territory, reflecting persistent selling pressure, with price testing key long-term support levels as the pair looks increasingly stretched to the downside.
USD/JPY continues in its bullish trend and is in a pullback phase, with price holding above the VWAP after a brief dip lower. RSI is strengthening in the low 60s, and price is pushing toward the upper resistance band, suggesting the broader uptrend remains intact and a test of 160 is plausible in the near term.
Gold remains in a broader bullish trend but has entered a corrective phase, pulling back below the VWAP after failing to sustain its early-year highs. RSI has eased to the mid-40s, reflecting fading momentum, with price consolidating within a narrowing structure as the metal awaits a directional catalyst.
Brent Crude remains in a powerful bullish impulsive phase, trading well above its VWAP following a significant breakout. RSI has eased from extreme overbought levels toward 70 as the market digests recent gains, though the trend remains firmly upward with price holding near the top of its volatility range.
Technical Analysis Weekly (09-03-26)Wall Street has deepened its correction, now trading well below its VWAP as selling pressure accelerates. The trend has turned bearish, with RSI approaching oversold territory and price breaking through key support levels near the lower volatility band.
Germany 40 has broken sharply lower in an impulsive bearish move, falling well beneath its VWAP as momentum collapses. RSI has plunged into oversold territory, reflecting the severity of the selloff, with the index now testing multi-month lows near the lower standard deviation band.
UK 100 has reversed sharply from recent highs and entered a deep correction, likely a new bearish trend, now trading below the VWAP after breaking a key ascending trendline. Momentum has deteriorated significantly, with RSI retreating toward oversold levels as the index gives back a substantial portion of its prior advance.
GBP/USD continues in its bearish impulsive phase, accelerating lower after breaking beneath a prior consolidation zone. Price is trading significantly below the VWAP, with RSI in oversold territory reinforcing sustained downside pressure as the pair tests critical support around the lower volatility band.
EUR/USD has shifted into a bearish impulsive phase following a sharp rejection from its February highs, with price now trading aggressively below the VWAP. Momentum is deeply negative with RSI near oversold levels, as the pair cuts through successive support zones in an accelerating downtrend.
USD/JPY has shifted into a more bullish setup, but still within its sideways range with breaking back above the VWAP but below YTD highs. Momentum is strengthening, with RSI pushing higher as the pair recovers from its February lows and approaches key resistance near the upper standard deviation band.
Gold remains in a broader bullish trend but has entered a range-bound phase, consolidating near the VWAP following its sharp early-year rally. Momentum has cooled to neutral with RSI near the midpoint, as the metal digests gains and awaits a fresh catalyst to determine the next directional move.
Brent Crude has surged in a powerful impulsive bullish breakout, trading well above its VWAP with RSI in extreme overbought territory. The weekly chart confirms the move is a significant structural breakout, though the degree of extension from the mean suggests elevated risk of a sharp mean-reversion pullback in the near term.
Technical Analysis Weekly (02-03-26)Germany 40 is currently range-bound, oscillating within a sideways trend. Price action is trading slightly below the VWAP, reflecting neutral momentum as the index continues to consolidate between established support and resistance levels.
Wall Street has entered a correction phase, trading below its short-term VWAP despite the broader bullish trend. Momentum has cooled significantly, with indicators suggesting the index is searching for a floor near the lower boundary of its volatility bands.
UK 100 remains in a strong bullish trend but has entered a pullback phase. While it maintains its position above the VWAP, momentum is reaching elevated levels, suggesting the index is testing the upper limits of its current impulsive move.
GBP/USD has shifted into a bearish trend, with price action moving impulsively to the downside. The pair is trading well below its VWAP, and momentum indicators suggest heavy selling pressure as it approaches significant support levels.
EUR/USD is currently stuck in a sideways range, trading below its 20-day VWAP. Momentum is relatively weak, with the pair showing signs of consolidation as it tests the lower half of its current trading channel.
USD/JPY is positioned in the upper portion of its current sideways range. While the broader trend is neutral, short-term momentum is positive, with the price holding above the VWAP and trending toward the upper resistance ceiling.
Gold is in a powerful impulsive phase, trading significantly above its VWAP and appears on course to test record highs. Bullish momentum is strong, pushing the price toward the top of its standard deviation bands as the metal continues its upward trajectory.
Brent Crude has seen an aggressive breakout and is trading in a highly impulsive bullish phase. While the trend is strongly upward, momentum indicators have entered overbought territory, suggesting the market is significantly stretched relative to its mean.
Technical Analysis Weekly (23-02-26)Germany 40 has broken above the 25k psychological level and is trading at 25,118, now above its VWAP of 24,874. The RSI has ticked up to 56, reflecting improving momentum as the index targets the upper resistance band at 25,332. Support has risen to 24,416, with bulls looking to consolidate above the 25k level as a new base.
Wall Street has continued to consolidate below the 50k resistance level, with price slipping back toward the VWAP at 49,378. The RSI has eased further to 49, now sitting at neutral territory, suggesting buying momentum has faded. Bulls will need to defend the 48,714 support level to prevent a deeper pullback, while a recovery above 50,362 would be required to resume the uptrend.
UK 100 remains the standout performer, continuing its impulsive phase and trading near all-time highs at 10,669. It is well above its VWAP (10,439), and the RSI of 68 indicates strong, persistent buying pressure approaching overbought territory. Resistance is now eyed at 10,740, while support is significantly lower at 10,138, reflecting the strength of the underlying trend.
GBP/USD has extended into a more prolonged correction, still trading below the 20-day VWAP (1.3604) at 1.3513. The RSI has dropped to 44, signalling that bearish momentum is building. The key support level to watch is 1.3457, which bulls must defend to prevent further downside. A reclaim of the VWAP would be the first signal that the pullback is coming to an end.
EUR/USD has failed to retake its VWAP of 1.1833, trading at 1.1809 as selling pressure has resumed. The RSI continues to tread water in neutral-to-bearish territory, suggesting the consolidation phase may be giving way to a deeper correction. The 1.1754 support level is the key floor to watch, with resistance capping upside attempts at 1.1912.
USD/JPY has stabilised and is now trading near the VWAP (154.78). The RSI has recovered to 49, suggesting the earlier bearish momentum has eased. The pair remains in a sideways range, with support at 151.85 and resistance at 157.89. A decisive break in either direction will be needed to establish a clearer trend.
Gold is trading decisively over the 5k threshold and above its VWAP (4,962) breaking out to a near 1-month high. The RSI at 58 indicates that momentum remains positive, though still within the realms of a consolidation. The 5,211 resistance remains the key level to reclaim, while support sits at 4,714.
Brent Crude has pushed further above the VWAP (6,836), now trading at 7,071 and testing the key $70.00 resistance-turned-support. The RSI has risen to 61, reflecting strengthening bullish momentum. A sustained break above 7,162 would open the path to further gains, while support remains consistent at 6,513 as the uptrend remains intact.
Technical Analysis Weekly (16-02-26)Germany 40 continues to hover just below the 25k psychological level. It has successfully stayed above the VWAP of 24,758 following its recent correction. With the RSI sitting at 52, momentum is neutral-to-positive as the index looks for a catalyst to break toward the upper resistance band at 25,153.
Wall Street has pulled back from its recent attempt at the 50k resistance level and is now consolidating. It remains above the VWAP, maintaining its broader bullish structure. RSI has cooled to 54, suggesting a transition from aggressive buying to a more neutral, healthy consolidation phase.
UK 100 is currently the standout performer, trading in an impulsive phase near all-time highs. It is well above its VWAP (10,312), and the RSI of 62 indicates strong buying pressure. Resistance is now eyed at the 10,560 level, while support has moved up significantly to 10,063.
GBP/USD has dipped slightly below the 20-day VWAP (1.3672) as it undergoes a shallow pullback. Despite this, the RSI remains above 50, and the long-term trend remains bullish. Support at 1.3522 remains the key floor for bulls to defend to keep the uptrend intact.
EUR/USD is tightly wound around its VWAP of 1.1852, showing signs of heavy consolidation after its recent volatility. The RSI at 55 confirms a slight bullish bias, but the pair is currently trapped in a narrow range between the 1.1744 support and 1.1993 resistance.
USD/JPY remains in a sideways trend but is showing increasing bearish momentum, with price now trading below the VWAP (154.69). The RSI has dropped to 38, signaling that selling pressure is rising. A test of the major support at 151.38 could be on the cards if the price cannot reclaim the VWAP.
Gold has stabilised following the extreme volatility seen in early February. It is trading back above the 4,900 level and the VWAP (4,923). Momentum has recovered with the RSI at 53, suggesting the worst of the sell-off may be over, though resistance at 5,391 remains a significant hurdle.
Brent Crude is holding its bullish breakout, though price action has become more range-bound. It continues to trade just above the VWAP of 6,742. With an RSI of 55, the uptrend is still valid, though the $70.00 level (7,007 on the chart) remains a formidable resistance zone.
Technical Analysis WeeklyGermany 40 remains in a bullish trend and is currently undergoing a correction phase, trading at 24,942, slightly below its VWAP of 25,018. The RSI at 54.0 indicates mild bullish momentum. Support is at 24,273, with resistance at 25,720.
UK 100 continues in a bullish trend and is in a strong impulsive phase. Price is at 10,179, above its VWAP of 10,078, showing firm strength. The RSI at 66.1 suggests continued bullish momentum. Support is at 9,837, and resistance is at 10,319.
Wall Street is experiencing a correction within its bullish trend, trading at 48,899, slightly below its VWAP of 49,029. The RSI of 51.2 indicates balanced momentum. Support lies at 48,047, with resistance at 50,012.
Brent Crude is showing fresh bullish momentum but has yet to definitively break the longer-term downtrend. It is trading at 6,328 above its VWAP of 6,218. The RSI at 54.8 shows steady upside interest. Support is at 5,903, while resistance is at 6,532.
Gold remains in a bullish impulsive phase, trading at 4,667 near a record high and above its VWAP of 4,491. The RSI at 72.9 signals strong momentum and an overbought market. Support sits at 4,253, and resistance is at 4,728.
EUR/USD has turned bearish in the short term but remains in a broader range, trading at 1.1622, well below its VWAP of 1.6844. The RSI at 39.4 shows subdued market interest. Support is at 1.1571, and resistance is at 1.1798.
GBP/USD has slipped into a bearish minor trend within the broader range, currently at 1.3404, just under the VWAP of 1.3449. The RSI of 47.8 reflects neutral to slightly bearish sentiment. Support is at 1.3361, with resistance at 1.3535.
USD/JPY remains bullish and in a pullback that is testing prior highs as support, trading at 158.03, above the VWAP of 157.28. The RSI at 57.3 supports ongoing upward pressure. Support is at 155.51, and resistance is at 159.05.