FED, one last rate hike? Not so sure.So it is done: Kevin Warsh’s Fed has raised the federal funds rate from 3.75% to 4%, unveiled its new monetary policy outlook and updated its macroeconomic projections. The Fed Chair once again reminded us that the central bank would remain “data dependent” and that it was still committed to supporting the proper functioning of the interbank market.
Are the Fed’s new monetary policy projections a source of pressure or relative relief for financial markets, which have been under pressure from the sharp rise in bond yields and oil and natural gas prices?
Let’s review 4 major dimensions that have been updated and assess what they tell us.
1) DOT PLOTS and the balance of power among the 12 voting members of the FOMC
Since Kevin Warsh took over as Fed Chair, the balance of power within the FOMC has been one of the most important aspects to monitor. Will there be further rate hikes? Could a status quo quickly regain the upper hand? There are 12 members on the FOMC, and a majority is required to make a monetary policy decision. In the event of a tie (6 VS 6), Kevin Warsh has the deciding vote.
On Wednesday, September 16, all 12 out of 12 voted in favor of a rate hike, so there was complete convergence among the FOMC voting members.
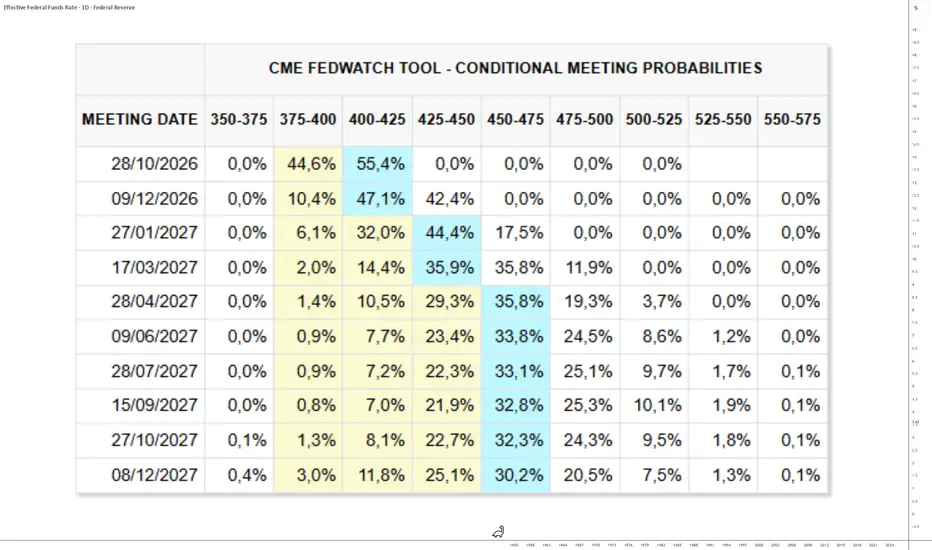
The updated DOT PLOTS show that the median FOMC projection now stands at an interest rate of 4.1%, meaning that one final rate hike remains possible by the end of the year or in 2027.
2) The Fed’s inflation and employment projections
The Fed faces the same uncertainty as the rest of the world: when will the Strait of Hormuz reopen, and when will oil and gas prices cease to be a source of upward pressure on headline inflation?
The Fed has expressed confidence that core inflation will return to the 2% target by the end of 2027/2028, but this requires avoiding a prolonged geopolitical shock. Core inflation remains broadly under control, and the rise in oil prices has not yet affected underlying inflation. This is, in itself, a source of optimism for the Fed.
3) How the market (high finance) is positioning itself on the Fed’s rate outlook, through futures contracts on the federal funds rate
The price of federal funds rate futures traded on the Chicago Mercantile Exchange (CME) helps us understand how institutional investors anticipate the future path of the Fed’s interest rate. Following the Fed’s monetary policy decision, the market estimates that one final rate hike could take place by the end of the year, but the status quo could regain the upper hand depending on the evolution of oil prices and core inflation.
4) The technical signals from the 2-year US Treasury yield
The 2-year US Treasury yield is the one that best anticipates the future path of the US federal funds rate. If it is above the Fed’s policy rate, it means that the market is pricing in a rate hike, and vice versa.
The Fed’s policy rate is now 4%, while the US 2-year yield stands at 4.70% following the Fed’s monetary policy decision. The market therefore considers it likely that the Fed will raise its policy rate again by the end of the year.
DISCLAIMER:
This content is intended for individuals who are familiar with financial markets and instruments and is for information purposes only. The presented idea (including market commentary, market data and observations) is not a work product of any research department of Swissquote or its affiliates. This material is intended to highlight market action and does not constitute investment, legal or tax advice. If you are a retail investor or lack experience in trading complex financial products, it is advisable to seek professional advice from licensed advisor before making any financial decisions.
This content is not intended to manipulate the market or encourage any specific financial behavior.
Swissquote makes no representation or warranty as to the quality, completeness, accuracy, comprehensiveness or non-infringement of such content. The views expressed are those of the consultant and are provided for educational purposes only. Any information provided relating to a product or market should not be construed as recommending an investment strategy or transaction. Past performance is not a guarantee of future results.
Swissquote and its employees and representatives shall in no event be held liable for any damages or losses arising directly or indirectly from decisions made on the basis of this content.
The use of any third-party brands or trademarks is for information only and does not imply endorsement by Swissquote, or that the trademark owner has authorised Swissquote to promote its products or services.
Swissquote is the marketing brand for the activities of Swissquote Bank Ltd (Switzerland) regulated by FINMA, Swissquote Capital Markets Limited regulated by CySEC (Cyprus), Swissquote Bank Europe SA (Luxembourg) regulated by the CSSF, Swissquote Ltd (UK) regulated by the FCA, Swissquote Financial Services (Malta) Ltd regulated by the Malta Financial Services Authority, Swissquote MEA Ltd. (UAE) regulated by the Dubai Financial Services Authority, Swissquote Pte Ltd (Singapore) regulated by the Monetary Authority of Singapore, Swissquote Asia Limited (Hong Kong) licensed by the Hong Kong Securities and Futures Commission (SFC) and Swissquote South Africa (Pty) Ltd supervised by the FSCA.
Products and services of Swissquote are only intended for those permitted to receive them under local law.
All investments carry a degree of risk. The risk of loss in trading or holding financial instruments can be substantial. The value of financial instruments, including but not limited to stocks, bonds, cryptocurrencies, and other assets, can fluctuate both upwards and downwards. There is a significant risk of financial loss when buying, selling, holding, staking, or investing in these instruments. SQBE makes no recommendations regarding any specific investment, transaction, or the use of any particular investment strategy.
CFDs are complex instruments and come with a high risk of losing money rapidly due to leverage. The vast majority of retail client accounts suffer capital losses when trading in CFDs. You should consider whether you understand how CFDs work and whether you can afford to take the high risk of losing your money.
Digital Assets are unregulated in most countries and consumer protection rules may not apply. As highly volatile speculative investments, Digital Assets are not suitable for investors without a high-risk tolerance. Make sure you understand each Digital Asset before you trade.
Cryptocurrencies are not considered legal tender in some jurisdictions and are subject to regulatory uncertainties.
The use of Internet-based systems can involve high risks, including, but not limited to, fraud, cyber-attacks, network and communication failures, as well as identity theft and phishing attacks related to crypto-assets.
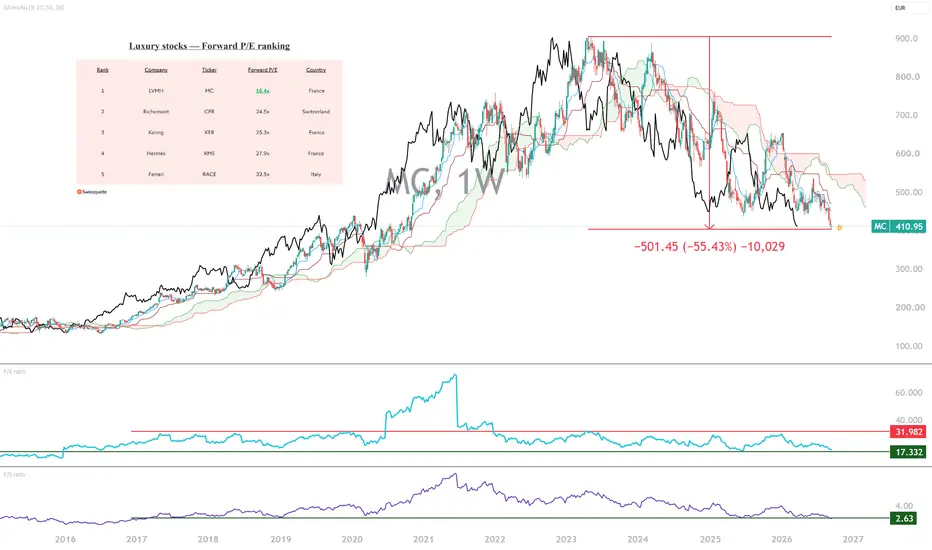
LVMH, after the fall, an opportunity?LVMH’s share price has lost 55% since its all-time high in spring 2023, with the price falling from more than €900 to €400. LVMH is by far the world’s leading company in the luxury sector, so after such a sharp stock market decline, could the stock once again soon represent an opportunity?
To answer this question analytically, I suggest looking at stock market valuation ratios and technical analysis signals from the financial markets.
· Stock market valuation ratios: forward P/E, traditional P/E and Price-to-Sales
· Medium- and long-term technical analysis signals based on the weekly Japanese candlestick chart
But first, let us recall why LVMH’s share price has lost more than 50% since its 2023 record high.
The main reason is the sharp reversal in the luxury cycle after several exceptional years of growth. From 2023 onwards, demand gradually normalized, with a particularly pronounced slowdown in luxury consumption in China, a strategic market for LVMH. The group also suffered from the consequences of the very significant price increases implemented in recent years, which gradually pushed part of its so-called “aspirational” customer base away. In 2024, LVMH’s revenue therefore declined by 2%, followed by another 1% decline in 2025, while recurring operating profit suffered more significantly.
This was compounded by a less favorable macroeconomic environment, geopolitical and trade tensions, as well as uncertainties surrounding consumer spending in the United States and Asia. The stock market primarily penalized the decline in earnings expectations: LVMH was valued at very high multiples at its 2023 peak, based on growth that appeared capable of continuing for a prolonged period. When that growth reversed, the contraction in the valuation multiple amplified the decline in earnings.
The question now is whether this sharp decline has sufficiently priced in the current difficulties to once again offer an attractive entry point.
First piece of good news: from a stock valuation perspective, LVMH is once again an opportunity, especially compared with its competitors.
The table below shows the global top 5 listed companies in the luxury sector, together with their forward P/E ratios. After a 55% decline from its all-time high, LVMH now trades at a significant discount to its competitors in terms of stock market valuation.
However, before returning to a buying position, the technical trend needs to stop being bearish, and the Ichimoku system can be useful in identifying this. The bearish trend will be over when the market is able to move back above the weekly Kumo of the Ichimoku system.
The chart below shows LVMH’s weekly Japanese candlesticks, together with the traditional P/E, forward P/E and Price-to-Sales valuation ratios. The stock remains in a bearish trend as long as the price trades below the weekly cloud of the Ichimoku system.
DISCLAIMER:
This content is intended for individuals who are familiar with financial markets and instruments and is for information purposes only. The presented idea (including market commentary, market data and observations) is not a work product of any research department of Swissquote or its affiliates. This material is intended to highlight market action and does not constitute investment, legal or tax advice. If you are a retail investor or lack experience in trading complex financial products, it is advisable to seek professional advice from licensed advisor before making any financial decisions.
This content is not intended to manipulate the market or encourage any specific financial behavior.
Swissquote makes no representation or warranty as to the quality, completeness, accuracy, comprehensiveness or non-infringement of such content. The views expressed are those of the consultant and are provided for educational purposes only. Any information provided relating to a product or market should not be construed as recommending an investment strategy or transaction. Past performance is not a guarantee of future results.
Swissquote and its employees and representatives shall in no event be held liable for any damages or losses arising directly or indirectly from decisions made on the basis of this content.
The use of any third-party brands or trademarks is for information only and does not imply endorsement by Swissquote, or that the trademark owner has authorised Swissquote to promote its products or services.
Swissquote is the marketing brand for the activities of Swissquote Bank Ltd (Switzerland) regulated by FINMA, Swissquote Capital Markets Limited regulated by CySEC (Cyprus), Swissquote Bank Europe SA (Luxembourg) regulated by the CSSF, Swissquote Ltd (UK) regulated by the FCA, Swissquote Financial Services (Malta) Ltd regulated by the Malta Financial Services Authority, Swissquote MEA Ltd. (UAE) regulated by the Dubai Financial Services Authority, Swissquote Pte Ltd (Singapore) regulated by the Monetary Authority of Singapore, Swissquote Asia Limited (Hong Kong) licensed by the Hong Kong Securities and Futures Commission (SFC) and Swissquote South Africa (Pty) Ltd supervised by the FSCA.
Products and services of Swissquote are only intended for those permitted to receive them under local law.
All investments carry a degree of risk. The risk of loss in trading or holding financial instruments can be substantial. The value of financial instruments, including but not limited to stocks, bonds, cryptocurrencies, and other assets, can fluctuate both upwards and downwards. There is a significant risk of financial loss when buying, selling, holding, staking, or investing in these instruments. SQBE makes no recommendations regarding any specific investment, transaction, or the use of any particular investment strategy.
CFDs are complex instruments and come with a high risk of losing money rapidly due to leverage. The vast majority of retail client accounts suffer capital losses when trading in CFDs. You should consider whether you understand how CFDs work and whether you can afford to take the high risk of losing your money.
Digital Assets are unregulated in most countries and consumer protection rules may not apply. As highly volatile speculative investments, Digital Assets are not suitable for investors without a high-risk tolerance. Make sure you understand each Digital Asset before you trade.
Cryptocurrencies are not considered legal tender in some jurisdictions and are subject to regulatory uncertainties.
The use of Internet-based systems can involve high risks, including, but not limited to, fraud, cyber-attacks, network and communication failures, as well as identity theft and phishing attacks related to crypto-assets.
FED tonight: the three signals to watch firstIt’s D-Day. Today is Wednesday, September 16, and it is the Federal Reserve’s monetary policy decision under Kevin Warsh. This is the most important fundamental event of this September, given the high degree of uncertainty surrounding what the Fed will do and its monetary policy outlook for the months ahead.
The combined rise in oil and gas prices and market interest rates is putting strong pressure on the Fed to raise the federal funds rate. However, the balance of power within the FOMC remains uncertain, and the status quo scenario is still possible.
The Fed’s monetary policy announcements tonight will have an impact on all asset classes, including equities, bonds, foreign exchange, commodities, and cryptocurrencies.
Will the Fed be restrictive or accommodative in its monetary policy outlook through the end of the year?
To answer this question, the following fundamental and technical data points will need to be closely monitored tonight:
1. The evolution of the DOT PLOTS
The first signal to watch will be the evolution of the “dot plots,” which provide insight into individual FOMC members’ expectations regarding the future level of policy rates. The key issue will be determining whether the median projection moves toward higher or lower rates by year-end and in 2027. A dot plot higher than expected would be interpreted as a restrictive signal, while a decline in the median would strengthen the scenario of monetary easing. It will also be important to observe the dispersion of the dots, as this will provide an important indication of the degree of division within the FOMC.
2. The trend in the US 2-year Treasury yield and its positioning relative to the US federal funds rate
The US 2-year Treasury yield will also be a particularly important market indicator. Highly sensitive to monetary policy expectations, it will make it possible to gauge investors’ immediate reaction to the Fed’s statement and projections. Above all, attention should be paid to its spread versus the federal funds rate. If the 2-year yield remains significantly above the policy rate, the market will continue to price in a relatively restrictive monetary policy. Conversely, a rapid decline in the 2-year yield would signal that investors are anticipating more rate cuts over the coming months.
3. The update to the Fed’s macroeconomic projections, particularly regarding core inflation
Finally, the Fed’s new economic projections will be decisive in understanding its reaction function. Changes in core inflation forecasts will be particularly important in a context marked by rising energy prices. An upward revision to inflation, combined with resilient growth, would reinforce the scenario of a more restrictive Fed. Conversely, if the Fed maintains a disinflationary trajectory while lowering its growth forecasts or showing deterioration in the labor market, the market could anticipate a more accommodative policy.
It is therefore the combination of these three signals — dot plots, the US 2-year yield, and macroeconomic projections — that will make it possible to determine the Fed’s true message tonight.
DISCLAIMER:
This content is intended for individuals who are familiar with financial markets and instruments and is for information purposes only. The presented idea (including market commentary, market data and observations) is not a work product of any research department of Swissquote or its affiliates. This material is intended to highlight market action and does not constitute investment, legal or tax advice. If you are a retail investor or lack experience in trading complex financial products, it is advisable to seek professional advice from licensed advisor before making any financial decisions.
This content is not intended to manipulate the market or encourage any specific financial behavior.
Swissquote makes no representation or warranty as to the quality, completeness, accuracy, comprehensiveness or non-infringement of such content. The views expressed are those of the consultant and are provided for educational purposes only. Any information provided relating to a product or market should not be construed as recommending an investment strategy or transaction. Past performance is not a guarantee of future results.
Swissquote and its employees and representatives shall in no event be held liable for any damages or losses arising directly or indirectly from decisions made on the basis of this content.
The use of any third-party brands or trademarks is for information only and does not imply endorsement by Swissquote, or that the trademark owner has authorised Swissquote to promote its products or services.
Swissquote is the marketing brand for the activities of Swissquote Bank Ltd (Switzerland) regulated by FINMA, Swissquote Capital Markets Limited regulated by CySEC (Cyprus), Swissquote Bank Europe SA (Luxembourg) regulated by the CSSF, Swissquote Ltd (UK) regulated by the FCA, Swissquote Financial Services (Malta) Ltd regulated by the Malta Financial Services Authority, Swissquote MEA Ltd. (UAE) regulated by the Dubai Financial Services Authority, Swissquote Pte Ltd (Singapore) regulated by the Monetary Authority of Singapore, Swissquote Asia Limited (Hong Kong) licensed by the Hong Kong Securities and Futures Commission (SFC) and Swissquote South Africa (Pty) Ltd supervised by the FSCA.
Products and services of Swissquote are only intended for those permitted to receive them under local law.
All investments carry a degree of risk. The risk of loss in trading or holding financial instruments can be substantial. The value of financial instruments, including but not limited to stocks, bonds, cryptocurrencies, and other assets, can fluctuate both upwards and downwards. There is a significant risk of financial loss when buying, selling, holding, staking, or investing in these instruments. SQBE makes no recommendations regarding any specific investment, transaction, or the use of any particular investment strategy.
CFDs are complex instruments and come with a high risk of losing money rapidly due to leverage. The vast majority of retail client accounts suffer capital losses when trading in CFDs. You should consider whether you understand how CFDs work and whether you can afford to take the high risk of losing your money.
Digital Assets are unregulated in most countries and consumer protection rules may not apply. As highly volatile speculative investments, Digital Assets are not suitable for investors without a high-risk tolerance. Make sure you understand each Digital Asset before you trade.
Cryptocurrencies are not considered legal tender in some jurisdictions and are subject to regulatory uncertainties.
The use of Internet-based systems can involve high risks, including, but not limited to, fraud, cyber-attacks, network and communication failures, as well as identity theft and phishing attacks related to crypto-assets.
ORACLE, has the bottom been reached?Oracle’s share price lost more than 66% between its all-time high in September 2025 and its low point in July 2026.
Can we now say that the stock has finally formed a major bottom and that the underlying bullish trend has resumed?
To answer this question, I will review the fundamental and technical factors that I consider relevant:
· Fundamental technical analysis of financial markets: the long-term signals on the weekly chart
· Stock valuation data and the fundamental outlook for Oracle
From a fundamental perspective, the Oracle story remains particularly interesting. The company is undergoing a major transformation, with a spectacular acceleration in its cloud business. In the fourth quarter of fiscal year 2026, cloud revenue increased by 47% year-on-year and cloud infrastructure revenue by 93%. For the full fiscal year, revenue increased by 17%, while cloud revenue rose by 39%.
Even more impressive, Remaining Performance Obligations (RPO) reached $638 billion, up 363% year-on-year. This figure represents a major fundamental argument in favor of continued future growth.
The main risk, however, lies in how this growth is being financed. Oracle is investing heavily in infrastructure dedicated to artificial intelligence, which resulted in negative free cash flow of $23.7 billion in fiscal 2026 and significant reliance on debt financing.
The table below ranks US companies in the infrastructure software sector according to their forward P/E valuation ratio. After this 60% decline from its all-time high, Oracle’s stock is once again inexpensive according to this fundamental valuation metric.
Finally, the valuation now appears much less demanding than it was at the 2025 peak. According to the market data used here, the forward P/E stands at around 15x, which is particularly low for a company whose cloud growth prospects remain so strong.
To conclude from a technical analysis perspective, several signals are favorable for the formation of a major bottom: bullish price/momentum divergences on the weekly timeframe (see the main chart of this analysis), as well as long-term technical support levels that were reached between $110 and $120, including the 200-week moving average and the monthly Kumo of the Ichimoku system.
The chart below shows the monthly Japanese candlesticks of ORACLE stock together with the monthly Kumo (Ichimoku system), which is acting as long-term support.
DISCLAIMER:
This content is intended for individuals who are familiar with financial markets and instruments and is for information purposes only. The presented idea (including market commentary, market data and observations) is not a work product of any research department of Swissquote or its affiliates. This material is intended to highlight market action and does not constitute investment, legal or tax advice. If you are a retail investor or lack experience in trading complex financial products, it is advisable to seek professional advice from licensed advisor before making any financial decisions.
This content is not intended to manipulate the market or encourage any specific financial behavior.
Swissquote makes no representation or warranty as to the quality, completeness, accuracy, comprehensiveness or non-infringement of such content. The views expressed are those of the consultant and are provided for educational purposes only. Any information provided relating to a product or market should not be construed as recommending an investment strategy or transaction. Past performance is not a guarantee of future results.
Swissquote and its employees and representatives shall in no event be held liable for any damages or losses arising directly or indirectly from decisions made on the basis of this content.
The use of any third-party brands or trademarks is for information only and does not imply endorsement by Swissquote, or that the trademark owner has authorised Swissquote to promote its products or services.
Swissquote is the marketing brand for the activities of Swissquote Bank Ltd (Switzerland) regulated by FINMA, Swissquote Capital Markets Limited regulated by CySEC (Cyprus), Swissquote Bank Europe SA (Luxembourg) regulated by the CSSF, Swissquote Ltd (UK) regulated by the FCA, Swissquote Financial Services (Malta) Ltd regulated by the Malta Financial Services Authority, Swissquote MEA Ltd. (UAE) regulated by the Dubai Financial Services Authority, Swissquote Pte Ltd (Singapore) regulated by the Monetary Authority of Singapore, Swissquote Asia Limited (Hong Kong) licensed by the Hong Kong Securities and Futures Commission (SFC) and Swissquote South Africa (Pty) Ltd supervised by the FSCA.
Products and services of Swissquote are only intended for those permitted to receive them under local law.
All investments carry a degree of risk. The risk of loss in trading or holding financial instruments can be substantial. The value of financial instruments, including but not limited to stocks, bonds, cryptocurrencies, and other assets, can fluctuate both upwards and downwards. There is a significant risk of financial loss when buying, selling, holding, staking, or investing in these instruments. SQBE makes no recommendations regarding any specific investment, transaction, or the use of any particular investment strategy.
CFDs are complex instruments and come with a high risk of losing money rapidly due to leverage. The vast majority of retail client accounts suffer capital losses when trading in CFDs. You should consider whether you understand how CFDs work and whether you can afford to take the high risk of losing your money.
Digital Assets are unregulated in most countries and consumer protection rules may not apply. As highly volatile speculative investments, Digital Assets are not suitable for investors without a high-risk tolerance. Make sure you understand each Digital Asset before you trade.
Cryptocurrencies are not considered legal tender in some jurisdictions and are subject to regulatory uncertainties.
The use of Internet-based systems can involve high risks, including, but not limited to, fraud, cyber-attacks, network and communication failures, as well as identity theft and phishing attacks related to crypto-assets.
Fundamentals: Massive Market Impact This WeekThe trading week of September 14 will be the most important of the month in terms of major fundamental catalysts. The US Congress returns to legislative work on September 14, the vote on the Clarity Act takes place on September 15, the Fed announces its monetary policy decision on September 16, and the BoJ follows on September 18. Equities, the dollar, interest rates and bitcoin are all likely to be strongly impacted.
The first major event will take place on Monday, September 14, with the return of the US Congress after the summer recess. This return is particularly important for the cryptocurrency market because the Senate is scheduled to vote the following day on the CLARITY Act, the major piece of legislation designed to establish a clearer regulatory framework for crypto assets in the United States.
September 15 will therefore be a first high-stakes day for bitcoin and the broader crypto market. The expected vote is the Senate cloture vote. The bill needs 60 votes to move forward (there are 53 Republican senators, meaning 7 Democratic senators are needed to close debate). A positive outcome would represent a major regulatory step forward and could strengthen expectations of accelerating institutional adoption of crypto. Conversely, another failure would have a very negative short-term impact on the price of bitcoin and altcoins.
The table below presents the key fundamental events of this very busy week starting Monday, July 14, which will have a massive impact on the market.
But the real macroeconomic event of the week will probably be the Federal Reserve meeting on September 15 and 16. The market is currently divided over the direction of monetary policy and is waiting to assess the balance of power within the FOMC and the Fed’s new inflation expectations. So, will the Fed raise the federal funds rate this Wednesday, September 16, or maintain the status quo?
The Fed’s decision will therefore be decisive for bond yields and the dollar, but also for equity markets and bitcoin. A more restrictive Fed could trigger another rise in bond yields and put pressure on risk assets. Conversely, a more accommodative Fed could revive liquidity expectations and support markets.
Finally, the week will end with the Bank of Japan, which will hold its monetary policy meeting on September 17 and 18. Markets are currently pricing in a possible 25-basis-point rate hike to 1.25%. The yen has already appreciated sharply in recent days, raising the question of a potential unwinding of the carry trade.
Overall, we therefore have an exceptional succession of catalysts: the US Congress, the CLARITY Act, the Fed and then the BoJ. The transmission mechanisms will be different, but they all converge on the same markets: equities, bonds, the dollar, the yen and bitcoin.
This week will therefore need to be monitored with particular attention. It could genuinely mark a turning point for financial markets at the start of this September trading season.
DISCLAIMER:
This content is intended for individuals who are familiar with financial markets and instruments and is for information purposes only. The presented idea (including market commentary, market data and observations) is not a work product of any research department of Swissquote or its affiliates. This material is intended to highlight market action and does not constitute investment, legal or tax advice. If you are a retail investor or lack experience in trading complex financial products, it is advisable to seek professional advice from licensed advisor before making any financial decisions.
This content is not intended to manipulate the market or encourage any specific financial behavior.
Swissquote makes no representation or warranty as to the quality, completeness, accuracy, comprehensiveness or non-infringement of such content. The views expressed are those of the consultant and are provided for educational purposes only. Any information provided relating to a product or market should not be construed as recommending an investment strategy or transaction. Past performance is not a guarantee of future results.
Swissquote and its employees and representatives shall in no event be held liable for any damages or losses arising directly or indirectly from decisions made on the basis of this content.
The use of any third-party brands or trademarks is for information only and does not imply endorsement by Swissquote, or that the trademark owner has authorised Swissquote to promote its products or services.
Swissquote is the marketing brand for the activities of Swissquote Bank Ltd (Switzerland) regulated by FINMA, Swissquote Capital Markets Limited regulated by CySEC (Cyprus), Swissquote Bank Europe SA (Luxembourg) regulated by the CSSF, Swissquote Ltd (UK) regulated by the FCA, Swissquote Financial Services (Malta) Ltd regulated by the Malta Financial Services Authority, Swissquote MEA Ltd. (UAE) regulated by the Dubai Financial Services Authority, Swissquote Pte Ltd (Singapore) regulated by the Monetary Authority of Singapore, Swissquote Asia Limited (Hong Kong) licensed by the Hong Kong Securities and Futures Commission (SFC) and Swissquote South Africa (Pty) Ltd supervised by the FSCA.
Products and services of Swissquote are only intended for those permitted to receive them under local law.
All investments carry a degree of risk. The risk of loss in trading or holding financial instruments can be substantial. The value of financial instruments, including but not limited to stocks, bonds, cryptocurrencies, and other assets, can fluctuate both upwards and downwards. There is a significant risk of financial loss when buying, selling, holding, staking, or investing in these instruments. SQBE makes no recommendations regarding any specific investment, transaction, or the use of any particular investment strategy.
CFDs are complex instruments and come with a high risk of losing money rapidly due to leverage. The vast majority of retail client accounts suffer capital losses when trading in CFDs. You should consider whether you understand how CFDs work and whether you can afford to take the high risk of losing your money.
Digital Assets are unregulated in most countries and consumer protection rules may not apply. As highly volatile speculative investments, Digital Assets are not suitable for investors without a high-risk tolerance. Make sure you understand each Digital Asset before you trade.
Cryptocurrencies are not considered legal tender in some jurisdictions and are subject to regulatory uncertainties.
The use of Internet-based systems can involve high risks, including, but not limited to, fraud, cyber-attacks, network and communication failures, as well as identity theft and phishing attacks related to crypto-assets.
Will altseason return?Bitcoin’s bearish phase may well have ended on July 1, when BTC hit a low of $57,750. If this interpretation is confirmed, the latest bear market would rank among the shortest bearish episodes in cryptocurrency history.
At this stage, the scenario of a bear market ending remains my preferred working hypothesis. One technical element in particular supports this view: bitcoin continues to trade above its 200-day moving average, currently located around $70,000.
However, an important distinction must be made: the end of a bear market does not automatically mean that the next bull run has already begun.
The chart below, based on bitcoin’s weekly candles, helps visualize this technical setup.
To genuinely speak of a new major bullish phase, BTC will still need to break through a key technical resistance level at $82,800. Until this level is convincingly surpassed, it is preferable to remain cautious when assessing the broader trend.
Altcoins: could the early signs of a new altseason be emerging?
The previous bitcoin bull cycle, which extended from late 2022 to October 2025, had a rather unusual characteristic: it was not truly followed by an “altseason”, meaning a period during which major alternative cryptocurrencies massively outperform BTC.
However, this situation could change during the next major bullish cycle. The most important phase of this new cycle could develop in 2027 and 2028, and several chart-based factors are beginning to make the possibility of a strong altcoin comeback increasingly credible.
Two technical representations are particularly interesting.
The first is an absolute approach, based on the “OTHERS” index, which includes cryptocurrencies ranked outside the top 10 by market capitalization.
The second is a relative approach, based on the ratio between OTHERS and bitcoin. It directly measures the strength or weakness of altcoins relative to BTC.
Interestingly, these two charts currently share a common characteristic: they are both sitting on important long-term support zones and are gradually beginning to outline a bullish reversal structure.
This setup deserves close attention because, to some extent, it resembles the preparatory phases that preceded the major altcoin seasons of 2017 and 2021.
It is obviously too early to claim that a new altseason is a certainty. But if these technical structures are confirmed over the coming months, 2027 could well be the year when altcoins return to center stage.
DISCLAIMER:
This content is intended for individuals who are familiar with financial markets and instruments and is for information purposes only. The presented idea (including market commentary, market data and observations) is not a work product of any research department of Swissquote or its affiliates. This material is intended to highlight market action and does not constitute investment, legal or tax advice. If you are a retail investor or lack experience in trading complex financial products, it is advisable to seek professional advice from licensed advisor before making any financial decisions.
This content is not intended to manipulate the market or encourage any specific financial behavior.
Swissquote makes no representation or warranty as to the quality, completeness, accuracy, comprehensiveness or non-infringement of such content. The views expressed are those of the consultant and are provided for educational purposes only. Any information provided relating to a product or market should not be construed as recommending an investment strategy or transaction. Past performance is not a guarantee of future results.
Swissquote and its employees and representatives shall in no event be held liable for any damages or losses arising directly or indirectly from decisions made on the basis of this content.
The use of any third-party brands or trademarks is for information only and does not imply endorsement by Swissquote, or that the trademark owner has authorised Swissquote to promote its products or services.
Swissquote is the marketing brand for the activities of Swissquote Bank Ltd (Switzerland) regulated by FINMA, Swissquote Capital Markets Limited regulated by CySEC (Cyprus), Swissquote Bank Europe SA (Luxembourg) regulated by the CSSF, Swissquote Ltd (UK) regulated by the FCA, Swissquote Financial Services (Malta) Ltd regulated by the Malta Financial Services Authority, Swissquote MEA Ltd. (UAE) regulated by the Dubai Financial Services Authority, Swissquote Pte Ltd (Singapore) regulated by the Monetary Authority of Singapore, Swissquote Asia Limited (Hong Kong) licensed by the Hong Kong Securities and Futures Commission (SFC) and Swissquote South Africa (Pty) Ltd supervised by the FSCA.
Products and services of Swissquote are only intended for those permitted to receive them under local law.
All investments carry a degree of risk. The risk of loss in trading or holding financial instruments can be substantial. The value of financial instruments, including but not limited to stocks, bonds, cryptocurrencies, and other assets, can fluctuate both upwards and downwards. There is a significant risk of financial loss when buying, selling, holding, staking, or investing in these instruments. SQBE makes no recommendations regarding any specific investment, transaction, or the use of any particular investment strategy.
CFDs are complex instruments and come with a high risk of losing money rapidly due to leverage. The vast majority of retail client accounts suffer capital losses when trading in CFDs. You should consider whether you understand how CFDs work and whether you can afford to take the high risk of losing your money.
Digital Assets are unregulated in most countries and consumer protection rules may not apply. As highly volatile speculative investments, Digital Assets are not suitable for investors without a high-risk tolerance. Make sure you understand each Digital Asset before you trade.
Cryptocurrencies are not considered legal tender in some jurisdictions and are subject to regulatory uncertainties.
The use of Internet-based systems can involve high risks, including, but not limited to, fraud, cyber-attacks, network and communication failures, as well as identity theft and phishing attacks related to crypto-assets.
USA/JAPAN/FRANCE, the public debt challengeThe rise in long-term bond yields is currently a major fundamental challenge in the Western world. The accumulation of budget deficits each year is fueling public debt, which now exceeds 100% of GDP in most major Western economies.
This public debt generates an annual interest burden that takes up an increasingly large share of government spending, thereby reducing the financing available for the real economy.
In the United States, for example, the annual debt service burden related to interest payments represents 18% of the federal budget.
It is essentially because of this public debt trajectory that long-term yields are following a structurally upward trend, putting increasing pressure on governments and therefore on companies.
But the public debt situation and public debt service burden vary from one economy to another.
I therefore turned to a comparative analysis of the situations in the United States, Japan and France. When it comes to public debt, each of these three countries has both strengths and weaknesses.
France has public debt of around 117% of GDP, with an interest burden representing approximately 13% of the government budget. The French problem is above all the combination of a high budget deficit, weak economic growth and rising interest rates. Debt dynamics are therefore particularly difficult to stabilize without reducing the deficit.
The table below reveals the main information regarding public debt service in three major Western countries: the United States, Japan and France.
The United States presents a different situation. With public debt at around 125% of GDP, the level of indebtedness is high, but above all, the budget deficit remains extremely large. The interest burden has already reached approximately 18% of the federal budget, representing a genuine risk to US fiscal credibility. The United States nevertheless retains a considerable advantage: the dollar is the world's main reserve currency and the Treasury market remains extremely deep and liquid.
Japan is yet another different case. Its public debt reaches approximately 245% of GDP, by far the highest level among the three countries. Yet its interest burden represents only around 10.5% of the budget, notably thanks to still relatively low interest rates. The Japanese risk is therefore less about the current level of the interest burden than about the speed at which it could increase if long-term yields continue to rise.
Finally, foreign ownership is another important factor. It is much higher in France, at around 56%, than in the United States, at around 30%, and Japan, at around 12.5%. A strong reliance on foreign investors can make debt financing more sensitive to a loss of confidence.
Ultimately, Japan has the largest debt, the United States has the heaviest interest burden, and France currently appears particularly vulnerable to the combination of a high deficit, weak growth and dependence on foreign investors.
DISCLAIMER:
This content is intended for individuals who are familiar with financial markets and instruments and is for information purposes only. The presented idea (including market commentary, market data and observations) is not a work product of any research department of Swissquote or its affiliates. This material is intended to highlight market action and does not constitute investment, legal or tax advice. If you are a retail investor or lack experience in trading complex financial products, it is advisable to seek professional advice from licensed advisor before making any financial decisions.
This content is not intended to manipulate the market or encourage any specific financial behavior.
Swissquote makes no representation or warranty as to the quality, completeness, accuracy, comprehensiveness or non-infringement of such content. The views expressed are those of the consultant and are provided for educational purposes only. Any information provided relating to a product or market should not be construed as recommending an investment strategy or transaction. Past performance is not a guarantee of future results.
Swissquote and its employees and representatives shall in no event be held liable for any damages or losses arising directly or indirectly from decisions made on the basis of this content.
The use of any third-party brands or trademarks is for information only and does not imply endorsement by Swissquote, or that the trademark owner has authorised Swissquote to promote its products or services.
Swissquote is the marketing brand for the activities of Swissquote Bank Ltd (Switzerland) regulated by FINMA, Swissquote Capital Markets Limited regulated by CySEC (Cyprus), Swissquote Bank Europe SA (Luxembourg) regulated by the CSSF, Swissquote Ltd (UK) regulated by the FCA, Swissquote Financial Services (Malta) Ltd regulated by the Malta Financial Services Authority, Swissquote MEA Ltd. (UAE) regulated by the Dubai Financial Services Authority, Swissquote Pte Ltd (Singapore) regulated by the Monetary Authority of Singapore, Swissquote Asia Limited (Hong Kong) licensed by the Hong Kong Securities and Futures Commission (SFC) and Swissquote South Africa (Pty) Ltd supervised by the FSCA.
Products and services of Swissquote are only intended for those permitted to receive them under local law.
All investments carry a degree of risk. The risk of loss in trading or holding financial instruments can be substantial. The value of financial instruments, including but not limited to stocks, bonds, cryptocurrencies, and other assets, can fluctuate both upwards and downwards. There is a significant risk of financial loss when buying, selling, holding, staking, or investing in these instruments. SQBE makes no recommendations regarding any specific investment, transaction, or the use of any particular investment strategy.
CFDs are complex instruments and come with a high risk of losing money rapidly due to leverage. The vast majority of retail client accounts suffer capital losses when trading in CFDs. You should consider whether you understand how CFDs work and whether you can afford to take the high risk of losing your money.
Digital Assets are unregulated in most countries and consumer protection rules may not apply. As highly volatile speculative investments, Digital Assets are not suitable for investors without a high-risk tolerance. Make sure you understand each Digital Asset before you trade.
Cryptocurrencies are not considered legal tender in some jurisdictions and are subject to regulatory uncertainties.
The use of Internet-based systems can involve high risks, including, but not limited to, fraud, cyber-attacks, network and communication failures, as well as identity theft and phishing attacks related to crypto-assets.
 Education
France/Germany yield spread on red alertAs France’s 10-year government bond yield has reached the same level as Italy’s 10-year government bond yield, the question of the trajectory of French public debt is becoming increasingly important. This issue is all the more significant because France is the second-largest economy in the Eurozone and a major global power.
Among the worrying factors at present are a budget deficit that remains well above the European 3% target, an interest burden that accounts for more than 13% of the government’s total budget, and a dominant share of public debt held by foreign investors.
Another warning indicator: the spread between French and German 10-year government bond yields is now at its highest level since 2012!
The chart below shows the long-term yield spread between France and Germany.
Let us examine the current situation of French public debt, the negative factors, but also the positive elements that could eventually allow for a structural improvement in the situation.
The first point to remember is the sheer size of the debt. At the end of the first quarter of 2026, French public debt reached €3.536 trillion, equivalent to 117.5% of GDP. This trend is concerning because the ratio stood at 98% at the end of 2015. France therefore needs to stabilize its public finances at the same time as the cost of its debt is increasing.
The debt interest burden is precisely one of the main risks. It is expected to reach €59.3 billion in 2026, an amount now higher than the budget allocated to national defense. More importantly, this burden is expected to continue rising over the coming years if interest rates remain high.
The table below presents the main characteristics of French public debt, including the weight of debt servicing in the government’s total budget and the share of public debt held by foreign investors.
The second risk is investor confidence. Around 55.9% of long-term debt securities issued by French public administrations are held by non-residents. This means that any deterioration in the perception of French sovereign risk can quickly translate into higher required yields and therefore a wider spread versus Germany.
However, not everything is negative. France still has a diversified economy, a large tax base, a relatively long average debt maturity, and benefits from membership in the Eurozone. Above all, a lasting reduction in the budget deficit, combined with stronger economic growth, could gradually reverse the trajectory of public debt.
The France/Germany spread should therefore be monitored as a genuine barometer of investor confidence. Stabilization would be a first positive signal. Conversely, a continued widening of the spread would indicate that investors are demanding an increasingly higher risk premium to finance France. At the beginning of September, the spread is trading around 90 basis points, levels close to those observed during previous periods of severe stress in French government debt.
DISCLAIMER:
This content is intended for individuals who are familiar with financial markets and instruments and is for information purposes only. The presented idea (including market commentary, market data and observations) is not a work product of any research department of Swissquote or its affiliates. This material is intended to highlight market action and does not constitute investment, legal or tax advice. If you are a retail investor or lack experience in trading complex financial products, it is advisable to seek professional advice from licensed advisor before making any financial decisions.
This content is not intended to manipulate the market or encourage any specific financial behavior.
Swissquote makes no representation or warranty as to the quality, completeness, accuracy, comprehensiveness or non-infringement of such content. The views expressed are those of the consultant and are provided for educational purposes only. Any information provided relating to a product or market should not be construed as recommending an investment strategy or transaction. Past performance is not a guarantee of future results.
Swissquote and its employees and representatives shall in no event be held liable for any damages or losses arising directly or indirectly from decisions made on the basis of this content.
The use of any third-party brands or trademarks is for information only and does not imply endorsement by Swissquote, or that the trademark owner has authorised Swissquote to promote its products or services.
Swissquote is the marketing brand for the activities of Swissquote Bank Ltd (Switzerland) regulated by FINMA, Swissquote Capital Markets Limited regulated by CySEC (Cyprus), Swissquote Bank Europe SA (Luxembourg) regulated by the CSSF, Swissquote Ltd (UK) regulated by the FCA, Swissquote Financial Services (Malta) Ltd regulated by the Malta Financial Services Authority, Swissquote MEA Ltd. (UAE) regulated by the Dubai Financial Services Authority, Swissquote Pte Ltd (Singapore) regulated by the Monetary Authority of Singapore, Swissquote Asia Limited (Hong Kong) licensed by the Hong Kong Securities and Futures Commission (SFC) and Swissquote South Africa (Pty) Ltd supervised by the FSCA.
Products and services of Swissquote are only intended for those permitted to receive them under local law.
All investments carry a degree of risk. The risk of loss in trading or holding financial instruments can be substantial. The value of financial instruments, including but not limited to stocks, bonds, cryptocurrencies, and other assets, can fluctuate both upwards and downwards. There is a significant risk of financial loss when buying, selling, holding, staking, or investing in these instruments. SQBE makes no recommendations regarding any specific investment, transaction, or the use of any particular investment strategy.
CFDs are complex instruments and come with a high risk of losing money rapidly due to leverage. The vast majority of retail client accounts suffer capital losses when trading in CFDs. You should consider whether you understand how CFDs work and whether you can afford to take the high risk of losing your money.
Digital Assets are unregulated in most countries and consumer protection rules may not apply. As highly volatile speculative investments, Digital Assets are not suitable for investors without a high-risk tolerance. Make sure you understand each Digital Asset before you trade.
Cryptocurrencies are not considered legal tender in some jurisdictions and are subject to regulatory uncertainties.
The use of Internet-based systems can involve high risks, including, but not limited to, fraud, cyber-attacks, network and communication failures, as well as identity theft and phishing attacks related to crypto-assets.
USD/JPY, don’t bet against the BoJ/Fed allianceDear readers, I warned you! You should never stand in front of a central bank in the FX market, and even less so when facing an alliance between two central banks, especially when the Fed is part of that alliance.
On August 11, I published an analysis explaining that there was a strong probability that the USD/JPY exchange rate had reached its top following the massive coordinated intervention by Japanese and US authorities. You can read my analysis again by clicking on the chart below.
This Tuesday, September 8, I am therefore offering you an update to my analysis, given that the USD/JPY exchange rate has once again fallen from the technical resistance level at 160 JPY last week.
Once again, this demonstrates that Japanese and US authorities are no longer willing to tolerate a continuation of the USD/JPY uptrend and want to bring the exchange rate back to a more reasonable level.
This is both a decline in the US dollar and, above all, a rebound in the Japanese yen, while Japanese government bond yields have risen sharply since 2022 and the BoJ could once again raise its interest rate on Friday, September 18.
This bearish reversal in USD/JPY therefore confirms a major cyclical top established at 164 JPY in July, and if this bearish reversal takes place in a controlled manner, it will be a positive development for both the Japanese and US economies.
However, a rapid and brutal decline in USD/JPY, resulting in a sharp rebound in the yen, should be avoided, as this could trigger a massive unwinding of carry trade positions on a global scale.
For now, the move remains under control, and the technical analysis of USD/JPY has produced a new bearish signal with the break below the 200-day moving average and the daily Kumo of the Ichimoku system.
If the 155 JPY support level also breaks, the new downtrend should accelerate.
The chart below shows the daily Japanese candlesticks for the USD/JPY exchange rate.
The chart below, the Fed Broad Dollar Index, reminds you of the true trend of the US dollar through the dollar index that the Fed itself created and uses to assess the underlying trend of the USD.
DISCLAIMER:
This content is intended for individuals who are familiar with financial markets and instruments and is for information purposes only. The presented idea (including market commentary, market data and observations) is not a work product of any research department of Swissquote or its affiliates. This material is intended to highlight market action and does not constitute investment, legal or tax advice. If you are a retail investor or lack experience in trading complex financial products, it is advisable to seek professional advice from licensed advisor before making any financial decisions.
This content is not intended to manipulate the market or encourage any specific financial behavior.
Swissquote makes no representation or warranty as to the quality, completeness, accuracy, comprehensiveness or non-infringement of such content. The views expressed are those of the consultant and are provided for educational purposes only. Any information provided relating to a product or market should not be construed as recommending an investment strategy or transaction. Past performance is not a guarantee of future results.
Swissquote and its employees and representatives shall in no event be held liable for any damages or losses arising directly or indirectly from decisions made on the basis of this content.
The use of any third-party brands or trademarks is for information only and does not imply endorsement by Swissquote, or that the trademark owner has authorised Swissquote to promote its products or services.
Swissquote is the marketing brand for the activities of Swissquote Bank Ltd (Switzerland) regulated by FINMA, Swissquote Capital Markets Limited regulated by CySEC (Cyprus), Swissquote Bank Europe SA (Luxembourg) regulated by the CSSF, Swissquote Ltd (UK) regulated by the FCA, Swissquote Financial Services (Malta) Ltd regulated by the Malta Financial Services Authority, Swissquote MEA Ltd. (UAE) regulated by the Dubai Financial Services Authority, Swissquote Pte Ltd (Singapore) regulated by the Monetary Authority of Singapore, Swissquote Asia Limited (Hong Kong) licensed by the Hong Kong Securities and Futures Commission (SFC) and Swissquote South Africa (Pty) Ltd supervised by the FSCA.
Products and services of Swissquote are only intended for those permitted to receive them under local law.
All investments carry a degree of risk. The risk of loss in trading or holding financial instruments can be substantial. The value of financial instruments, including but not limited to stocks, bonds, cryptocurrencies, and other assets, can fluctuate both upwards and downwards. There is a significant risk of financial loss when buying, selling, holding, staking, or investing in these instruments. SQBE makes no recommendations regarding any specific investment, transaction, or the use of any particular investment strategy.
CFDs are complex instruments and come with a high risk of losing money rapidly due to leverage. The vast majority of retail client accounts suffer capital losses when trading in CFDs. You should consider whether you understand how CFDs work and whether you can afford to take the high risk of losing your money.
Digital Assets are unregulated in most countries and consumer protection rules may not apply. As highly volatile speculative investments, Digital Assets are not suitable for investors without a high-risk tolerance. Make sure you understand each Digital Asset before you trade.
Cryptocurrencies are not considered legal tender in some jurisdictions and are subject to regulatory uncertainties.
The use of Internet-based systems can involve high risks, including, but not limited to, fraud, cyber-attacks, network and communication failures, as well as identity theft and phishing attacks related to crypto-assets.
Japanese Long-Term Rates: Is It Really Dangerous?The marked upward trend in Western bond yields since 2022 has become a major fundamental concern for markets. Oil prices, inflation, budget deficits and public debt are all factors pushing long-term yields higher, particularly in Europe, the United States and Japan.
For the Japanese economy, the situation could become complicated because public debt represents more than 240% of GDP, while interest payments are taking up an increasingly large share of the government’s annual budget.
The chart below shows Japan’s public debt as a percentage of GDP. This data is available on TradingView under the ticker JPGDG.
It should be remembered that the fiscal situation is also very challenging in the United States, where interest payments on existing public debt now represent 18% of federal government revenues.
But let us return to Japan, where the 10-year government bond yield has just reached the 3% threshold, its highest level since 1996!
The chart below shows the daily Japanese candlesticks of the Japanese 10-year government bond yield. It has been following a powerful upward trend since 2022 and has just reached 3%, its highest level since 1996.
Is this rise in Japanese long-term yields dangerous for the global economy, and above all, what factors would be necessary to definitively break this upward trend? A resumption of Japanese government bond purchases by the BoJ? A collapse in oil prices? A more accommodative Fed?
The first element to consider is the particular structure of Japanese debt. Unlike the United States, a very large share of this debt is held by domestic investors, notably the Bank of Japan, banks and insurance companies. This limits the risk of a sudden flight of foreign capital and makes Japan less dependent on external financing.
But this does not mean that rising yields have no consequences. The issue is rather the gradual refinancing cost of the debt. A large proportion of existing bonds were issued when interest rates were extremely low. As they mature and are refinanced, they will be replaced by bonds offering higher yields, mechanically increasing the government’s interest burden.
This is therefore more of a medium-term threat than an immediate risk of a solvency crisis.
The second determining factor remains BoJ policy. After years of yield curve control and massive bond purchases, the Bank of Japan is now seeking to gradually normalize its monetary policy. An overly rapid acceleration in this normalization process could trigger another surge in long-term yields.
Conversely, a more accommodative BoJ, with a slower pace of reduction in its bond purchases, could help stabilize the market.
The chart below shows Japanese bond yields, the BoJ’s balance sheet and the BoJ’s policy rate.
The third factor to monitor is the price of oil. A sustained decline in oil prices would reduce inflationary pressures in Japan and give the BoJ greater room for maneuver. A geopolitical easing that allows the Strait of Hormuz to fully reopen could therefore indirectly help calm Japanese yields through a reduction in the energy and inflation premium.
Finally, the trajectory of US yields remains essential. If the Fed becomes significantly more accommodative and US yields begin to decline, the pressure exerted on global bond markets could also ease.
The rise in Japanese yields therefore needs to be monitored, but it is still too early to speak of a crisis. The real danger would emerge if rising yields became self-reinforcing: higher interest costs, larger deficits, more bond issuance and therefore even greater upward pressure on yields.
To sustainably break this dynamic, the ideal scenario would be a combination of several factors: Japanese inflation normalizing, lower oil prices, a BoJ stabilizing its bond market and a more accommodative Fed. It is this combination, rather than a single isolated event, that could genuinely allow Japanese long-term yields to return to a more stable trajectory.
The data below shows that the market is anticipating a BoJ rate hike on September 18.
DISCLAIMER:
This content is intended for individuals who are familiar with financial markets and instruments and is for information purposes only. The presented idea (including market commentary, market data and observations) is not a work product of any research department of Swissquote or its affiliates. This material is intended to highlight market action and does not constitute investment, legal or tax advice. If you are a retail investor or lack experience in trading complex financial products, it is advisable to seek professional advice from licensed advisor before making any financial decisions.
This content is not intended to manipulate the market or encourage any specific financial behavior.
Swissquote makes no representation or warranty as to the quality, completeness, accuracy, comprehensiveness or non-infringement of such content. The views expressed are those of the consultant and are provided for educational purposes only. Any information provided relating to a product or market should not be construed as recommending an investment strategy or transaction. Past performance is not a guarantee of future results.
Swissquote and its employees and representatives shall in no event be held liable for any damages or losses arising directly or indirectly from decisions made on the basis of this content.
The use of any third-party brands or trademarks is for information only and does not imply endorsement by Swissquote, or that the trademark owner has authorised Swissquote to promote its products or services.
Swissquote is the marketing brand for the activities of Swissquote Bank Ltd (Switzerland) regulated by FINMA, Swissquote Capital Markets Limited regulated by CySEC (Cyprus), Swissquote Bank Europe SA (Luxembourg) regulated by the CSSF, Swissquote Ltd (UK) regulated by the FCA, Swissquote Financial Services (Malta) Ltd regulated by the Malta Financial Services Authority, Swissquote MEA Ltd. (UAE) regulated by the Dubai Financial Services Authority, Swissquote Pte Ltd (Singapore) regulated by the Monetary Authority of Singapore, Swissquote Asia Limited (Hong Kong) licensed by the Hong Kong Securities and Futures Commission (SFC) and Swissquote South Africa (Pty) Ltd supervised by the FSCA.
Products and services of Swissquote are only intended for those permitted to receive them under local law.
All investments carry a degree of risk. The risk of loss in trading or holding financial instruments can be substantial. The value of financial instruments, including but not limited to stocks, bonds, cryptocurrencies, and other assets, can fluctuate both upwards and downwards. There is a significant risk of financial loss when buying, selling, holding, staking, or investing in these instruments. SQBE makes no recommendations regarding any specific investment, transaction, or the use of any particular investment strategy.
CFDs are complex instruments and come with a high risk of losing money rapidly due to leverage. The vast majority of retail client accounts suffer capital losses when trading in CFDs. You should consider whether you understand how CFDs work and whether you can afford to take the high risk of losing your money.
Digital Assets are unregulated in most countries and consumer protection rules may not apply. As highly volatile speculative investments, Digital Assets are not suitable for investors without a high-risk tolerance. Make sure you understand each Digital Asset before you trade.
Cryptocurrencies are not considered legal tender in some jurisdictions and are subject to regulatory uncertainties.
The use of Internet-based systems can involve high risks, including, but not limited to, fraud, cyber-attacks, network and communication failures, as well as identity theft and phishing attacks related to crypto-assets.
Does the BITCOIN/S&P 500 ratio confirm the bottom?1) The shortest bear market in BTC history
Against the seasonal statistics that traditionally make August the second-worst month in BTC history, Bitcoin’s price has experienced a vertical rise from $62,000 to $80,000. Has the bear market definitively ended on Wednesday, July 1, at $57,750?
If the July 1 low at $57,750 were indeed to be the final bottom of the current Bitcoin bear market, the 2026 bearish cycle would have an exceptional characteristic.
At 268 days, it would be significantly shorter than the three previous major cyclical Bitcoin bear markets: 406 days in 2014, 363 days in 2018 and 376 days in 2022. The declining trend in duration, however, would remain intact.
The table below compares BTC’s cyclical bear markets according to two criteria.
2) Above the 200-day moving average, the bear market is over
To determine whether the July 1 low is truly the final bottom of the bear market, two technical indicators also deserve particular attention: the 200-day simple moving average and the weekly Kijun of the Ichimoku system.
Historically, the 200-day SMA has been one of the main dividing lines between a bull market and a bear market in Bitcoin. A sustained recovery above this average, followed by consolidation above it, represents a much more robust signal than a simple vertical rebound following a capitulation phase. The 200-day SMA was decisively broken to the upside on August 19. From now on, as long as Bitcoin preserves the $70,000 support level, we can consider the cyclical bear market to be over.
3) The BITCOIN/S&P 500 ratio entering a bullish reversal phase
On Bitcoin’s price against the US dollar, there are therefore fairly strong signals pointing to the end of the cyclical bear market. It is also interesting to note that the relative approach is revealing similar signals. This is particularly true of the technical analysis applied to the Bitcoin/S&P 500 ratio, which is showing the same early bullish reversal signals seen in 2019 and 2022: a weekly bullish divergence and a breakout above the weekly Kijun of the Ichimoku system. Naturally, only a breakout above the weekly Kumo would definitively confirm the beginning of a new long-term bullish phase.
The chart below shows the weekly Japanese candlesticks of the Bitcoin/S&P 500 ratio. The breakout above the weekly Kijun (Ichimoku system) is an early bullish reversal signal, as seen in 2019 and 2022.
DISCLAIMER:
This content is intended for individuals who are familiar with financial markets and instruments and is for information purposes only. The presented idea (including market commentary, market data and observations) is not a work product of any research department of Swissquote or its affiliates. This material is intended to highlight market action and does not constitute investment, legal or tax advice. If you are a retail investor or lack experience in trading complex financial products, it is advisable to seek professional advice from licensed advisor before making any financial decisions.
This content is not intended to manipulate the market or encourage any specific financial behavior.
Swissquote makes no representation or warranty as to the quality, completeness, accuracy, comprehensiveness or non-infringement of such content. The views expressed are those of the consultant and are provided for educational purposes only. Any information provided relating to a product or market should not be construed as recommending an investment strategy or transaction. Past performance is not a guarantee of future results.
Swissquote and its employees and representatives shall in no event be held liable for any damages or losses arising directly or indirectly from decisions made on the basis of this content.
The use of any third-party brands or trademarks is for information only and does not imply endorsement by Swissquote, or that the trademark owner has authorised Swissquote to promote its products or services.
Swissquote is the marketing brand for the activities of Swissquote Bank Ltd (Switzerland) regulated by FINMA, Swissquote Capital Markets Limited regulated by CySEC (Cyprus), Swissquote Bank Europe SA (Luxembourg) regulated by the CSSF, Swissquote Ltd (UK) regulated by the FCA, Swissquote Financial Services (Malta) Ltd regulated by the Malta Financial Services Authority, Swissquote MEA Ltd. (UAE) regulated by the Dubai Financial Services Authority, Swissquote Pte Ltd (Singapore) regulated by the Monetary Authority of Singapore, Swissquote Asia Limited (Hong Kong) licensed by the Hong Kong Securities and Futures Commission (SFC) and Swissquote South Africa (Pty) Ltd supervised by the FSCA.
Products and services of Swissquote are only intended for those permitted to receive them under local law.
All investments carry a degree of risk. The risk of loss in trading or holding financial instruments can be substantial. The value of financial instruments, including but not limited to stocks, bonds, cryptocurrencies, and other assets, can fluctuate both upwards and downwards. There is a significant risk of financial loss when buying, selling, holding, staking, or investing in these instruments. SQBE makes no recommendations regarding any specific investment, transaction, or the use of any particular investment strategy.
CFDs are complex instruments and come with a high risk of losing money rapidly due to leverage. The vast majority of retail client accounts suffer capital losses when trading in CFDs. You should consider whether you understand how CFDs work and whether you can afford to take the high risk of losing your money.
Digital Assets are unregulated in most countries and consumer protection rules may not apply. As highly volatile speculative investments, Digital Assets are not suitable for investors without a high-risk tolerance. Make sure you understand each Digital Asset before you trade.
Cryptocurrencies are not considered legal tender in some jurisdictions and are subject to regulatory uncertainties.
The use of Internet-based systems can involve high risks, including, but not limited to, fraud, cyber-attacks, network and communication failures, as well as identity theft and phishing attacks related to crypto-assets.
Strategy Stock: Is the Bottom In?While Bitcoin may have ended its cyclical bear market on Wednesday, July 1, at $57,750, a similar question now arises for Strategy stock, the world’s largest holder of Bitcoin.
Historically, and this may seem logical, Strategy stock has consistently been ahead of the technical signals provided by Bitcoin’s price. It is therefore essential for technical analysis to also confirm a major bottom in Strategy stock in order to validate the hypothesis of a major bottom in Bitcoin.
First, I would like to remind you of the very strong relationship between Strategy and the price of Bitcoin, while also highlighting an important date: October 16, when Strategy could either be excluded from or remain eligible for MSCI indices.
The table below presents the hypothesis of a cyclical bear market that ended on July 1 at $57,750 and compares it with previous bear markets within the so-called four-year Bitcoin cycle.
Strategy has become a true Bitcoin proxy in equity markets. The company now holds a considerable amount of BTC on its balance sheet, meaning that its valuation is therefore heavily dependent on the performance of the world’s leading cryptocurrency. But the financial leverage associated with its Bitcoin acquisition strategy also amplifies movements in the stock, both upward and downward.
This is precisely what makes the technical analysis of Strategy particularly interesting today. If the stock were to confirm a major bullish reversal, this would provide an additional signal supporting the hypothesis that Bitcoin has already established a major bottom.
Conversely, a renewed deterioration in Strategy, particularly below its latest major technical support levels, could indicate that the market has not yet completed its capitulation phase.
But the main short-term risk could ultimately come from outside Bitcoin itself. On October 16, MSCI is expected to make a decision regarding Strategy’s eligibility for its indices. An exclusion could trigger forced selling by index funds and become a significant source of volatility for the stock.
The issue is therefore twofold: determining whether Strategy has already established a major technical bottom and assessing the potential impact of the MSCI decision. These two elements could provide valuable clues about the next major phase of the Bitcoin market.
From a technical analysis perspective, Bitcoin’s price currently presents numerous arguments in favor of a bottom having been established on July 1. However, it still needs to break above the weekly Ichimoku Kumo, and this could still take some time.
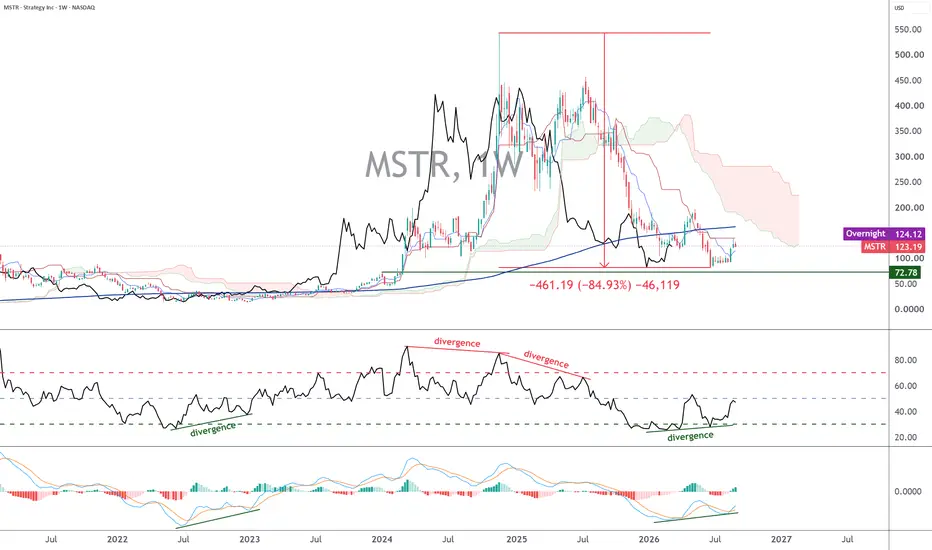
As for Strategy stock, following an 85% decline from its all-time high, powerful bullish price/momentum divergences argue in favor of a bottom having been established at the end of June. However, several resistance levels still need to be broken to validate this scenario, notably the 200-day and 200-week moving averages, as well as the Kijun and the weekly Kumo of the Ichimoku system.
The chart below shows the weekly Japanese candlesticks of Strategy stock.
DISCLAIMER:
This content is intended for individuals who are familiar with financial markets and instruments and is for information purposes only. The presented idea (including market commentary, market data and observations) is not a work product of any research department of Swissquote or its affiliates. This material is intended to highlight market action and does not constitute investment, legal or tax advice. If you are a retail investor or lack experience in trading complex financial products, it is advisable to seek professional advice from licensed advisor before making any financial decisions.
This content is not intended to manipulate the market or encourage any specific financial behavior.
Swissquote makes no representation or warranty as to the quality, completeness, accuracy, comprehensiveness or non-infringement of such content. The views expressed are those of the consultant and are provided for educational purposes only. Any information provided relating to a product or market should not be construed as recommending an investment strategy or transaction. Past performance is not a guarantee of future results.
Swissquote and its employees and representatives shall in no event be held liable for any damages or losses arising directly or indirectly from decisions made on the basis of this content.
The use of any third-party brands or trademarks is for information only and does not imply endorsement by Swissquote, or that the trademark owner has authorised Swissquote to promote its products or services.
Swissquote is the marketing brand for the activities of Swissquote Bank Ltd (Switzerland) regulated by FINMA, Swissquote Capital Markets Limited regulated by CySEC (Cyprus), Swissquote Bank Europe SA (Luxembourg) regulated by the CSSF, Swissquote Ltd (UK) regulated by the FCA, Swissquote Financial Services (Malta) Ltd regulated by the Malta Financial Services Authority, Swissquote MEA Ltd. (UAE) regulated by the Dubai Financial Services Authority, Swissquote Pte Ltd (Singapore) regulated by the Monetary Authority of Singapore, Swissquote Asia Limited (Hong Kong) licensed by the Hong Kong Securities and Futures Commission (SFC) and Swissquote South Africa (Pty) Ltd supervised by the FSCA.
Products and services of Swissquote are only intended for those permitted to receive them under local law.
All investments carry a degree of risk. The risk of loss in trading or holding financial instruments can be substantial. The value of financial instruments, including but not limited to stocks, bonds, cryptocurrencies, and other assets, can fluctuate both upwards and downwards. There is a significant risk of financial loss when buying, selling, holding, staking, or investing in these instruments. SQBE makes no recommendations regarding any specific investment, transaction, or the use of any particular investment strategy.
CFDs are complex instruments and come with a high risk of losing money rapidly due to leverage. The vast majority of retail client accounts suffer capital losses when trading in CFDs. You should consider whether you understand how CFDs work and whether you can afford to take the high risk of losing your money.
Digital Assets are unregulated in most countries and consumer protection rules may not apply. As highly volatile speculative investments, Digital Assets are not suitable for investors without a high-risk tolerance. Make sure you understand each Digital Asset before you trade.
Cryptocurrencies are not considered legal tender in some jurisdictions and are subject to regulatory uncertainties.
The use of Internet-based systems can involve high risks, including, but not limited to, fraud, cyber-attacks, network and communication failures, as well as identity theft and phishing attacks related to crypto-assets.
Bitcoin: Cyclical bear market ended on July 1?Could Bitcoin be in the process of recording the shortest cyclical bear market in its recent history? While historical seasonality traditionally makes August a difficult month for BTC, the reality of the market is currently very different. After touching $62,000, Bitcoin experienced a particularly rapid rebound toward $80,000.
A key question is therefore emerging: did the low recorded on July 1 at $57,750 mark the definitive end of the bear market?
1) A shorter-than-average bear market
If the July 1 low were indeed to prove to be the definitive bottom of the current bear cycle, the 2026 bear market would have a historical peculiarity.
Between the cycle high and this low, the bearish phase would have lasted approximately 268 days. This is significantly shorter than the three previous major bear markets: approximately 406 days in 2014, 363 days in 2018 and 376 days in 2022.
The duration of Bitcoin bear markets therefore appears to be gradually contracting from one cycle to the next.
But the most striking element probably concerns the magnitude of the correction.
With a maximum drawdown of approximately 54%, the 2026 bear market would also be the least severe of the major recent bear markets. By comparison, maximum drawdowns reached approximately 85% in 2014, 83% in 2018 and 76% in 2022.
The current bear market could therefore be both the shortest and the shallowest in this recent history.
This evolution can be explained by the gradual maturation of the Bitcoin ecosystem. Spot ETFs, the growing presence of institutional investors and increasing market depth have probably helped limit the severity of capitulation phases.
However, caution is warranted before drawing a definitive conclusion too quickly. A new low cannot be completely ruled out, and the coming weeks will be particularly important. September, as well as the vote scheduled for September 15 on the Clarity Act, could in particular represent important catalysts for the market.
2) Two technical levels to watch around $70,000
To determine whether the July low really marks the end of the bear market, two technical indicators currently offer a particularly interesting reading: the 200-day simple moving average and the weekly Ichimoku Kijun.
The 200-day SMA has long been a major reference point for distinguishing between Bitcoin’s major bullish and bearish phases. However, a simple temporary breakout is not enough: what really matters is the ability of the price to reclaim this average and, above all, to establish a sustained consolidation phase above it.
Bitcoin has just reclaimed this average strongly over the past week.
The weekly Kijun provides a second confirmation. Even more interestingly, both indicators are currently located around $70,000.
This is therefore the major technical level to watch over the coming weeks.
If Bitcoin manages to hold this zone sustainably through October, the hypothesis that the bear market ended at the beginning of July will gain considerably more credibility.
But holding a support level is not enough to definitively confirm a cycle change. Bitcoin must also succeed in breaking through the major resistance levels.
3) Weekly Ichimoku Kumo and 50-week moving average to confirm the end of the bear market
The next step is around $82,000. This level corresponds in particular to the 50-week moving average and represents a particularly important technical resistance.
The scenario I favor is therefore one of a consolidation phase between $70,000 and $83,000 over the coming weeks.
If this range is confirmed and Bitcoin subsequently manages to break out to the upside, the market could enter a new phase of bullish acceleration.
The chart below shows the weekly candlesticks of Bitcoin, including the Ichimoku system.
In this scenario, the true bull run would probably not develop immediately. The most interesting period could instead begin from November 2026, followed by a continuation of the bullish move throughout 2027.
In summary, the technical signal is now clearly more constructive than it was at the beginning of the summer. The July 1 low at $57,750 may well have marked the end of the bear market.
But to turn this hypothesis into a genuine cycle confirmation, Bitcoin must now defend $70,000 and then sustainably break through $82,000–$83,000 as well as the weekly Ichimoku Kumo.
It is this combination of preserved support and broken resistance that will determine whether the 2026 bear market is definitively a thing of the past.
DISCLAIMER:
This content is intended for individuals who are familiar with financial markets and instruments and is for information purposes only. The presented idea (including market commentary, market data and observations) is not a work product of any research department of Swissquote or its affiliates. This material is intended to highlight market action and does not constitute investment, legal or tax advice. If you are a retail investor or lack experience in trading complex financial products, it is advisable to seek professional advice from licensed advisor before making any financial decisions.
This content is not intended to manipulate the market or encourage any specific financial behavior.
Swissquote makes no representation or warranty as to the quality, completeness, accuracy, comprehensiveness or non-infringement of such content. The views expressed are those of the consultant and are provided for educational purposes only. Any information provided relating to a product or market should not be construed as recommending an investment strategy or transaction. Past performance is not a guarantee of future results.
Swissquote and its employees and representatives shall in no event be held liable for any damages or losses arising directly or indirectly from decisions made on the basis of this content.
The use of any third-party brands or trademarks is for information only and does not imply endorsement by Swissquote, or that the trademark owner has authorised Swissquote to promote its products or services.
Swissquote is the marketing brand for the activities of Swissquote Bank Ltd (Switzerland) regulated by FINMA, Swissquote Capital Markets Limited regulated by CySEC (Cyprus), Swissquote Bank Europe SA (Luxembourg) regulated by the CSSF, Swissquote Ltd (UK) regulated by the FCA, Swissquote Financial Services (Malta) Ltd regulated by the Malta Financial Services Authority, Swissquote MEA Ltd. (UAE) regulated by the Dubai Financial Services Authority, Swissquote Pte Ltd (Singapore) regulated by the Monetary Authority of Singapore, Swissquote Asia Limited (Hong Kong) licensed by the Hong Kong Securities and Futures Commission (SFC) and Swissquote South Africa (Pty) Ltd supervised by the FSCA.
Products and services of Swissquote are only intended for those permitted to receive them under local law.
All investments carry a degree of risk. The risk of loss in trading or holding financial instruments can be substantial. The value of financial instruments, including but not limited to stocks, bonds, cryptocurrencies, and other assets, can fluctuate both upwards and downwards. There is a significant risk of financial loss when buying, selling, holding, staking, or investing in these instruments. SQBE makes no recommendations regarding any specific investment, transaction, or the use of any particular investment strategy.
CFDs are complex instruments and come with a high risk of losing money rapidly due to leverage. The vast majority of retail client accounts suffer capital losses when trading in CFDs. You should consider whether you understand how CFDs work and whether you can afford to take the high risk of losing your money.
Digital Assets are unregulated in most countries and consumer protection rules may not apply. As highly volatile speculative investments, Digital Assets are not suitable for investors without a high-risk tolerance. Make sure you understand each Digital Asset before you trade.
Cryptocurrencies are not considered legal tender in some jurisdictions and are subject to regulatory uncertainties.
The use of Internet-based systems can involve high risks, including, but not limited to, fraud, cyber-attacks, network and communication failures, as well as identity theft and phishing attacks related to crypto-assets.
The Major Challenge of US Fiscal CredibilityThe monetary policy outlook of the Federal Reserve (FED) is the dominant fundamental factor for financial markets and the underlying trend of the US equity market.
But a second fundamental theme is increasingly establishing itself as the faithful number two: US fiscal credibility, at a time when the budget deficit has fluctuated between 5% and 7% every year since 2019, while long-term bond yields have been following an upward trend since 2022.
First of all, I invite you to reread the analysis I presented last week on the fundamental factors needed to put an end to this rise in long-term yields and therefore remove some of the fundamental pressure on the market.
How can the upward trend in long-term interest rates in the United States be brought to an end?
Click on the chart below. It will take you to an analysis presenting the three essential factors needed to reverse the downward trend in long-term yields.
So why is US fiscal credibility such a major issue when the midterm elections are scheduled for Tuesday, November 3?
The answer is simple: interest payments on US debt now represent an overwhelming share of US federal government spending, and this negative dynamic appears likely to intensify further.
In fiscal year 2026, net interest expense reached approximately $1 trillion, representing nearly 18% of federal revenues. A considerable share of government revenues is being absorbed by debt servicing.
The table below presents the US federal budget and highlights the significant share that interest expense now represents in US federal government spending each year.
And the problem is dynamic. With federal debt close to 125% of GDP and a budget deficit close to $1.9 trillion, the United States must continue to borrow massively. If long-term yields remain high, refinancing the debt mechanically increases interest costs.
This is precisely where fiscal credibility comes into play. Bond investors must be convinced that Washington is capable of stabilizing and then reducing its deficit. Failing that, a higher term premium could become permanently embedded in Treasuries, pushing long-term yields higher despite a more accommodative FED.
The midterm elections will be a major political test: the market will be looking for credible signs of fiscal discipline. Without it, a reduction in policy rates may not be enough to reverse the trend in long-term yields.
The histogram below represents the US budget deficit as a percentage of US GDP. This growing deficit threatens US fiscal credibility.
DISCLAIMER:
This content is intended for individuals who are familiar with financial markets and instruments and is for information purposes only. The presented idea (including market commentary, market data and observations) is not a work product of any research department of Swissquote or its affiliates. This material is intended to highlight market action and does not constitute investment, legal or tax advice. If you are a retail investor or lack experience in trading complex financial products, it is advisable to seek professional advice from licensed advisor before making any financial decisions.
This content is not intended to manipulate the market or encourage any specific financial behavior.
Swissquote makes no representation or warranty as to the quality, completeness, accuracy, comprehensiveness or non-infringement of such content. The views expressed are those of the consultant and are provided for educational purposes only. Any information provided relating to a product or market should not be construed as recommending an investment strategy or transaction. Past performance is not a guarantee of future results.
Swissquote and its employees and representatives shall in no event be held liable for any damages or losses arising directly or indirectly from decisions made on the basis of this content.
The use of any third-party brands or trademarks is for information only and does not imply endorsement by Swissquote, or that the trademark owner has authorised Swissquote to promote its products or services.
Swissquote is the marketing brand for the activities of Swissquote Bank Ltd (Switzerland) regulated by FINMA, Swissquote Capital Markets Limited regulated by CySEC (Cyprus), Swissquote Bank Europe SA (Luxembourg) regulated by the CSSF, Swissquote Ltd (UK) regulated by the FCA, Swissquote Financial Services (Malta) Ltd regulated by the Malta Financial Services Authority, Swissquote MEA Ltd. (UAE) regulated by the Dubai Financial Services Authority, Swissquote Pte Ltd (Singapore) regulated by the Monetary Authority of Singapore, Swissquote Asia Limited (Hong Kong) licensed by the Hong Kong Securities and Futures Commission (SFC) and Swissquote South Africa (Pty) Ltd supervised by the FSCA.
Products and services of Swissquote are only intended for those permitted to receive them under local law.
All investments carry a degree of risk. The risk of loss in trading or holding financial instruments can be substantial. The value of financial instruments, including but not limited to stocks, bonds, cryptocurrencies, and other assets, can fluctuate both upwards and downwards. There is a significant risk of financial loss when buying, selling, holding, staking, or investing in these instruments. SQBE makes no recommendations regarding any specific investment, transaction, or the use of any particular investment strategy.
CFDs are complex instruments and come with a high risk of losing money rapidly due to leverage. The vast majority of retail client accounts suffer capital losses when trading in CFDs. You should consider whether you understand how CFDs work and whether you can afford to take the high risk of losing your money.
Digital Assets are unregulated in most countries and consumer protection rules may not apply. As highly volatile speculative investments, Digital Assets are not suitable for investors without a high-risk tolerance. Make sure you understand each Digital Asset before you trade.
Cryptocurrencies are not considered legal tender in some jurisdictions and are subject to regulatory uncertainties.
The use of Internet-based systems can involve high risks, including, but not limited to, fraud, cyber-attacks, network and communication failures, as well as identity theft and phishing attacks related to crypto-assets.
Broad Dollar Index — the Fed’s index, the real US dollar!How can we properly track the underlying trend of the US dollar on the foreign exchange market? The best-known and most traditionally followed representation of the US dollar in trading rooms is the dollar index with the ticker DXY. You can find the DXY on TradingView.
But the problem with this representation of the US dollar is that it gives too much weight to the Euro and excludes many of the United States’ trading partners, particularly China.
This is why the Fed uses its Broad Dollar Index to analyze the trend of the US dollar, and its TradingView ticker is DTWEXBGS.
Let’s take a closer look at the differences between the DXY and the Fed’s Broad Dollar Index, bearing in mind that a good analysis consists of using both indices and looking for convergences or divergences in their trends.
The DXY is composed of only six currencies, and its main characteristic is the extremely large weight given to the Euro, which represents 57.6% of the index. The Japanese yen accounts for 13.6%, the British pound 11.9%, the Canadian dollar 9.1%, the Swedish krona 4.2% and the Swiss franc 3.6%. In other words, more than 83% of the DXY depends on the Euro, yen and pound sterling.
The Fed’s Broad Dollar Index takes a very different approach. It seeks to measure the value of the dollar against the currencies of the United States’ main trading partners, with weights based on trade flows. The Fed regularly updates these weights. For 2026, the Euro therefore represents around 21% of the basket, the Mexican peso 14.8%, the Canadian dollar 12.8% and the Chinese yuan 10.9%.
The table below compares the two representations of the US dollar in FX: the very well-known US Dollar Index (DXY) used in trading rooms and the Fed’s Broad Dollar Index.
The Broad Dollar Index is now probably the best choice for tracking the underlying trend of the US dollar against a basket of major currencies.
This difference is fundamental. The DXY is ultimately highly sensitive to the Euro, whereas the Broad Dollar Index provides a much more diversified representation of the dollar’s strength in the global economy. It notably includes China, Mexico, South Korea, India, Taiwan, Vietnam and Brazil, all of which are absent from the DXY.
It should also be specified that the Broad Dollar Index is an index weighted by trade in goods and services. It is therefore better suited to a macroeconomic analysis of the dollar’s external value, whereas the DXY remains extremely useful for tracking movements in the foreign exchange market.
On TradingView, DTWEXBGS corresponds to the Fed’s nominal Broad Dollar Index, with a base of 100 in January 2006 and daily data.
In practice, I therefore recommend following both. If the DXY falls but the Broad Dollar Index remains resilient, the weakness of the dollar may be primarily related to the Euro. On the other hand, if both indices decline simultaneously, the signal becomes much more powerful: the weakness of the dollar is then truly broad-based.
The chart below shows the weekly closing price of the Fed’s Broad Dollar Index, with the Ichimoku system. The trend remains bearish as long as the dollar trades within the weekly Ichimoku cloud.
Its TradingView ticker is DTWEXBGS.
DISCLAIMER:
This content is intended for individuals who are familiar with financial markets and instruments and is for information purposes only. The presented idea (including market commentary, market data and observations) is not a work product of any research department of Swissquote or its affiliates. This material is intended to highlight market action and does not constitute investment, legal or tax advice. If you are a retail investor or lack experience in trading complex financial products, it is advisable to seek professional advice from licensed advisor before making any financial decisions.
This content is not intended to manipulate the market or encourage any specific financial behavior.
Swissquote makes no representation or warranty as to the quality, completeness, accuracy, comprehensiveness or non-infringement of such content. The views expressed are those of the consultant and are provided for educational purposes only. Any information provided relating to a product or market should not be construed as recommending an investment strategy or transaction. Past performance is not a guarantee of future results.
Swissquote and its employees and representatives shall in no event be held liable for any damages or losses arising directly or indirectly from decisions made on the basis of this content.
The use of any third-party brands or trademarks is for information only and does not imply endorsement by Swissquote, or that the trademark owner has authorised Swissquote to promote its products or services.
Swissquote is the marketing brand for the activities of Swissquote Bank Ltd (Switzerland) regulated by FINMA, Swissquote Capital Markets Limited regulated by CySEC (Cyprus), Swissquote Bank Europe SA (Luxembourg) regulated by the CSSF, Swissquote Ltd (UK) regulated by the FCA, Swissquote Financial Services (Malta) Ltd regulated by the Malta Financial Services Authority, Swissquote MEA Ltd. (UAE) regulated by the Dubai Financial Services Authority, Swissquote Pte Ltd (Singapore) regulated by the Monetary Authority of Singapore, Swissquote Asia Limited (Hong Kong) licensed by the Hong Kong Securities and Futures Commission (SFC) and Swissquote South Africa (Pty) Ltd supervised by the FSCA.
Products and services of Swissquote are only intended for those permitted to receive them under local law.
All investments carry a degree of risk. The risk of loss in trading or holding financial instruments can be substantial. The value of financial instruments, including but not limited to stocks, bonds, cryptocurrencies, and other assets, can fluctuate both upwards and downwards. There is a significant risk of financial loss when buying, selling, holding, staking, or investing in these instruments. SQBE makes no recommendations regarding any specific investment, transaction, or the use of any particular investment strategy.
CFDs are complex instruments and come with a high risk of losing money rapidly due to leverage. The vast majority of retail client accounts suffer capital losses when trading in CFDs. You should consider whether you understand how CFDs work and whether you can afford to take the high risk of losing your money.
Digital Assets are unregulated in most countries and consumer protection rules may not apply. As highly volatile speculative investments, Digital Assets are not suitable for investors without a high-risk tolerance. Make sure you understand each Digital Asset before you trade.
Cryptocurrencies are not considered legal tender in some jurisdictions and are subject to regulatory uncertainties.
The use of Internet-based systems can involve high risks, including, but not limited to, fraud, cyber-attacks, network and communication failures, as well as identity theft and phishing attacks related to crypto-assets.
Education 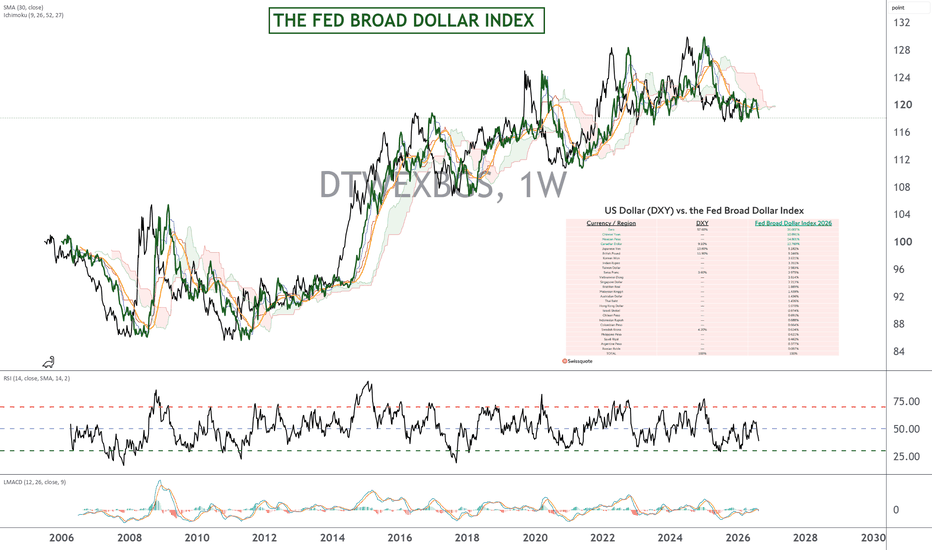
Back-to-Market Season: 5 Forces Will Dictate the TrendThe return to the markets looks particularly interesting. After a summer marked by questions surrounding long-term US rates, the trajectory of inflation, the Fed’s monetary policy and the continuation of the investment cycle in artificial intelligence, September could be a decisive month for market direction. In my view, five major forces will genuinely drive the US stock market.
The table below describes the 5 major fundamental factors that will shape the stock market trend in September.
First force: the Fed. This is obviously the number one factor. The September calendar is particularly busy, with employment data, CPI on September 11 and, above all, the FOMC meeting on September 15-16. The Fed will have to balance inflation, which needs to continue slowing, against a labor market that could show signs of weakness. The September 4 NFP will therefore be a first major test. Then CPI will follow, before the Fed’s decision. Finally, the September 30 PCE will complete the picture. Kevin Warsh’s message and, above all, the new “dot plot” could trigger a major repricing of rate expectations.
Second force: US long-term rates. This is probably the main risk independent of the Fed. Even if the central bank eases monetary policy, a persistent rise in the 10-year and 30-year yields could continue to weigh on the valuation multiples of the S&P 500 and Nasdaq. The US budget deficit, Treasury issuance, inflation and demand for US debt will therefore need to be monitored very closely. A rate zone of 4.5-5.5% already represents an area of tension; above 5.5%, the restrictive effect would become much more significant.
Third force: the AI and technology cycle. After NVIDIA, the market will closely watch the results from Broadcom, Oracle and then Micron. The issue goes far beyond quarterly earnings: the key question is whether hyperscalers’ capital expenditure continues to increase and whether demand for AI infrastructure remains strong enough to justify current valuations.
Fourth force: oil and geopolitics. Iran, the Middle East and, above all, the Strait of Hormuz will remain major variables. A sharp rise in oil prices would represent an additional inflationary risk and could considerably complicate the Fed’s task. The scenario to avoid would be an oil shock that simultaneously slows growth and reignites inflation: in other words, a risk of stagflation.
Fifth force: US growth and the consumer. ISM Services, JOLTS, NFP, personal spending, followed by Costco and Nike earnings, will help measure the strength of the US economy. Because behind the resilience of the indices lies a fundamental question: how long can the US consumer continue to support growth?
In summary, September will therefore be a genuine stress test for the markets. Fed, long-term rates, AI, oil and consumption: these five forces will determine whether the uptrend can continue or whether markets need to enter a consolidation phase.
And beyond this back-to-market period, another question is already beginning to emerge: could 2027 become a particularly favorable year for equities? Historically, the third year of the US presidential cycle has delivered the best average performance, with a return close to 14%. It is obviously too early to draw a conclusion from this, but it provides an additional element supporting a constructive medium-term outlook.
DISCLAIMER:
This content is intended for individuals who are familiar with financial markets and instruments and is for information purposes only. The presented idea (including market commentary, market data and observations) is not a work product of any research department of Swissquote or its affiliates. This material is intended to highlight market action and does not constitute investment, legal or tax advice. If you are a retail investor or lack experience in trading complex financial products, it is advisable to seek professional advice from licensed advisor before making any financial decisions.
This content is not intended to manipulate the market or encourage any specific financial behavior.
Swissquote makes no representation or warranty as to the quality, completeness, accuracy, comprehensiveness or non-infringement of such content. The views expressed are those of the consultant and are provided for educational purposes only. Any information provided relating to a product or market should not be construed as recommending an investment strategy or transaction. Past performance is not a guarantee of future results.
Swissquote and its employees and representatives shall in no event be held liable for any damages or losses arising directly or indirectly from decisions made on the basis of this content.
The use of any third-party brands or trademarks is for information only and does not imply endorsement by Swissquote, or that the trademark owner has authorised Swissquote to promote its products or services.
Swissquote is the marketing brand for the activities of Swissquote Bank Ltd (Switzerland) regulated by FINMA, Swissquote Capital Markets Limited regulated by CySEC (Cyprus), Swissquote Bank Europe SA (Luxembourg) regulated by the CSSF, Swissquote Ltd (UK) regulated by the FCA, Swissquote Financial Services (Malta) Ltd regulated by the Malta Financial Services Authority, Swissquote MEA Ltd. (UAE) regulated by the Dubai Financial Services Authority, Swissquote Pte Ltd (Singapore) regulated by the Monetary Authority of Singapore, Swissquote Asia Limited (Hong Kong) licensed by the Hong Kong Securities and Futures Commission (SFC) and Swissquote South Africa (Pty) Ltd supervised by the FSCA.
Products and services of Swissquote are only intended for those permitted to receive them under local law.
All investments carry a degree of risk. The risk of loss in trading or holding financial instruments can be substantial. The value of financial instruments, including but not limited to stocks, bonds, cryptocurrencies, and other assets, can fluctuate both upwards and downwards. There is a significant risk of financial loss when buying, selling, holding, staking, or investing in these instruments. SQBE makes no recommendations regarding any specific investment, transaction, or the use of any particular investment strategy.
CFDs are complex instruments and come with a high risk of losing money rapidly due to leverage. The vast majority of retail client accounts suffer capital losses when trading in CFDs. You should consider whether you understand how CFDs work and whether you can afford to take the high risk of losing your money.
Digital Assets are unregulated in most countries and consumer protection rules may not apply. As highly volatile speculative investments, Digital Assets are not suitable for investors without a high-risk tolerance. Make sure you understand each Digital Asset before you trade.
Cryptocurrencies are not considered legal tender in some jurisdictions and are subject to regulatory uncertainties.
The use of Internet-based systems can involve high risks, including, but not limited to, fraud, cyber-attacks, network and communication failures, as well as identity theft and phishing attacks related to crypto-assets.
Long-term rates, how can the rise be stopped?The upward trend in long-term US government bond yields is one of the major fundamental concerns at the moment. The US 30-year Treasury yield reached 5.33% during the August 18 trading session, a level not seen since 2007, meaning a 19-year high!
Long-term borrowing costs for the US federal government and for all economic participants continue to rise and are approaching levels that could represent significant financial stress for the government and companies.
The announced doubling of US debt security buybacks in the bond market by the US Treasury starting Wednesday, September 9, will not change anything, because it is not a structural measure given the current size of US public debt, which now exceeds $40 trillion, or 130% of US GDP.
The chart below shows the monthly Japanese candlesticks for the US 30-year Treasury yield. It is currently trading around its 2007 levels, a 19-year high.
How can this underlying uptrend in long-term bond yields be broken? The goal is not simply to find measures capable of stabilizing the market, but rather measures capable of reversing this uptrend, which is also becoming increasingly worrying from a technical analysis perspective.
Three factors seem necessary to me to put an end to the rise in US long-term yields and, more generally, in the West.
The chart below is sourced from Bloomberg and shows very long-term government bond yields in the United States, Japan, the United Kingdom and Germany. The underlying upward movement is widespread.
These three factors are:
· The return of US fiscal credibility
· Sustained US disinflation, allowing the Fed to resume an accommodative monetary policy path
· Deteriorating employment/slowing economic growth, although this would also be negative for the market if the unemployment rate were to rise sharply
The first factor is probably the most important over the long term: US fiscal credibility. As long as investors believe that deficits will remain persistently high and that debt will continue to grow faster than the economy’s capacity to support it, a high term premium may remain embedded in long-term yields. In other words, even if the Fed cuts its policy rates, this absolutely does not guarantee a decline in the 30-year yield.
A credible change in fiscal trajectory would therefore be necessary: reducing the primary deficit, controlling spending and, above all, convincing the market that the trajectory of public debt is sustainable. It is this credibility that could allow investors to demand a lower return for holding very long-term US government debt.
The chart below reveals the trajectory of US public debt, which has just exceeded $40 trillion.
The second factor is sustained disinflation. If US inflation clearly returned toward the 2% target and long-term inflation expectations remained firmly anchored, the Fed would have greater room to cut policy rates. A decline in short-term rates would then eventually exert downward pressure across the entire yield curve, although the move would probably be much stronger in intermediate maturities than in the 30-year sector.
The histogram below represents US inflation according to core PCE.
Finally, the third factor would be an economic slowdown and deterioration in the labor market. Historically, a sharply slowing US economy leads to lower expectations for policy rates and therefore increased demand for safety through government bonds. This can cause yields to decline.
The ideal scenario for markets would therefore be a soft landing combining disinflation, moderate labor-market deterioration and improved fiscal credibility. It is probably the combination of these three factors, rather than a simple one-off intervention by the Treasury, that could genuinely reverse the upward trend in long-term yields.
From a technical analysis perspective on the 30-year Treasury yield, the market would need to move back below the 5.17% threshold before we could speak of the beginning of a calming phase for the US 30-year. From the 5.50% threshold onward, the yield would enter a zone of financial stress for the US economy.
The chart below shows the weekly Japanese candlesticks for the US 30-year Treasury yield.
DISCLAIMER:
This content is intended for individuals who are familiar with financial markets and instruments and is for information purposes only. The presented idea (including market commentary, market data and observations) is not a work product of any research department of Swissquote or its affiliates. This material is intended to highlight market action and does not constitute investment, legal or tax advice. If you are a retail investor or lack experience in trading complex financial products, it is advisable to seek professional advice from licensed advisor before making any financial decisions.
This content is not intended to manipulate the market or encourage any specific financial behavior.
Swissquote makes no representation or warranty as to the quality, completeness, accuracy, comprehensiveness or non-infringement of such content. The views expressed are those of the consultant and are provided for educational purposes only. Any information provided relating to a product or market should not be construed as recommending an investment strategy or transaction. Past performance is not a guarantee of future results.
Swissquote and its employees and representatives shall in no event be held liable for any damages or losses arising directly or indirectly from decisions made on the basis of this content.
The use of any third-party brands or trademarks is for information only and does not imply endorsement by Swissquote, or that the trademark owner has authorised Swissquote to promote its products or services.
Swissquote is the marketing brand for the activities of Swissquote Bank Ltd (Switzerland) regulated by FINMA, Swissquote Capital Markets Limited regulated by CySEC (Cyprus), Swissquote Bank Europe SA (Luxembourg) regulated by the CSSF, Swissquote Ltd (UK) regulated by the FCA, Swissquote Financial Services (Malta) Ltd regulated by the Malta Financial Services Authority, Swissquote MEA Ltd. (UAE) regulated by the Dubai Financial Services Authority, Swissquote Pte Ltd (Singapore) regulated by the Monetary Authority of Singapore, Swissquote Asia Limited (Hong Kong) licensed by the Hong Kong Securities and Futures Commission (SFC) and Swissquote South Africa (Pty) Ltd supervised by the FSCA.
Products and services of Swissquote are only intended for those permitted to receive them under local law.
All investments carry a degree of risk. The risk of loss in trading or holding financial instruments can be substantial. The value of financial instruments, including but not limited to stocks, bonds, cryptocurrencies, and other assets, can fluctuate both upwards and downwards. There is a significant risk of financial loss when buying, selling, holding, staking, or investing in these instruments. SQBE makes no recommendations regarding any specific investment, transaction, or the use of any particular investment strategy.
CFDs are complex instruments and come with a high risk of losing money rapidly due to leverage. The vast majority of retail client accounts suffer capital losses when trading in CFDs. You should consider whether you understand how CFDs work and whether you can afford to take the high risk of losing your money.
Digital Assets are unregulated in most countries and consumer protection rules may not apply. As highly volatile speculative investments, Digital Assets are not suitable for investors without a high-risk tolerance. Make sure you understand each Digital Asset before you trade.
Cryptocurrencies are not considered legal tender in some jurisdictions and are subject to regulatory uncertainties.
The use of Internet-based systems can involve high risks, including, but not limited to, fraud, cyber-attacks, network and communication failures, as well as identity theft and phishing attacks related to crypto-assets.
Education 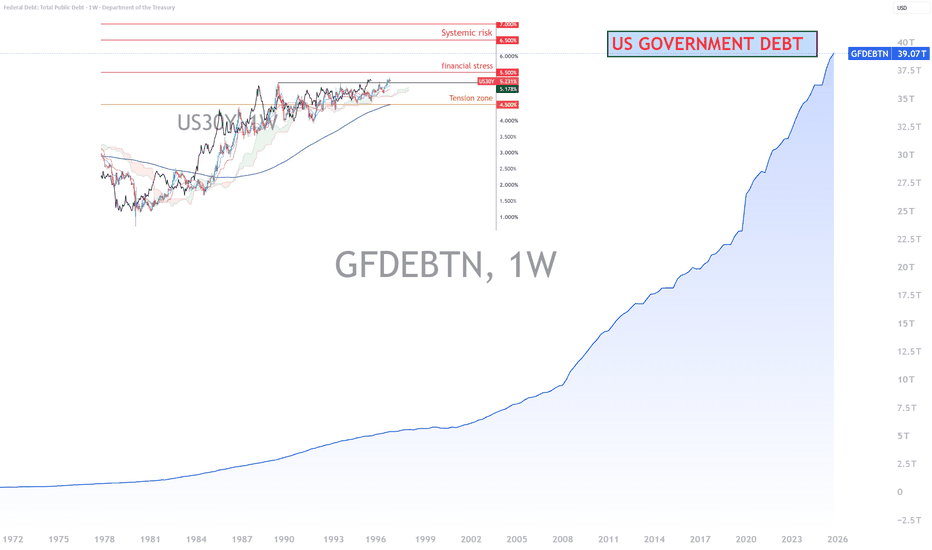
Netflix: Is It Time to Buy the Stock Again?Netflix shares have corrected by more than 50% since reaching their all-time high in June 2025. Since the end of last July, the stock has been attempting to stabilize after rebounding from its 200-week moving average.
Can we conclude that a major bottom is currently being formed?
To answer this question, I turned to both technical analysis and fundamental analysis, focusing in particular on Netflix's current stock market valuation.
The analysis is based on two key elements:
• Long-term technical signals provided by the monthly and weekly charts.
• Netflix's valuation based on its Forward Price-to-Earnings ratio (Forward P/E).
From a technical perspective, the stock has found support around $70, corresponding to the previous all-time high reached in November 2021. The share price has retraced nearly 61.8% of the entire previous bull market, while the 200-week moving average is currently acting as support. Holding support is encouraging, but breaking resistance is even more important. To confirm the formation of a major long-term bottom, the stock would need to break above the weekly Ichimoku Kumo (cloud).
From a valuation standpoint, has Netflix returned to an attractive level?
The answer is becoming increasingly positive. Netflix's Forward Price-to-Earnings ratio (Forward P/E) has now fallen below 20, a level that contrasts sharply with the very high valuation multiples investors had become accustomed to over recent years. This normalization of valuation is primarily the result of the sharp decline in the share price, while earnings expectations have remained relatively resilient.
The table below ranks the companies within the US Communication Services sector according to their Forward P/E. Following a correction of more than 50% from its all-time high, Netflix once again appears attractively valued.
When Netflix is compared with the other major Communication Services companies within the S&P 500, the conclusion becomes particularly interesting. With a Forward P/E of approximately 19.9, Netflix now ranks only ninth among the highest-valued companies in the sector. Companies such as Live Nation, Trade Desk, TKO Group, EchoStar, and Take-Two Interactive currently trade at significantly higher valuation multiples. Even Alphabet is now valued at a comparable multiple.
In other words, Netflix is no longer the "expensive growth stock" it was for several years. The market now requires a much more reasonable valuation premium, even though the company continues to benefit from a dominant position in the streaming industry, steady growth in advertising revenues, and exceptionally strong free cash flow generation.
This obviously does not mean that the stock cannot continue to decline if the overall market environment deteriorates or if upcoming earnings disappoint investors. However, the combination of a major long-term technical support level and a much more attractive valuation creates a significantly more favorable environment for long-term investors.
The chart below displays the weekly Japanese candlesticks of Netflix stock, which has declined by more than 50% from its all-time high. Also note that the P/E ratio has returned to a historically low valuation zone.
DISCLAIMER:
This content is intended for individuals who are familiar with financial markets and instruments and is for information purposes only. The presented idea (including market commentary, market data and observations) is not a work product of any research department of Swissquote or its affiliates. This material is intended to highlight market action and does not constitute investment, legal or tax advice. If you are a retail investor or lack experience in trading complex financial products, it is advisable to seek professional advice from licensed advisor before making any financial decisions.
This content is not intended to manipulate the market or encourage any specific financial behavior.
Swissquote makes no representation or warranty as to the quality, completeness, accuracy, comprehensiveness or non-infringement of such content. The views expressed are those of the consultant and are provided for educational purposes only. Any information provided relating to a product or market should not be construed as recommending an investment strategy or transaction. Past performance is not a guarantee of future results.
Swissquote and its employees and representatives shall in no event be held liable for any damages or losses arising directly or indirectly from decisions made on the basis of this content.
The use of any third-party brands or trademarks is for information only and does not imply endorsement by Swissquote, or that the trademark owner has authorised Swissquote to promote its products or services.
Swissquote is the marketing brand for the activities of Swissquote Bank Ltd (Switzerland) regulated by FINMA, Swissquote Capital Markets Limited regulated by CySEC (Cyprus), Swissquote Bank Europe SA (Luxembourg) regulated by the CSSF, Swissquote Ltd (UK) regulated by the FCA, Swissquote Financial Services (Malta) Ltd regulated by the Malta Financial Services Authority, Swissquote MEA Ltd. (UAE) regulated by the Dubai Financial Services Authority, Swissquote Pte Ltd (Singapore) regulated by the Monetary Authority of Singapore, Swissquote Asia Limited (Hong Kong) licensed by the Hong Kong Securities and Futures Commission (SFC) and Swissquote South Africa (Pty) Ltd supervised by the FSCA.
Products and services of Swissquote are only intended for those permitted to receive them under local law.
All investments carry a degree of risk. The risk of loss in trading or holding financial instruments can be substantial. The value of financial instruments, including but not limited to stocks, bonds, cryptocurrencies, and other assets, can fluctuate both upwards and downwards. There is a significant risk of financial loss when buying, selling, holding, staking, or investing in these instruments. SQBE makes no recommendations regarding any specific investment, transaction, or the use of any particular investment strategy.
CFDs are complex instruments and come with a high risk of losing money rapidly due to leverage. The vast majority of retail client accounts suffer capital losses when trading in CFDs. You should consider whether you understand how CFDs work and whether you can afford to take the high risk of losing your money.
Digital Assets are unregulated in most countries and consumer protection rules may not apply. As highly volatile speculative investments, Digital Assets are not suitable for investors without a high-risk tolerance. Make sure you understand each Digital Asset before you trade.
Cryptocurrencies are not considered legal tender in some jurisdictions and are subject to regulatory uncertainties.
The use of Internet-based systems can involve high risks, including, but not limited to, fraud, cyber-attacks, network and communication failures, as well as identity theft and phishing attacks related to crypto-assets.
S&P 500 Presidential Cycle: A Bullish 2027?The S&P 500 is following a long-term bullish trend, and corrections never last more than a few trading sessions, or at worst a few weeks. Can this underlying bullish momentum continue for several more months, or even throughout the entire year of 2027?
To answer this question, the most common approach is to use a combination of fundamental and technical factors. For example, I often show in my market analyses on TradingView that the underlying bullish trend is likely to resume as long as the US stock market does not reach an excessive valuation level.
But there is another approach that should not be underestimated: the cyclical approach. Several cycles can influence the trend of the S&P 500 Index, but the so-called “presidential cycle” is by far the most powerful and statistically documented.
Permabulls and permabears have strong opinions about the market, but these opinions are often ideological. Statistics, on the other hand, do not lie and are factual.
Let us now explain what the US presidential cycle is and why the third year of the presidential cycle — which will be 2027 — has historically been the strongest of all four years.
The presidential cycle is based on a simple observation: the performance of the US stock market is not distributed evenly across the four years of a presidential term. Since 1928, historical S&P 500 data show that the third year of the presidential term has recorded the strongest average performance. Conversely, the second year has historically been the most difficult, while the first and fourth years have produced intermediate performances.
The table below presents the presidential cycle statistics and highlights the bullish strength of the third year — namely, the upcoming year 2027. (Source: gurufocus.com).
Why does this phenomenon occur? The most commonly cited explanation is that US administrations generally seek to support economic activity ahead of presidential elections. Fiscal measures, stimulus programs, public spending and a political environment that is more favorable to financial markets tend to produce their effects during the third year of the presidential term. Of course, this cycle is not an immutable law and can be disrupted by exceptional events such as a financial crisis, a pandemic or a major geopolitical shock. Nevertheless, over nearly a century of data, this seasonality has proven remarkably robust.
The figures are particularly compelling. Since 1928, the third year of the presidential cycle has generated an average annual performance close to 14%, well above the historical average annual return of the S&P 500, which stands at around 8%. Even more interestingly, this statistical outperformance is found under both Democratic and Republican presidencies. In other words, the political factor appears to be less important than the position within the presidential cycle itself.
History never repeats itself exactly, but it often rhymes. The presidential cycle obviously does not guarantee that markets will rise in 2027, but it provides an additional statistical argument in favor of a medium-term bullish scenario.
DISCLAIMER:
This content is intended for individuals who are familiar with financial markets and instruments and is for information purposes only. The presented idea (including market commentary, market data and observations) is not a work product of any research department of Swissquote or its affiliates. This material is intended to highlight market action and does not constitute investment, legal or tax advice. If you are a retail investor or lack experience in trading complex financial products, it is advisable to seek professional advice from licensed advisor before making any financial decisions.
This content is not intended to manipulate the market or encourage any specific financial behavior.
Swissquote makes no representation or warranty as to the quality, completeness, accuracy, comprehensiveness or non-infringement of such content. The views expressed are those of the consultant and are provided for educational purposes only. Any information provided relating to a product or market should not be construed as recommending an investment strategy or transaction. Past performance is not a guarantee of future results.
Swissquote and its employees and representatives shall in no event be held liable for any damages or losses arising directly or indirectly from decisions made on the basis of this content.
The use of any third-party brands or trademarks is for information only and does not imply endorsement by Swissquote, or that the trademark owner has authorised Swissquote to promote its products or services.
Swissquote is the marketing brand for the activities of Swissquote Bank Ltd (Switzerland) regulated by FINMA, Swissquote Capital Markets Limited regulated by CySEC (Cyprus), Swissquote Bank Europe SA (Luxembourg) regulated by the CSSF, Swissquote Ltd (UK) regulated by the FCA, Swissquote Financial Services (Malta) Ltd regulated by the Malta Financial Services Authority, Swissquote MEA Ltd. (UAE) regulated by the Dubai Financial Services Authority, Swissquote Pte Ltd (Singapore) regulated by the Monetary Authority of Singapore, Swissquote Asia Limited (Hong Kong) licensed by the Hong Kong Securities and Futures Commission (SFC) and Swissquote South Africa (Pty) Ltd supervised by the FSCA.
Products and services of Swissquote are only intended for those permitted to receive them under local law.
All investments carry a degree of risk. The risk of loss in trading or holding financial instruments can be substantial. The value of financial instruments, including but not limited to stocks, bonds, cryptocurrencies, and other assets, can fluctuate both upwards and downwards. There is a significant risk of financial loss when buying, selling, holding, staking, or investing in these instruments. SQBE makes no recommendations regarding any specific investment, transaction, or the use of any particular investment strategy.
CFDs are complex instruments and come with a high risk of losing money rapidly due to leverage. The vast majority of retail client accounts suffer capital losses when trading in CFDs. You should consider whether you understand how CFDs work and whether you can afford to take the high risk of losing your money.
Digital Assets are unregulated in most countries and consumer protection rules may not apply. As highly volatile speculative investments, Digital Assets are not suitable for investors without a high-risk tolerance. Make sure you understand each Digital Asset before you trade.
Cryptocurrencies are not considered legal tender in some jurisdictions and are subject to regulatory uncertainties.
The use of Internet-based systems can involve high risks, including, but not limited to, fraud, cyber-attacks, network and communication failures, as well as identity theft and phishing attacks related to crypto-assets.
 Education
Nvidia: Is It Too Late to Invest in the Stock?Many stock market investors and financial analysts ask themselves every week whether it is too late to invest in the semiconductor industry, the star segment of the US technology sector.
Within the GAFAM stocks, Nvidia is the purest representative of the semiconductor industry, with its position as the global leader in AI GPUs. With more than 80% market share, Nvidia dominates global competition, while AMD remains a distant second.
As I often say, “a trend can restart several times, but it only reverses once.” This saying that I coined applies perfectly to the current situation of Nvidia stock.
The chart below shows the weekly Japanese candlesticks of Nvidia stock, whose price has risen by more than 2,000% since the October 2022 low.
So the question arises: is it too late to invest in Nvidia? Before answering this question, I would remind you that even within a long-term bullish trend, there will always be short-term corrections. A short-term correction (from a few trading sessions to several weeks) should be considered an opportunity when it concerns a stock whose fundamentals and technical analysis continue to send a bullish long-term signal.
For Nvidia stock, here is what you need to remember:
• The stock market valuation remains very reasonable, despite the strong rise in the share price over the past few years.
• The medium- and long-term technical analysis describes a perfectly intact underlying bullish trend.
• The Forward P/E ratio is around 17, a level that remains below that of many semiconductor industry leaders. This valuation is made possible by exceptional earnings growth, fueled by still very strong global demand for chips dedicated to artificial intelligence.
• The fundamental outlook remains excellent. Massive investments by cloud giants (Microsoft, Amazon, Alphabet and Meta), as well as by governments and major corporations in AI infrastructure, are providing durable support for demand for Nvidia GPUs.
The table below ranks the semiconductor companies in the S&P 500 according to their Forward P/E ratio. Micron and Nvidia remain relatively inexpensive despite their strong performance over recent months.
In conclusion, investing in Nvidia means investing in a company that continues to maintain a considerable lead in its market thanks to its CUDA software ecosystem, technological leadership and exceptional profitability. This obviously does not mean that the stock will no longer experience temporary correction phases — quite the opposite. However, as long as the fundamentals remain solid and the underlying trend remains bullish, these pullbacks can represent investment opportunities for long-term investors rather than signals of a lasting trend reversal.
The chart below shows the weekly Japanese candlesticks of Nvidia stock, together with the Ichimoku system and stock valuation data (P/E ratio, Price-to-Sales and Forward P/E).
From a technical analysis perspective, the underlying trend remains bullish as long as the weekly Ichimoku cloud continues to hold as support.
DISCLAIMER:
This content is intended for individuals who are familiar with financial markets and instruments and is for information purposes only. The presented idea (including market commentary, market data and observations) is not a work product of any research department of Swissquote or its affiliates. This material is intended to highlight market action and does not constitute investment, legal or tax advice. If you are a retail investor or lack experience in trading complex financial products, it is advisable to seek professional advice from licensed advisor before making any financial decisions.
This content is not intended to manipulate the market or encourage any specific financial behavior.
Swissquote makes no representation or warranty as to the quality, completeness, accuracy, comprehensiveness or non-infringement of such content. The views expressed are those of the consultant and are provided for educational purposes only. Any information provided relating to a product or market should not be construed as recommending an investment strategy or transaction. Past performance is not a guarantee of future results.
Swissquote and its employees and representatives shall in no event be held liable for any damages or losses arising directly or indirectly from decisions made on the basis of this content.
The use of any third-party brands or trademarks is for information only and does not imply endorsement by Swissquote, or that the trademark owner has authorised Swissquote to promote its products or services.
Swissquote is the marketing brand for the activities of Swissquote Bank Ltd (Switzerland) regulated by FINMA, Swissquote Capital Markets Limited regulated by CySEC (Cyprus), Swissquote Bank Europe SA (Luxembourg) regulated by the CSSF, Swissquote Ltd (UK) regulated by the FCA, Swissquote Financial Services (Malta) Ltd regulated by the Malta Financial Services Authority, Swissquote MEA Ltd. (UAE) regulated by the Dubai Financial Services Authority, Swissquote Pte Ltd (Singapore) regulated by the Monetary Authority of Singapore, Swissquote Asia Limited (Hong Kong) licensed by the Hong Kong Securities and Futures Commission (SFC) and Swissquote South Africa (Pty) Ltd supervised by the FSCA.
Products and services of Swissquote are only intended for those permitted to receive them under local law.
All investments carry a degree of risk. The risk of loss in trading or holding financial instruments can be substantial. The value of financial instruments, including but not limited to stocks, bonds, cryptocurrencies, and other assets, can fluctuate both upwards and downwards. There is a significant risk of financial loss when buying, selling, holding, staking, or investing in these instruments. SQBE makes no recommendations regarding any specific investment, transaction, or the use of any particular investment strategy.
CFDs are complex instruments and come with a high risk of losing money rapidly due to leverage. The vast majority of retail client accounts suffer capital losses when trading in CFDs. You should consider whether you understand how CFDs work and whether you can afford to take the high risk of losing your money.
Digital Assets are unregulated in most countries and consumer protection rules may not apply. As highly volatile speculative investments, Digital Assets are not suitable for investors without a high-risk tolerance. Make sure you understand each Digital Asset before you trade.
Cryptocurrencies are not considered legal tender in some jurisdictions and are subject to regulatory uncertainties.
The use of Internet-based systems can involve high risks, including, but not limited to, fraud, cyber-attacks, network and communication failures, as well as identity theft and phishing attacks related to crypto-assets.
OVX Oil Volatility: What Is It?The geopolitical situation in the Middle East is one of the key fundamental drivers of financial markets this year, and it is likely to remain so over the coming months. The price of U.S. crude oil (WTI) has a direct impact on the trend of headline inflation in the United States, which in turn will influence the Federal Reserve's monetary policy decisions later this year.
The higher the price of oil, the greater the probability that the federal funds rate will be increased. Conversely, if oil prices ease, the Federal Reserve should be able to maintain the status quo through the U.S. midterm elections.
Two tools are particularly useful for assessing the current pressure stemming from oil prices:
• Technical analysis of crude oil prices
• The OVX, the "VIX" of U.S. crude oil
The chart below displays the weekly Japanese candlesticks of U.S. crude oil (WTI), from which the U.S. gasoline price is directly derived. It also includes my technical chart mapping of crude oil, highlighting the key price levels and zones associated with inflationary pressure.
You can also monitor the U.S. crude oil price in real time on TradingView (ticker: USOIL) and immediately assess its impact on U.S. headline inflation.
The OVX (Cboe Crude Oil Volatility Index) measures the market's expected implied volatility for WTI crude oil over the next 30 days.
It is calculated using option prices on WTI crude oil. In other words, the OVX does not measure past oil price fluctuations; instead, it measures how much the options market expects oil prices to move over the coming weeks.
The table below summarizes the main OVX thresholds and what they imply in terms of future risk for U.S. crude oil prices. It is essentially the oil market's equivalent of the VIX: the higher the OVX, the greater the risk of a supply shock affecting crude oil prices.
A high OVX therefore reflects significant uncertainty regarding the future direction of oil prices. Conversely, a low OVX indicates a calmer market environment. The real value of this indicator comes from combining it with the WTI price itself: a rising oil price accompanied by a sharp increase in the OVX may signal a geopolitical shock or growing fears of supply disruptions.
In the current environment, a sharp rise in the OVX would therefore be an important signal to monitor for equity markets, inflation expectations, and the future path of Federal Reserve policy. Conversely, if the OVX declines before the Fed's September 16 policy decision, the central bank should be in a position to maintain its current policy stance.
The chart below displays the weekly Japanese candlesticks of the OVX, representing the expected implied volatility of U.S. crude oil.
DISCLAIMER:
This content is intended for individuals who are familiar with financial markets and instruments and is for information purposes only. The presented idea (including market commentary, market data and observations) is not a work product of any research department of Swissquote or its affiliates. This material is intended to highlight market action and does not constitute investment, legal or tax advice. If you are a retail investor or lack experience in trading complex financial products, it is advisable to seek professional advice from licensed advisor before making any financial decisions.
This content is not intended to manipulate the market or encourage any specific financial behavior.
Swissquote makes no representation or warranty as to the quality, completeness, accuracy, comprehensiveness or non-infringement of such content. The views expressed are those of the consultant and are provided for educational purposes only. Any information provided relating to a product or market should not be construed as recommending an investment strategy or transaction. Past performance is not a guarantee of future results.
Swissquote and its employees and representatives shall in no event be held liable for any damages or losses arising directly or indirectly from decisions made on the basis of this content.
The use of any third-party brands or trademarks is for information only and does not imply endorsement by Swissquote, or that the trademark owner has authorised Swissquote to promote its products or services.
Swissquote is the marketing brand for the activities of Swissquote Bank Ltd (Switzerland) regulated by FINMA, Swissquote Capital Markets Limited regulated by CySEC (Cyprus), Swissquote Bank Europe SA (Luxembourg) regulated by the CSSF, Swissquote Ltd (UK) regulated by the FCA, Swissquote Financial Services (Malta) Ltd regulated by the Malta Financial Services Authority, Swissquote MEA Ltd. (UAE) regulated by the Dubai Financial Services Authority, Swissquote Pte Ltd (Singapore) regulated by the Monetary Authority of Singapore, Swissquote Asia Limited (Hong Kong) licensed by the Hong Kong Securities and Futures Commission (SFC) and Swissquote South Africa (Pty) Ltd supervised by the FSCA.
Products and services of Swissquote are only intended for those permitted to receive them under local law.
All investments carry a degree of risk. The risk of loss in trading or holding financial instruments can be substantial. The value of financial instruments, including but not limited to stocks, bonds, cryptocurrencies, and other assets, can fluctuate both upwards and downwards. There is a significant risk of financial loss when buying, selling, holding, staking, or investing in these instruments. SQBE makes no recommendations regarding any specific investment, transaction, or the use of any particular investment strategy.
CFDs are complex instruments and come with a high risk of losing money rapidly due to leverage. The vast majority of retail client accounts suffer capital losses when trading in CFDs. You should consider whether you understand how CFDs work and whether you can afford to take the high risk of losing your money.
Digital Assets are unregulated in most countries and consumer protection rules may not apply. As highly volatile speculative investments, Digital Assets are not suitable for investors without a high-risk tolerance. Make sure you understand each Digital Asset before you trade.
Cryptocurrencies are not considered legal tender in some jurisdictions and are subject to regulatory uncertainties.
The use of Internet-based systems can involve high risks, including, but not limited to, fraud, cyber-attacks, network and communication failures, as well as identity theft and phishing attacks related to crypto-assets.
 Education
S&P 500 Valuation: Is the Final Upside Leg Still Ahead?While the "permabears" have been predicting a 50% stock market crash every single week for months (or even years in the most extreme cases), similar to those of 2001 and 2008, the S&P 500 Index has continued to extend its long-term bullish trend.
At the beginning of August, the index once again reached a new all-time high by breaking above 7,650 points on the S&P 500 futures contract. It is worth noting that the E-mini S&P 500 futures contract is the most heavily traded futures contract in the world in terms of trading volume.
In reality, trying to classify financial analysts and market forecasters into one of two camps—"permabear" versus "permabull"—is not a productive approach.
The chart below displays the daily Japanese candlesticks of the S&P 500 futures contract. The S&P 500 reached a fresh all-time high at the beginning of August.
Belonging to either of these camps means having a market bias, and having a bias can lead investors to drift too far away from the fundamental and technical factors that ultimately drive the market's primary trend.
A far better approach is to remain realistic, pragmatic, and methodical.
Let me give you an example. The S&P 500 has just posted another all-time high at the beginning of August. A permabear will tell you that the stock market crash is now closer than ever—a narrative they have been repeating for years. A permabull, on the other hand, may be pleased because the long-term uptrend continues to generate gains, but may also become overly optimistic regarding future price targets.
A realistic and methodical analyst instead determines price targets by relying on fundamental and technical criteria.
So, how high could the S&P 500 climb over the coming months? (Keep in mind that short-term corrections will always occur.) If the market were simply to return to its historical valuation peak, we can answer this question using the Shiller P/E and the Forward P/E.
The current Shiller P/E stands at 41, while its historical record, reached in 1999, is 43. This suggests that the S&P 500 could still have roughly 5% upside potential.
The current Forward P/E is 20, while the historical record is 23, implying approximately 15% additional upside potential for the S&P 500.
This is neither a permabull nor a permabear conclusion—it is simply a pragmatic one.
The chart below presents two versions of the Shiller P/E used to value the S&P 500 Index: the traditional version at the top and a normalized Z-score version below. In both cases, the upside target would simply be a return to the historical peak reached in December 1999.
The chart below illustrates the valuation of the S&P 500 based on the Forward P/E, which compares the market price to expected corporate earnings. The Forward P/E currently stands at 20, while the historical record is 23, implying approximately 15% upside potential for the S&P 500 Index.
DISCLAIMER:
This content is intended for individuals who are familiar with financial markets and instruments and is for information purposes only. The presented idea (including market commentary, market data and observations) is not a work product of any research department of Swissquote or its affiliates. This material is intended to highlight market action and does not constitute investment, legal or tax advice. If you are a retail investor or lack experience in trading complex financial products, it is advisable to seek professional advice from licensed advisor before making any financial decisions.
This content is not intended to manipulate the market or encourage any specific financial behavior.
Swissquote makes no representation or warranty as to the quality, completeness, accuracy, comprehensiveness or non-infringement of such content. The views expressed are those of the consultant and are provided for educational purposes only. Any information provided relating to a product or market should not be construed as recommending an investment strategy or transaction. Past performance is not a guarantee of future results.
Swissquote and its employees and representatives shall in no event be held liable for any damages or losses arising directly or indirectly from decisions made on the basis of this content.
The use of any third-party brands or trademarks is for information only and does not imply endorsement by Swissquote, or that the trademark owner has authorised Swissquote to promote its products or services.
Swissquote is the marketing brand for the activities of Swissquote Bank Ltd (Switzerland) regulated by FINMA, Swissquote Capital Markets Limited regulated by CySEC (Cyprus), Swissquote Bank Europe SA (Luxembourg) regulated by the CSSF, Swissquote Ltd (UK) regulated by the FCA, Swissquote Financial Services (Malta) Ltd regulated by the Malta Financial Services Authority, Swissquote MEA Ltd. (UAE) regulated by the Dubai Financial Services Authority, Swissquote Pte Ltd (Singapore) regulated by the Monetary Authority of Singapore, Swissquote Asia Limited (Hong Kong) licensed by the Hong Kong Securities and Futures Commission (SFC) and Swissquote South Africa (Pty) Ltd supervised by the FSCA.
Products and services of Swissquote are only intended for those permitted to receive them under local law.
All investments carry a degree of risk. The risk of loss in trading or holding financial instruments can be substantial. The value of financial instruments, including but not limited to stocks, bonds, cryptocurrencies, and other assets, can fluctuate both upwards and downwards. There is a significant risk of financial loss when buying, selling, holding, staking, or investing in these instruments. SQBE makes no recommendations regarding any specific investment, transaction, or the use of any particular investment strategy.
CFDs are complex instruments and come with a high risk of losing money rapidly due to leverage. The vast majority of retail client accounts suffer capital losses when trading in CFDs. You should consider whether you understand how CFDs work and whether you can afford to take the high risk of losing your money.
Digital Assets are unregulated in most countries and consumer protection rules may not apply. As highly volatile speculative investments, Digital Assets are not suitable for investors without a high-risk tolerance. Make sure you understand each Digital Asset before you trade.
Cryptocurrencies are not considered legal tender in some jurisdictions and are subject to regulatory uncertainties.
The use of Internet-based systems can involve high risks, including, but not limited to, fraud, cyber-attacks, network and communication failures, as well as identity theft and phishing attacks related to crypto-assets.
SpaceX: After the Crash, Is It Finally an Opportunity?In a market analysis I published on TradingView last June at the time of SpaceX’s IPO, I emphasized that, historically, IPOs on Wall Street have represented a very poor timing opportunity for investors, as the vast majority of newly listed stocks lost more than 50% of their value in the weeks or months following their IPO.
This was further reinforced by the fact that, at its IPO price, SpaceX shares were significantly overvalued from both a fundamental and market capitalization perspective.
Take another look at the table below, which I published on TradingView on June 20, showing that SpaceX’s valuation made a summer stock decline highly probable.
What was expected has therefore happened. SpaceX shares have lost more than 50% since the beginning of the summer, as the market needed to deflate a clearly excessive valuation.
The chart below shows the daily Japanese candlesticks of SpaceX shares.
The question investors are now asking is the following: should we start buying again after this more than 50% decline in the stock?
The answer must be based on both fundamental analysis and technical analysis of financial markets. The following criteria therefore need to be examined:
• The valuation level after the 50% stock price decline
• Technical analysis signals, even though the trading history remains too limited for a fully reliable structural analysis
The table below shows SpaceX’s market valuation after the 50% decline from its June peak. The valuation is now significantly more reasonable in terms of its relationship with EBITDA and revenue, but the forward P/E ratio remains very high, around 90 (the market is finally pricing in future profitability for SpaceX).
Therefore, a price level around $100 can be considered attractive from a fundamental perspective, but it will be necessary to confirm that the company is truly capable of becoming profitable in order to establish a major long-term market bottom.
In conclusion, any move of the stock below $100 can be considered an opportunity to build a position.
From a technical analysis perspective, the trading history is still too limited to provide a reliable signal, although below $100 the daily RSI should enter oversold territory, meaning below the 30 level.
DISCLAIMER:
This content is intended for individuals who are familiar with financial markets and instruments and is for information purposes only. The presented idea (including market commentary, market data and observations) is not a work product of any research department of Swissquote or its affiliates. This material is intended to highlight market action and does not constitute investment, legal or tax advice. If you are a retail investor or lack experience in trading complex financial products, it is advisable to seek professional advice from licensed advisor before making any financial decisions.
This content is not intended to manipulate the market or encourage any specific financial behavior.
Swissquote makes no representation or warranty as to the quality, completeness, accuracy, comprehensiveness or non-infringement of such content. The views expressed are those of the consultant and are provided for educational purposes only. Any information provided relating to a product or market should not be construed as recommending an investment strategy or transaction. Past performance is not a guarantee of future results.
Swissquote and its employees and representatives shall in no event be held liable for any damages or losses arising directly or indirectly from decisions made on the basis of this content.
The use of any third-party brands or trademarks is for information only and does not imply endorsement by Swissquote, or that the trademark owner has authorised Swissquote to promote its products or services.
Swissquote is the marketing brand for the activities of Swissquote Bank Ltd (Switzerland) regulated by FINMA, Swissquote Capital Markets Limited regulated by CySEC (Cyprus), Swissquote Bank Europe SA (Luxembourg) regulated by the CSSF, Swissquote Ltd (UK) regulated by the FCA, Swissquote Financial Services (Malta) Ltd regulated by the Malta Financial Services Authority, Swissquote MEA Ltd. (UAE) regulated by the Dubai Financial Services Authority, Swissquote Pte Ltd (Singapore) regulated by the Monetary Authority of Singapore, Swissquote Asia Limited (Hong Kong) licensed by the Hong Kong Securities and Futures Commission (SFC) and Swissquote South Africa (Pty) Ltd supervised by the FSCA.
Products and services of Swissquote are only intended for those permitted to receive them under local law.
All investments carry a degree of risk. The risk of loss in trading or holding financial instruments can be substantial. The value of financial instruments, including but not limited to stocks, bonds, cryptocurrencies, and other assets, can fluctuate both upwards and downwards. There is a significant risk of financial loss when buying, selling, holding, staking, or investing in these instruments. SQBE makes no recommendations regarding any specific investment, transaction, or the use of any particular investment strategy.
CFDs are complex instruments and come with a high risk of losing money rapidly due to leverage. The vast majority of retail client accounts suffer capital losses when trading in CFDs. You should consider whether you understand how CFDs work and whether you can afford to take the high risk of losing your money.
Digital Assets are unregulated in most countries and consumer protection rules may not apply. As highly volatile speculative investments, Digital Assets are not suitable for investors without a high-risk tolerance. Make sure you understand each Digital Asset before you trade.
Cryptocurrencies are not considered legal tender in some jurisdictions and are subject to regulatory uncertainties.
The use of Internet-based systems can involve high risks, including, but not limited to, fraud, cyber-attacks, network and communication failures, as well as identity theft and phishing attacks related to crypto-assets.
Fed/BoJ Alliance: Has the USD/JPY Final Top Been Confirmed?USD/JPY: Central banks say STOP to the yen’s decline!
The Japanese yen (JPY) has been following a long-term bearish trend in the FX market (meaning a bullish trend for USD/JPY) for more than 15 years. At the end of July, a massive coordinated intervention by the Fed and the BoJ triggered an 800-pip decline in USD/JPY. Tokyo and Washington have drawn a line under the yen’s depreciation. Has the definitive top been reached at 164 JPY?
The major event in the foreign exchange market this summer is therefore unprecedented for several decades: a coordinated United States–Japan intervention to support the yen. The key question for investors is now whether this is simply a technical rebound in the yen or the beginning of a genuine trend reversal in USD/JPY.
The answer depends on three factors: political willingness, the future monetary policies of the Fed and the BoJ, and the behavior of institutional traders in the USD/JPY market.
1) A historic intervention: Washington enters the yen debate
The United States and Japan carried out coordinated yen purchases, marking the first such intervention in several decades.
The context was the following:
• USD/JPY was trading close to 165, levels near the highest point reached in around 40 years.
• The yen was considered significantly undervalued by the US Treasury.
• Japan feared that further yen weakness could trigger:
• a renewed acceleration in imported inflation,
• an uncontrolled rise in Japanese bond yields,
• contagion spreading to the US bond market.
The Federal Reserve therefore used the US Exchange Stabilization Fund to support the Bank of Japan’s intervention.
The chart below shows the daily Japanese candlesticks of the USD/JPY exchange rate.
2) The yen carry trade creates structural selling pressure on the Japanese currency
This massive Japanese and US intervention caught institutional traders who were betting on further yen weakness (and therefore a continued rise in USD/JPY) off guard.
Institutional investors were heavily short the yen. Will they maintain these positions now that Washington and Tokyo are seeking a lower USD/JPY exchange rate and, more broadly, a weaker US dollar (DXY) on the FX market?
3) However, this double intervention will not be enough: the BoJ needs to raise rates and the Fed must at least maintain a neutral stance
From a fundamental perspective, two conditions need to come together to confirm that a major top was reached at 164 JPY on Thursday, July 23.
• The Bank of Japan needs to raise interest rates another one or two times before the end of 2026, particularly at the upcoming September 18 meeting.
• The Federal Reserve must maintain its current policy stance or, at worst, deliver no more than one additional rate hike by the end of the year (which would require a significant decline in oil prices and core inflation remaining under control).
The table below shows Bloomberg consensus expectations regarding the future evolution of USD/JPY through the end of the year.
4) From a technical perspective, USD/JPY must break below the weekly Ichimoku cloud to confirm a major top at 164 JPY
From a technical analysis perspective, it is still too early to confirm that the definitive top was reached at 165 JPY. The strong support zone around 150/152 JPY would need to be broken to the downside in order to generate a major bearish technical signal.
The chart below shows the weekly Japanese candlesticks of USD/JPY with the Ichimoku system.
DISCLAIMER:
This content is intended for individuals who are familiar with financial markets and instruments and is for information purposes only. The presented idea (including market commentary, market data and observations) is not a work product of any research department of Swissquote or its affiliates. This material is intended to highlight market action and does not constitute investment, legal or tax advice. If you are a retail investor or lack experience in trading complex financial products, it is advisable to seek professional advice from licensed advisor before making any financial decisions.
This content is not intended to manipulate the market or encourage any specific financial behavior.
Swissquote makes no representation or warranty as to the quality, completeness, accuracy, comprehensiveness or non-infringement of such content. The views expressed are those of the consultant and are provided for educational purposes only. Any information provided relating to a product or market should not be construed as recommending an investment strategy or transaction. Past performance is not a guarantee of future results.
Swissquote and its employees and representatives shall in no event be held liable for any damages or losses arising directly or indirectly from decisions made on the basis of this content.
The use of any third-party brands or trademarks is for information only and does not imply endorsement by Swissquote, or that the trademark owner has authorised Swissquote to promote its products or services.
Swissquote is the marketing brand for the activities of Swissquote Bank Ltd (Switzerland) regulated by FINMA, Swissquote Capital Markets Limited regulated by CySEC (Cyprus), Swissquote Bank Europe SA (Luxembourg) regulated by the CSSF, Swissquote Ltd (UK) regulated by the FCA, Swissquote Financial Services (Malta) Ltd regulated by the Malta Financial Services Authority, Swissquote MEA Ltd. (UAE) regulated by the Dubai Financial Services Authority, Swissquote Pte Ltd (Singapore) regulated by the Monetary Authority of Singapore, Swissquote Asia Limited (Hong Kong) licensed by the Hong Kong Securities and Futures Commission (SFC) and Swissquote South Africa (Pty) Ltd supervised by the FSCA.
Products and services of Swissquote are only intended for those permitted to receive them under local law.
All investments carry a degree of risk. The risk of loss in trading or holding financial instruments can be substantial. The value of financial instruments, including but not limited to stocks, bonds, cryptocurrencies, and other assets, can fluctuate both upwards and downwards. There is a significant risk of financial loss when buying, selling, holding, staking, or investing in these instruments. SQBE makes no recommendations regarding any specific investment, transaction, or the use of any particular investment strategy.
CFDs are complex instruments and come with a high risk of losing money rapidly due to leverage. The vast majority of retail client accounts suffer capital losses when trading in CFDs. You should consider whether you understand how CFDs work and whether you can afford to take the high risk of losing your money.
Digital Assets are unregulated in most countries and consumer protection rules may not apply. As highly volatile speculative investments, Digital Assets are not suitable for investors without a high-risk tolerance. Make sure you understand each Digital Asset before you trade.
Cryptocurrencies are not considered legal tender in some jurisdictions and are subject to regulatory uncertainties.
The use of Internet-based systems can involve high risks, including, but not limited to, fraud, cyber-attacks, network and communication failures, as well as identity theft and phishing attacks related to crypto-assets.