Gold pierced the 61.8% on the Fed move, then reclaimed itYesterday gold fell 132 dollars in four hours. Today it has taken all of it back and more.
The Federal Reserve raised the target range by 25 basis points to 3.75% to 4.00% in a unanimous decision, said inflation remains elevated, and left the door open to more. The candle that opened at 17:00 UTC ran from 4,367.76 down to 4,235.21 and closed at 4,264.19. Since then the market has rallied 138.51 dollars to 4,373.72, and trades at 4,373.19 on the ThinkMarkets feed with the candle still open.
What the low actually touched
The 61.8% retracement of the advance from 3,959.08 to the 24 August record at 4,696.56 sits at 4,240.80. Yesterday's low printed 4,235.21, which is 5.59 dollars beneath it, and the same candle closed at 4,264.19, some 23.39 dollars above it. So the level was breached intrabar and reclaimed by the close, not held untouched.
That is the deepest retracement gold has tested in this decline. The reaction has produced a 138.51 dollar rally from the low, just over three current four-hour ATRs of 44.6 dollars.
The descending boundary still overhead
Draw a line from the 24 August record through the 28 August high at 4,631.54 and every high since has stayed beneath it. It is worth about 4,386 today, roughly 12 dollars above this morning's high at 4,373.72. With two defining anchors it is a reference boundary rather than a multi-touch trendline, and the absence of candles above it supports its relevance without giving it independent tests.
That puts the whole of today's rally inside the zone that decides the structure: 4,367 to 4,390 holds yesterday's pre-decision high at 4,367.76, today's high, the 100 EMA at 4,375.93 and the descending line itself.
The rest of the map
Above that band, 4,402 to 4,435 carries the highs of 10 and 11 September, and 4,443 to 4,511 the highs of early September. Below price, 4,318 to 4,348 holds the 20 EMA at 4,317.78, the 50 EMA at 4,347.04, the 50% retracement at 4,327.82 and the 8 September low. Then 4,274 to 4,292, then 4,235 to 4,255 where the 61.8% and the last two lows sit.
RSI is 57.7 against its own average at 46.1, the highest reading since 10 September. Checked by hand against the last three lows, 4,291.96, 4,253.75 and 4,235.21, both price and momentum made lower lows, so there was no divergence at the bottom. Average true range is 44.6 dollars, which makes today's 138 dollar move slightly more than three average candles.
Scenarios
● Bullish: A four-hour close above 4,390 clears the 4,367 to 4,390 zone and the descending reference boundary together, the first improvement in the short-term structure since 24 August. The range high at 4,402.32 remains the next structural test, and a close above it would put 4,402 to 4,435 fully in play, with 4,443 to 4,511 beyond.
● Bearish: A four-hour close below 4,348 loses the upper edge of the first support zone and the 50 EMA, weakening the rebound. A close below the 50% retracement at 4,327.82 adds confirmation, and a break beneath roughly 4,317.7 clears the rest of the zone and the 20 EMA, exposing 4,274 to 4,292 and then 4,235 to 4,255.
● No confirmation: Four-hour closes between 4,348 and 4,390 leave gold without a confirmed break. Closes between 4,348 and 4,367 keep price below the resistance zone while the rebound holds above first support, and closes inside 4,367 to 4,390 are a test of the decision zone rather than a break through it.
What this tells us
A level that gets pierced and recovered in the same candle is more informative than one that is respected to the dollar. The 61.8% was breached by 5.59 and reclaimed by 23.39 on the close, which shows demand appeared quickly after the break and was strong enough to take the level back within the same four hours.
The harder question is overhead, and it has two parts. Clearing 4,390 would break the resistance zone and the boundary; the range high at 4,402.32 is a separate test after it. So: does this rally clear the first, and then the second?
Any opinions, news, research, analyses, prices or other information contained on this website is provided as general market commentary and does not constitute investment advice. ThinkMarkets will not accept liability for any loss or damage including, without limitation, to any loss of profit which may arise directly or indirectly from use of or reliance on such information.
USD/JPY failed at the 23.6% and closed back inside supportThe yen took 751 pips out of the dollar in four sessions. The bounce lasted one day, and today it lasted one candle.
USD/JPY trades at 153.362 on the ThinkMarkets feed. The candle that opened at 09:00 UTC reached 154.473, gave back 106 of the 112 pips gained on Wednesday, and closed at 153.459, back inside the support band it had left.
Where the bounce stopped
Measured up from the 8 September low at 152.874, the 23.6% retracement of the decline from 160.387 sits at 154.647. Wednesday's high printed 154.669. Two pips. The rebound lasted exactly as long as the shallowest retracement allowed, and the deeper levels at 155.744 and 156.630 were never approached.
The line that broke, then did not hold
Two descending boundaries frame this decline. The outer one runs from the 2 September high at 160.387 and has no high above it since. The inner one rests on the 4 September high at 156.744 and the 10 September high at 154.669, and is worth 154.150 today.
Today's candle traded 32 pips above that inner line before closing 69 pips back below it. That is the first attempt at the structure of the decline, and it failed inside the same four hours.
The levels that matter
Above price, 154.18 to 154.67 is the crowded band: the 20 EMA at 154.185, the 23.6% retracement, the 10 September high and today's high. Then 155.28 to 155.75 with the 50 EMA and the 38.2%, and 156.63 to 156.75 with the 50%. All four moving averages sit above price in bearish order, at 154.185, 155.410, 156.788 and 158.329.
Below price, 153.28 to 153.51 holds the lows of the last three sessions, and price is inside it now. Beneath that, 152.87 to 153.05 is the base floor, where two lows sit a pip apart at 152.874 and 152.934. Below 152.874 this chart carries no prior structure.
Scenarios
● Bullish: A four-hour close above 154.67 clears the retracement cluster and confirms the break of the inner boundary rather than leaving it intraday, opening 155.28 to 155.75.
● Bearish: A close below 153.28 leaves the base floor at 152.87 to 153.05 as the last mapped structure on this timeframe.
● No confirmation: Closes between 153.28 and 154.18 keep the pair inside the base, under the retracement cluster and above the recent lows.
What this tells us
The depth of a bounce tells you how the market is treating the move it is correcting. A recovery that stalls at the 23.6% is pausing inside a trend, not arguing with it. The 38.2% and 50% are the levels that would start that argument, and neither has been reached.
Today added a second detail worth keeping. A line can be broken intraday and repaired by the close, and the close is the part that counts. So: does the base hold a third time, or does this candle turn out to be the first of the next leg?
Risk warning
Any opinions, news, research, analyses, prices or other information contained on this website is provided as general market commentary and does not constitute investment advice. ThinkMarkets will not accept liability for any loss or damage including, without limitation, to any loss of profit which may arise directly or indirectly from use of or reliance on such information.
EUR/USD clears the range and meets the August lineLast week the euro could not hold a close above 1.16241. This week it has closed above it four times, and the sequence tells you more than the count.
EUR/USD trades at 1.16456 on the ThinkMarkets feed, having cleared the range that contained it from 31 August through 8 September, reclaimed the 38.2% retracement, and moved above all four moving averages, which now sit beneath price as potential dynamic support. The reward for all that work is a meeting with the line that has capped every rally since 21 August.
What actually changed
On 3 September the descending boundary through the 28 August high sat at 1.16182 and the market failed two pips short of it. That line is now at 1.15752, about 70 pips below price. Being left behind is the clearest thing a resistance line can do.
The range went the same way, though not in a straight line. The first close above 1.16241 came on 7 September at 1.16262, price slipped back inside on 8 September, and since the 8 September 21:00 UTC close at 1.16315 three further completed candles have closed above it. One close above a level is an initial break; repeated closes strengthen the case that price is being accepted beyond the old resistance.
The line that is left
Draw from the 21 August high at 1.17110 to today's high at 1.16538 and you get a boundary worth 1.16531, drifting lower by about 4 pips a day. Today's high is one of its two anchors, so this is not yet a line the market has been rejected from twice; it is a line the market has just reached.
A gravestone doji is forming on the live candle right underneath it. That is worth noting and nothing more until it closes.
Where the floor is now
1.1621 to 1.1635 carries the 20 and 50 EMAs, the 38.2% retracement at 1.16341 and this morning's low at 1.16214, which is also the engulfing candle's invalidation. Beneath that, 1.1607 to 1.1612 pairs the 100 EMA with the 50% retracement at 1.16105. Then 1.1580 to 1.1587, where the 200 EMA at 1.15800, the 61.8% at 1.15869 and the 4 September low all sit together.
Momentum agrees with price rather than warning about it. Checked by hand, the lows since 2 September rise and so do the readings under them, and RSI at 63.5 is above its own average at 55.7. The bullish divergence identified on 3 September has since resolved into a higher sequence and is no longer active in the current structure.
The week decides it
The ECB announces on Thursday, US producer prices land the same day and August CPI on Friday, the final CPI release before the Fed meets on 15 and 16 September. Both sides of this pair have a scheduled catalyst inside 48 hours, which is unusual and worth respecting.
Scenarios
● Bullish: A four-hour close above the descending boundary, currently near 1.16531, is the first indication of an upside break. A close above 1.1664 clears the R1 band and the 23.6% retracement at 1.16633 with it, opening 1.1676 to 1.1690 and then 1.1705 to 1.1712. Because the line has only two anchors, the zone clearance carries more weight than the line break alone.
● Bearish: A four-hour close below 1.1621 breaks the lower edge of S1 and places price beneath the 20 and 50 EMAs and the engulfing invalidation at 1.16214, putting 1.1607 to 1.1612 in play where the 100 EMA and the 50% retracement converge. Below that, 1.1580 to 1.1587 holds the 200 EMA and the 61.8%.
● No confirmation: Four-hour closes above the former range high at 1.16241 but below the descending boundary keep EUR/USD outside the old range without confirming a break through the August line. A close between 1.1621 and 1.16241 would be a partial re-entry into the former range with the first support cluster still intact. The boundary is dynamic, so its trigger value is refreshed as each candle forms.
The lesson worth keeping
A level that has repeatedly rejected price carries different evidential weight from a line that has only just acquired its second anchor. EUR/USD has reached the latter: the descending boundary from the August high is technically relevant, but today's high is part of the line's construction rather than an independent rejection from it. That is why a four-hour close through it would matter more than the touch, and why a close above the R1 zone would be the stronger confirmation.
So: does the euro clear the line from the August high before Thursday, or does the ECB decide it for us?
Risk warning
Any opinions, news, research, analyses, prices or other information contained on this website is provided as general market commentary and does not constitute investment advice. ThinkMarkets will not accept liability for any loss or damage including, without limitation, to any loss of profit which may arise directly or indirectly from use of or reliance on such information.
Gold ran out of room to wait - 39 points to decideGold has spent the past several sessions compressing after a sharp rebound and reversal, and the compression is now the story.
Since the 2 September low at 4,282.51 the highs have stepped down and the lows have stepped up, and the two lines that describe them are now 39 points apart. The average four-hour candle is 35, so the room left inside is about one candle's worth.
Where the squeeze actually is
The upper boundary sits at 4,428 and falls about 29 points a day. The lower one is at 4,389 and rises about 24. No candle has traded beyond either since 2 September, which supports the geometry, although both lines still rest on two anchors and should be read as developing rather than established.
Price is at 4,398 on the ThinkMarkets spot feed, roughly in the middle, and the walls are closing at more than 50 points a day between them.
Above price: five reasons in one zone
4,412 to 4,443 is where everything overhead lives. The 38.2% retracement of the 3,959.08 to 4,696.56 advance sits at 4,414.84, the 20 EMA at 4,418.36, the 100 EMA at 4,434.28, the 50 EMA at 4,440.45, and today's high stopped at 4,442.95. Several overlapping references in 31 points, which is why every rally this week has died inside it.
Beyond it, 4,479 to 4,511 holds last week's highs, and the primary descending line from the 24 August record is at 4,507.
Below price: the 200 EMA is doing the work
4,375.8 to 4,391 has the 200 EMA at its floor and four lows inside it, from 4,381.01 to 4,390.50. Gold has not closed a four-hour candle under that average since early August. Beneath it, 4,327.8 to 4,366 carries the 50% retracement at 4,327.82.
What could break it
Producer prices land on Thursday and August CPI on Friday, the last inflation print before the Fed decides on 16 September, and officials have been in blackout since 5 September. Worth being precise about what Friday measures: August. This week's energy rally feeds forward expectations and later prints, not the number being published.
Completed four-hour volume readings on the ThinkMarkets feed were 6.84, 7.82 and 7.39 million against a 6.87 million median over the previous sixty bars, so the compression has not coincided with obviously depressed feed activity. Spot gold has no consolidated central volume, so treat this as feed activity rather than exchange turnover.
Scenarios
● Bullish: A four-hour close above the dynamic upper reference boundary, currently near 4,428, is the first indication of an upside break. A close above 4,443 clears the whole R1 cluster and puts 4,479 to 4,511 in play, with the primary descending line at 4,507 inside it, and 4,565 to 4,585 beyond.
● Bearish: A four-hour close below the developing rising boundary, currently near 4,389, is the first indication of a downside break. A close below about 4,375.8 loses the first support zone and the 200 EMA together, exposing 4,327.8 to 4,366 where the 50% retracement sits.
● No confirmation: Four-hour closes between the two dynamic boundaries keep gold inside the compression. At the current candle they are near 4,389 and 4,428, and both move as new candles form, so the band narrows by roughly 50 points a day. A close beyond one line without clearing the surrounding zone is an initial break rather than full confirmation.
The lesson worth keeping
A converging structure is a timing framework rather than a directional signal. As its boundaries approach each other the room to stay inside narrows, which raises the likelihood of a near-term break without guaranteeing its timing, direction or quality. The useful preparation is knowing both dynamic levels in advance, and separating an initial line break from confirmation through the zone behind it.
So: does gold break the ceiling it has failed at five times, or lose the average it has held for a month? What are you watching into Friday?
Risk warning
Any opinions, news, research, analyses, prices or other information contained on this website is provided as general market commentary and does not constitute investment advice. ThinkMarkets will not accept liability for any loss or damage including, without limitation, to any loss of profit which may arise directly or indirectly from use of or reliance on such information. Brent tests its six-week ceiling on fading momentumBrent has spent six weeks working towards one price. It printed 96.15 on 23 July, 96.03 on 2 September, 96.17 on 3 September and 96.32 this morning, four attempts inside a forty cent band, and it trades at 95.93 on the ThinkMarkets spot feed as this is written. Each attempt has arrived with less momentum than the one before, which is the question the week turns on.
Key topics covered
● A four-attempt ceiling at 96: The band runs 95.95 to 96.35, about a third of the 1.15 ATR, so this is a precise level rather than a broad area. Above it the chart has no prior structure since early July.
● Momentum falls as price rises: RSI read 80.5 at the 2 September high, 73.3 on 3 September and 61.1 at this morning's 96.32. Three higher highs against three lower readings is a bearish divergence, and it is the clearest thing on the chart.
● Holiday session, ordinary volume: US stock and bond markets are shut for Labor Day, so activity was expected to be thin. Today's completed four-hour bars traded 5.08, 4.76 and 5.21 million against a 5.03 million median over the last sixty bars, so the move has not happened on depleted activity.
● The war premium, and what CPI can and cannot say: Iran struck US-linked bases in Kuwait last week and Washington hit three Iranian tankers over the weekend. Roughly 17 million barrels crossed Hormuz in a single day earlier in the week, but shipping deteriorated again over the weekend, with commodity-vessel traffic averaging about ten a day, the lowest since May. Friday brings August CPI, and it will reflect energy prices during August, not this week's move; the current rise matters for forward expectations and later prints. PPI lands Thursday, the Fed decides on 16 September and is in blackout.
The setup
The structure beneath price is layered and each layer has more than one reason to exist. The ascending channel from the 7 August low carries rails at 86.99 and 97.15, with the upper one touched on 2 September. Inside it, a steeper rising line from the 27 August low sits at 93.28, which puts it inside the 92.49 to 93.53 support zone alongside the 50 EMA at 92.50 and the 23.6% retracement at 93.53.
Flat top with rising lows is a potential ascending triangle. The horizontal side is well defined by four attempts; the rising side has two anchors and is a developing reference line, so treat the pattern as forming rather than confirmed. Above price there is nothing horizontal until the ceiling, though the channel's upper rail near 97.15 sits above it. Below, 94.34 to 94.80, then the confluence at 92.49 to 93.53, then 90.65 to 91.81 with the 38.2% retracement at its top. If that fails, the deeper references are the 50% at 90.41, the 61.8% at 89.02 and the 200 EMA at 88.62.
The advance into the ceiling was built on stacked bullish candles: a hammer and morning star on 4 September, three white soldiers after them, and a bullish engulfing this morning. Of their invalidation levels, only 94.51 sits inside a support zone; 93.552 sits just above the 92.49 to 93.53 band and 91.996 just above 90.65 to 91.81.
Scenarios
● Bullish: A four-hour close above 96.35 confirms an initial break of the four-attempt ceiling. The developing channel's upper rail near 97.15 is then the next dynamic resistance, and a sustained move above it would leave less nearby structure overhead. A close back inside 95.95 to 96.35 weakens the breakout reading; a close below 94.34 is the deeper failure.
● Bearish: A four-hour close below 94.34 breaks the first support zone and gives price confirmation consistent with the momentum divergence, putting 92.49 to 93.53 in play, where the 50 EMA, the 23.6% retracement and the rising reference line converge.
● No confirmation: Four-hour closes between 94.34 and 96.35 leave Brent inside the decision band between first support and the ceiling, below breakout territory and above the first failure level. The rails and the rising line are dynamic, so their values move with each candle, and closes inside the band leave the market unresolved into Thursday's PPI and Friday's CPI.
What this tells us
A market that keeps reaching the same price with less force each time is being supplied there. That is what the divergence describes, and it is a warning about momentum rather than a forecast: the confirmation, either way, is a four-hour close. The fourth attempt at 96.35 is where either the sellers run out or the buyers do, and the answer arrives before the inflation data does.
Risk warning:
Any opinions, news, research, analyses, prices or other information contained on this website is provided as general market commentary and does not constitute investment advice. ThinkMarkets will not accept liability for any loss or damage including, without limitation, to any loss of profit which may arise directly or indirectly from use of or reliance on such information.
EUR/USD holds 1.15661 to the pip - reclaim or fade?EUR/USD recorded a low at 1.15661 on Wednesday, the same price as the floor of the range it has traded since 31 August, and has since rebounded to 1.16016 without a close below it. This analysis argues that the range is intact at both ends and that the rebound has run into the same descending structure that has capped every attempt since the August high.
Key topics covered
Both trigger levels from yesterday's map were respected: The bearish condition required a four-hour close below 1.15661 and the market recorded exactly that price without closing beneath it, the 05:00 UTC candle finishing at 1.15729. The bullish condition required a close above 1.1616 and today's high at 1.16141 fell two pips short of it.
Payrolls is the key remaining catalyst: ADP came in at 38,000 on Wednesday against a 47,000 forecast on the desk feed. CME FedWatch had September hike pricing around the mid-60% area in the latest desk snapshot, and that reading should be time-stamped at publication. EUR/USD has generally moved inversely with the recent dollar and US rate repricing since the 21 August high.
The rebound has stopped inside a cluster: The 100 EMA at 1.16009, the 50% retracement at 1.16105, the 50 EMA at 1.16117 and the steeper descending boundary at 1.16121 all sit within a dozen pips of each other, and price closed the last candle at 1.16016 among them.
The setup
Two descending reference boundaries cap the recovery attempts from the 1.17110 high. The primary one runs from that 21 August high through the 28 August high at 1.16577, has no high above it since, and is worth 1.16182 today. The steeper one runs from the 28 August high through today's 05:00 UTC high at 1.16141, and today's second high at 1.16118 sits within half a pip of it. That gives it three contacts, but two of them are the last two candles, so it is a young boundary rather than an established one.
The range since 31 August runs 1.15661 to 1.16241, a span of 58 pips, with the 200 EMA at 1.15671 sitting one pip above the floor, inside the first support zone. Fibonacci as drawn on the reference chart, 1.15105 to 1.17105, puts the 50% at 1.16105 inside the first resistance area, the 61.8% at 1.15869 between price and the floor, and the 78.6% at 1.15533 just beneath the second support zone.
Above price, the first zone runs 1.1610 to 1.1620 and holds the 50% retracement, the 50 EMA and the steeper boundary, with the primary boundary at 1.16182 inside it as well. The second runs 1.1624 to 1.1634, the range high and the 38.2% retracement at 1.16341. The third runs 1.1645 to 1.1665, the late August bases with the 23.6% at 1.16633 among them.
Below price, the first zone runs 1.1566 to 1.1580 and holds the range floor at 1.15661, the 200 EMA one pip above it, and the lows of 30 August and Wednesday. The second runs 1.1553 to 1.1562, holding the 12 August high and the 78.6% retracement. The third runs 1.1525 to 1.1545, the mid-August base.
RSI is around 50, recovered from 31.5 on Wednesday, and there is a regular bullish divergence in place: Wednesday's low at 1.15661 undercut the 28 August low at 1.15770 while RSI made a higher low, 31.5 against 25.3. There is no channel, no flag, pennant, triangle, wedge, double bottom or head and shoulders on this timeframe, and no live candlestick pattern in the last ten candles.
Scenarios
Bullish - the resistance cluster is cleared: A four-hour close above 1.1620 would clear the immediate EMA and Fibonacci cluster and both descending reference boundaries, improving the very short-term structure. The pair would still need to clear the range high at 1.16241, and a close above the 38.2% retracement at 1.16341 would provide stronger breakout confirmation and put 1.1645 to 1.1665 in play. A broader reversal of the decline from 1.17110 would require further confirmation still.
Bearish - the range floor gives way: A four-hour close below 1.15661 would confirm a break of the range floor and, because the 200 EMA sits slightly above it at 1.15671, would place price below that average at the same time. The divergence would also be invalidated. The 78.6% retracement at 1.15533 and the 1.1553 to 1.1562 zone would then become the next technical references, and a sustained break beneath that area would expose the 1.1525 to 1.1545 mid-August base.
No confirmation: Four-hour closes between 1.15661 and the 50% retracement near 1.16105 keep EUR/USD inside the range without a meaningful resistance reclaim. Closes above the 50% but below the 1.16241 range high are partial technical improvement, and depending on the exact close price may clear one or both descending reference boundaries without yet confirming a range breakout.
What this tells us
Wednesday's low matched the 1.15661 range floor exactly on the reference feed, which makes the reaction technically notable, and the 200 EMA at 1.15671 sits one pip above the floor, adding confluence to the same support area. The exactness of the touch should not by itself be treated as proof of a durable floor, and feeds differ by a pip on a level like this.
What adds to it is the momentum reading underneath. A lower low in price against a higher low in RSI is the classic bullish divergence, and it says the second push down carried less force than the first. It is a condition, not a signal: it strengthens the case for the floor while price holds above it, and it disappears the moment 1.15661 gives way on a close.
Does EUR/USD clear the 1.1620 cluster and take on the range high, or does payrolls send it back to test 1.15661 for a second time?
Any opinions, news, research, analyses, prices or other information contained on this website is provided as general market commentary and does not constitute investment advice. ThinkMarkets will not accept liability for any loss or damage including, without limitation, to any loss of profit which may arise directly or indirectly from use of or reliance on such information. Gold: the 200 EMA held where payrolls should have broken itA jobs report three times consensus should have been enough to break gold's recovery. It very nearly was. Price fell from $4,479.39 to $4,378.16 in the release candle, closed it at $4,393.83 below the 38.2% retracement, then took the next candle down to $4,365.54, through the 200 EMA. And there the selling stopped. Gold is back at $4,417.14, above the retracement it had just lost.
Key topics covered
● Payrolls beat by a wide margin: 162,000 jobs in August against a Reuters consensus of 56,000, unemployment steady at 4.1%, earnings up 0.3% on the month and 3.1% on the year. Revisions added another 55,000 across June and July, turning July from a 23,000 loss into a 21,000 gain. The dollar rallied and gold lost around 100 points within minutes.
● The reversal was contained at the 200 EMA: The average sits at $4,371.16 and today's low pierced roughly six points through it before buyers took price back over $4,410. On the four-hour chart that is a pierce, not a break, and it is the single most useful thing that happened after the release.
● Wednesday's breakout has been undone: Our 3 September map called for a close above $4,468, which came at $4,493.41 and carried price to $4,510.84. Two sessions later the whole move is gone. The 20, 100 and 50 EMAs at $4,434.54, $4,440.11 and $4,457.71 are overhead again.
The setup
The 38.2% retracement of the $3,959.08 to $4,696.56 advance sits at $4,414.84 and has become the pivot of the week. Gold reclaimed it on Wednesday, lost it on the payrolls close, and is trading just above it again. Below, the 50% at $4,327.82 has not been tested since Tuesday's low.
The support that matters runs $4,365 to $4,397: today's low, the 200 EMA, the payrolls low at $4,378.16, Wednesday's low at $4,387.37 and the 31 August low at $4,396.39, all in a 32 point band. Beneath it, $4,327.8 to $4,341 combines the 50% retracement with the invalidation of Tuesday's bullish engulfing at $4,330.66. Then $4,282 to $4,305, the low of the move.
Overhead, $4,414 to $4,441 holds the retracement and the two nearest moving averages. Above that, $4,459 to $4,495 and then $4,510 to $4,525, where yesterday's high meets the 23.6% at $4,522.51.
RSI at 46 confirms what the price action already shows: momentum has drained out of the rebound without turning oversold. The ascending line from the 29 July low, worth about $4,312 today, sits well below the action and is not in play this session.
Scenarios
● Bullish: A four-hour close above $4,414.84 recovers the retracement and reopens $4,459 to $4,495. Invalidated by a close under $4,365.
● Bearish: A close below $4,365 breaks the cluster and the 200 EMA together and points to $4,327.8 to $4,341, where the engulfing invalidation sits.
● No confirmation: Closes between $4,365 and $4,415 leave gold under the short-term averages but above the 200 EMA, which is where the payrolls candle has parked it.
What this tells us
The number was hawkish, the reaction was immediate, and the market still could not close gold below a moving average that has been beneath price since early August. That tells you more about where the buyers are than the headline does. Bias stays neutral while $4,365 holds and the 38.2% is unresolved; the four-hour close is what settles it.
Risk warning
Any opinions, news, research, analyses, prices or other information contained on this website is provided as general market commentary and does not constitute investment advice. ThinkMarkets will not accept liability for any loss or damage including, without limitation, to any loss of profit which may arise directly or indirectly from use of or reliance on such information. GBP/USD in the lower half of a late-August channelGBP/USD recorded a low at 1.34735 on Wednesday, within nine pips of the lower rail of a developing channel framework that has contained the decline from 1.36750, and has since spent six candles making slightly higher lows without reclaiming 1.3510. This analysis argues that the pair is compressing between the 1.3470 support area and an inner descending boundary, and that the sequence in which those two give way is what changes the picture.
Key topics covered
A developing channel framework has contained price so far: The upper rail runs from the 21 August high at 1.36750 through the 25 August high at 1.36544 with no high above it since, and the parallel rail 131 pips beneath was touched once, by Wednesday's low at 1.34735. Two anchors above and a single interaction below is enough to frame the decline, not enough to treat either edge as an established barrier. At the current candle the rails sit near 1.35955 and 1.34647, and both move roughly nine pips lower per trading day.
An inner boundary is doing the closer work: A steeper line from the 28 August high at 1.35973 through the 1 September high at 1.35517 sits at 1.35099 now, and today's high at 1.35033 stopped seven pips beneath it. It has two anchors, so it is a developing reference boundary rather than an established trendline, and it falls about twenty-three pips per trading day.
Payrolls is the key remaining catalyst: ADP came in at 38,000 on Wednesday against a 47,000 forecast on the desk feed, with other surveys nearer 48,000. CME FedWatch had September hike pricing around the mid-60% area in the latest desk snapshot, and because that probability moves intraday the reading should be time-stamped at publication. Friday's non-farm payrolls at 8:30 New York time could materially reinforce or challenge that pricing, and sterling has remained sensitive to shifts in US rate expectations through the week.
The setup
Fibonacci on the leg that produced the high, 1.34170 to 1.36750, puts the 61.8% at 1.35156 inside the first resistance zone and the 78.6% at 1.34722 inside the first support zone. Wednesday's low at 1.34735 printed thirteen pips above that 78.6% retracement, which is what gives the first support zone its measured component.
Above price, the first zone runs 1.3500 to 1.3525 and holds the highs of the last two days, the inner boundary at 1.35099, the 61.8% retracement, and the 18 and 30 August lows that have flipped overhead. The second runs 1.3545 to 1.3577, the 50% at 1.35460 with the 12 August and 31 August highs, and the 38.2% at 1.35764 inside its upper edge. The third runs 1.3595 to 1.3620, the 27 August high with the upper channel rail passing through it.
Below price, the first zone runs 1.3470 to 1.3483, Wednesday's low, the 13 August low and the 78.6% retracement, with the lower channel rail at 1.34647 just beneath. The second runs 1.3417 to 1.3434, the 3 and 7 August lows. The third runs 1.3273 to 1.3283, the late July base.
The last six candles have made higher lows, 1.34735 then 1.34744, 1.34767, 1.34801, 1.34829 and 1.34893, which is a short rising sequence rather than a defined line, since two of those are consecutive and none of them has been retested. Checked by hand against the last two swing lows, Wednesday's low at 1.34735 came with a higher momentum reading than the 13 August low at 1.34739 produced, so momentum is not confirming a weaker market at the same price. There is no flag, pennant, triangle, wedge, double bottom or head and shoulders on this timeframe, and no live candlestick pattern in the last ten candles.
Scenarios
Bullish - the inner boundary breaks: A four-hour close above the inner descending boundary, currently near 1.35099, would be an initial break of the structure that has capped the last three sessions. A close above 1.3525 would be stronger confirmation, clearing the first zone and the 61.8% retracement together and putting 1.3545 to 1.3577 in play. The upper channel rail near 1.35955 would remain a later reference rather than an immediate one.
Bearish - support weakens, then the lower rail fails: A four-hour close below 1.3470 would be the first deterioration, losing the support zone and the 78.6% retracement inside it, while price would still sit within the channel framework as long as it holds above the lower rail near 1.34647. A subsequent close beneath that rail would be stronger confirmation and would put 1.3417 to 1.3434 in play, with the late July base at 1.3273 to 1.3283 beneath it.
No confirmation: Four-hour closes above 1.3470 and below the inner descending boundary, currently near 1.35099, keep GBP/USD inside the compression without a confirmed break either way. Both descending boundaries move with time, roughly nine and twenty-three pips lower per trading day, so their values are updated for each new candle rather than treated as fixed triggers.
What this tells us
A channel is only useful while both of its rails are doing work. This one has an upper rail with two contacts and a lower rail with a single interaction, which is enough to frame the decline but not enough to treat either edge as an established barrier. What gives the area beneath price its weight today is not the rail itself but what sits with it: the 78.6% retracement at 1.34722, the 13 August low at 1.34739 and Wednesday's low at 1.34735, all within a handful of pips.
That is usually the more honest way to read a level. A line drawn between two points is a hypothesis, while a price area identified by several separate technical references carries more analytical weight than any one of them alone. Convergence makes an area worth monitoring; confirmation still depends on how price behaves when it is tested.
Does GBP/USD close above the inner boundary and work back toward the middle of the channel, or does payrolls push it through the lower rail?
Any opinions, news, research, analyses, prices or other information contained on this website is provided as general market commentary and does not constitute investment advice. ThinkMarkets will not accept liability for any loss or damage including, without limitation, to any loss of profit which may arise directly or indirectly from use of or reliance on such information. Bitcoin reclaims 76,970 and coils — break or fade?Bitcoin has closed back above the 23.6% retracement at $76,969.64 and now trades around $77,800 to $78,000, inside a structure that has been narrowing since 1 September, with its upper boundary near $78,025 and its lower boundary near $77,235. This analysis argues that the base cluster has held so far and that the next four-hour close outside either of those boundaries is the first thing to watch, with the surrounding zones providing the stronger confirmation.
Key topics covered
Yesterday's bullish condition was met: Our 2 September map required a four-hour close above $77,500 and the 00:00 UTC candle closed at $77,662. The bearish condition required a close below $76,200, and the low recorded on Wednesday was $76,204.27, four points above that edge, with no close beneath it.
The 23.6% level has flipped back: Measured on the anchors drawn on the reference chart, $62,601.28 to $81,408.04, the 23.6% retracement sits at $76,969.64. It capped the market on Wednesday and price has now closed above it four times in a row, which strengthens the reclaim and makes it a potential support reference. A successful retest from above would give cleaner confirmation of a resistance to support flip.
Payrolls is the key remaining catalyst: ADP came in at 38,000 on Wednesday against a 47,000 forecast on the desk feed. CME FedWatch had September hike pricing around the mid-60% area in the latest desk snapshot, time-stamped at publication, and Bitcoin has remained sensitive to shifts in US rate expectations and broader risk sentiment throughout the week.
The setup
Price is developing a converging structure since 1 September rather than a range. The descending upper boundary is the better established of the two sides; the rising lower boundary has only two anchors so far and should be treated as a developing reference.
The upper boundary can be anchored at the 28 August high of $81,438.30 or at the 1 September high of $79,179.57 and lands within two points of the same place either way, $78,024 against $78,025, with no high above it on either anchoring. Today's high at $78,022.58 sits a point or two beneath it. The wider anchoring is the more useful one, since it makes the line a descending resistance boundary across the broader decline rather than across the last two days.
Its lower boundary rises from Wednesday's low at $76,204.27 through today's early low at $77,063.43 and is worth about $77,235. At their current slopes the two converge toward an apex within the next few candles, which increases the likelihood of a near-term break without implying that price must break by the apex, or in which direction.
Above price, the first zone runs $77,900 to $78,120 and holds that upper boundary. The second runs $78,400 to $78,650, the highs of 1 September. The third runs $79,180 to $79,380, the highs of 30 and 31 August.
Below price, the first zone runs $76,900 to $77,240, four lows between $76,906 and $77,063 with the 23.6% retracement and the rising boundary inside it. The second runs $76,200 to $76,660, the base cluster tested twice this week. The third runs $75,400 to $75,700, the 23 August low that anchors the whole August range between $75,577 and $81,438.
Beneath the range, price structure is sparse: the 17 to 21 August advance was vertical, so the next references are measured ones, the 38.2% at $74,223.86, the 50% at $72,004.66 and the 61.8% at $69,785.46. RSI is around 50, recovered from 33.6 on Wednesday. Checked by hand, the 1 September low at $76,363.88 with RSI at 38.8 and Wednesday's low at $76,204.27 with RSI at 35.2 were both lower, so there is no divergence. There is no flag, pennant, double bottom or head and shoulders on this timeframe beyond the converging structure itself.
Scenarios
Bullish - the upper boundary breaks: A four-hour close above the descending boundary, currently around $78,025, would be an initial break from the developing structure. A close above $78,120 would be stronger confirmation, clearing the whole first resistance zone and putting $78,400 to $78,650 in play, with $79,180 to $79,380 above that. Clearing that higher area would remove another lower-high zone and strengthen the short-term recovery; a broader reversal of the decline from $81,438 would still require confirmation through the higher swing structure.
Bearish - the rising boundary fails: A four-hour close below the rising reference boundary, currently near $77,235, would be an initial downside break from the developing structure. A close below $76,900 would be stronger confirmation, losing the 23.6% retracement and the first support zone as well and putting the base cluster at $76,200 to $76,660 back in play. A confirmed break beneath that cluster would expose $75,400 to $75,700, and below the August range the measured references are the 38.2% at $74,223.86, the 50% at $72,004.66 and the 61.8% at $69,785.46.
No confirmation: Four-hour closes between the two dynamic boundaries keep Bitcoin inside the developing structure. At the current candle those boundaries are approximately $77,235 and $78,025, but both move with every new candle. A close beyond one of them without clearing the surrounding support or resistance zone is an initial break rather than full confirmation.
What this tells us
A reclaimed level is not automatically established support. Bitcoin has produced four consecutive closes above the 23.6% retracement at $76,969.64, which strengthens the case for acceptance above it, and a successful retest from above would be cleaner evidence that the level is functioning as support.
The second point is about time rather than price. A converging structure progressively reduces the space available for price to stay between its boundaries, which increases the likelihood of a near-term break without implying its direction or its quality. And a break arriving in the same window as a scheduled release is a coincidence of timing, not a signal about which way it goes.
Does Bitcoin close out of the upper boundary and take on $78,650, or does the rising line fail and send it back to the base cluster?
Any opinions, news, research, analyses, prices or other information contained on this website is provided as general market commentary and does not constitute investment advice. ThinkMarkets will not accept liability for any loss or damage including, without limitation, to any loss of profit which may arise directly or indirectly from use of or reliance on such information. Gold reclaims the 38.2% at $4,415 — pause or reversal?Gold has recovered 157 points from the low it recorded at $4,282.51 yesterday and has closed back above the 38.2% retracement at $4,414.84, with the 50% at $4,327.82 holding on a closing basis throughout. This analysis argues that the reclaim is real but incomplete, because the sequence of lower highs from the record has not yet been broken.
Key topics covered
Yesterday's bullish condition was met: Our 2 September map required a four-hour close above $4,387 to open the $4,408 to $4,435 area. The 21:00 UTC candle closed at $4,395.62 and the following one at $4,437.36, and the market has traded above that area since.
Payrolls is the key remaining catalyst: ADP came in at 38,000 on Wednesday against a 47,000 forecast on the desk feed, with other surveys nearer 48,000. CME FedWatch had September hike pricing around the mid-60% area in the latest desk snapshot, and because that probability moves intraday the reading should be time-stamped at publication. Friday's non-farm payrolls at 8:30 New York time could materially reinforce or challenge that pricing, and the opportunity cost of holding non-yielding gold is sensitive to changes in rate expectations and yields.
The moving averages now bracket price: The 20 EMA at $4,410.65 and the 200 EMA at $4,364.32 sit below, the 100 EMA at $4,436.43 sits at price and the 50 EMA at $4,456.02 sits just above, inside the first resistance area. Price recorded levels on both sides of the 100 EMA during the session.
The setup
Momentum has turned from extreme to neutral rather than to strength: RSI recorded 19.6 on Wednesday morning and has since moved back above the oversold area to around 50. Checked by hand against the last two swing lows, the 1 September low at $4,314.41 with RSI at 20.3 and the 2 September low at $4,282.51 with RSI at 19.6, price and momentum both made lower lows, so there is no divergence.
Above price, the first zone runs $4,446 to $4,468, the 31 August ceiling with the 50 EMA inside it. The second runs $4,510 to $4,525, holding the 23.6% retracement at $4,522.51, where price structure is sparse because the 28 August decline passed through it in a single candle. The third runs $4,565 to $4,585, the lows of 27 and 28 August before that decline.
Below price, the first zone runs $4,396 to $4,420 and is the crowded one: the 31 August low at $4,396.39, the 20 EMA at $4,410.65 and the 38.2% retracement at $4,414.84 all sit inside it. Today's low at $4,387.37 briefly pierced beneath that zone before price recovered back above it. The second zone runs $4,282 to $4,330, yesterday's low with the 50% retracement at $4,327.82 and the bullish engulfing low at $4,330.66 at its upper edge. The third runs $4,230 to $4,255, with the 61.8% at $4,240.80 inside it.
An ascending reference boundary runs from the 29 July low at $3,995.97 through yesterday's low at $4,282.51, rising about 12 points per trading day and worth $4,298 now. Two points on it: yesterday's low is its second anchor, so the bounce from it is not an independent test, and the 3 August low sits 12 points beneath the line, a minor overshoot rather than a break. There is no channel, no range, no flag, pennant, triangle, double bottom or head and shoulders on this timeframe.
The candle that opened at 13:00 UTC yesterday, the one that recorded the $4,330.66 low, produced a bullish engulfing that remains live unless price closes below that low.
Scenarios
Bullish — the first resistance area is cleared: A four-hour close above $4,468 would break the latest lower high and improve the short-term structure, putting the sparse ground toward $4,510 to $4,525 in play. A broader reversal of the move that began at $4,696.56 would still require confirmation above the higher resistance levels.
Bearish — the reclaim fails: A four-hour close back below $4,396 would weaken the reclaimed 38.2% structure and break the first support zone. The bullish engulfing low at $4,330.66 and the 50% retracement at $4,327.82, which now sit together, would be the next intermediate reference, and a close below them would invalidate that candle reading and expose the rest of the $4,282 to $4,330 zone.
No confirmation: Four-hour closes between the 38.2% retracement near $4,415 and $4,468 would keep the recovery in consolidation without confirming a bullish structure break. A close below the retracement but above $4,396 would weaken the reclaim without yet confirming a breakdown of the support zone.
What this tells us
Reclaiming a level and reversing a trend are different achievements. Price has taken back the 38.2% retracement, which is a real improvement on Wednesday, but the highs since 24 August still descend: $4,696.56, then $4,643.09, then $4,631.54, then $4,468. Clearing the last of those would improve the short-term structure; ending the whole move down from the record would take more than that.
This is also why a reclaimed level is worth watching from below rather than celebrating. The same $4,414.84 that acted as resistance yesterday is now the first thing a failed rebound would give back, and the distance between reclaiming it and losing it again is a single four-hour close.
Does gold clear $4,468 and break the sequence of lower highs, or does payrolls send it back beneath the 38.2%?
Any opinions, news, research, analyses, prices or other information contained on this website is provided as general market commentary and does not constitute investment advice. ThinkMarkets will not accept liability for any loss or damage including, without limitation, to any loss of profit which may arise directly or indirectly from use of or reliance on such information. EUR/USD: two descending lines and a 58 pip range EUR/USD has recovered from 1.15661 to 1.16001 and closes the session on the 20 and 100 EMAs, back inside the resistance cluster that has capped it since 31 August. This analysis argues that the range remains intact in both directions and that the descending structure above price is still defined by two anchors rather than confirmed by three.
Key topics covered
The dollar side is still driving: September hike pricing moved to around the mid-to-high 60% area after Warsh's Jackson Hole remarks, and the euro has been on the losing side of that repricing since the 21 August high at 1.17110. ADP was released this morning at 38,000, a soft print that has not changed the range. ISM services follows tomorrow and payrolls on Friday, so the next leg is data-dependent rather than rhetoric-dependent.
Two descending boundaries, both with two anchors: The primary line runs from the 21 August high at 1.17110 through the 28 August high at 1.16577, with no high above it since, and sits at 1.16268 today. A steeper one is defined by that 28 August high and today's high at 1.16079, which means today's touch is its second anchor rather than an independent rejection. A later third interaction is what would give either line technical weight.
A 58 pip range since 31 August: The market has been contained between 1.15661 and 1.16241, and the 200 EMA at 1.15657 sits directly beneath the floor of it, which is why the last three sessions have found buyers in the same twelve pip band.
The setup
Above price, the first zone runs 1.1600 to 1.1616 and is the crowded one: the 20 EMA at 1.16000, the 100 EMA at 1.16016, the 50 EMA at 1.16155 and the steeper boundary at 1.16079 all sit inside it, with the 50% retracement at 1.16113 among them. The second runs 1.1618 to 1.1636, holding the 1 September high, the 31 August high and the primary boundary at 1.16268. The third runs 1.1642 to 1.1652, the bases of 25 and 26 August.
Below price, the first zone runs 1.1566 to 1.1578, built by the 30 August low and the three lows of today, with the 200 EMA at 1.15657 immediately under it. The second is 1.1530 to 1.1535, the 11 August low. The third is 1.1511 to 1.1516, the 13 August and 6 August lows that started the advance.
Fibonacci on that advance, 1.15115 to 1.17110, puts the 38.2% at 1.16348 and the 50% at 1.16113 in the second and first resistance zones respectively, the 61.8% at 1.15877 between price and the support cluster, and the 78.6% at 1.15542 between the first and second support zones. RSI is 47.1, recovered from 31.5 yesterday, with no divergence in the data. No flag, pennant, triangle, wedge, double top or head and shoulders is present on this timeframe, and there is no channel: the two boundaries are not parallel, the steeper one is closing on the primary.
Scenarios
Bullish — an initial reclaim, then the real test: A four-hour close above 1.1616 would reclaim the first resistance cluster and clear the steeper reference boundary along with the nearby EMA and Fibonacci confluence. It would still leave the pair inside the broader range: the 1.16241 range high, the primary boundary near 1.16268 and the 38.2% retracement near 1.16348 are the next tests, and a close above 1.1636 would be the stronger confirmation of an upside break. The structure voids on a close below 1.15661.
Bearish — the range floor goes: A four-hour close below 1.15661 would break the range floor, and a close below the 200 EMA at 1.15657 just beneath it would add a second confirmation. That leaves the 78.6% retracement near 1.15542 as the next measured reference and 1.1530 to 1.1535 as the next established support zone.
No confirmation: Four-hour closes between 1.15661 and 1.1616 leave the pair without directional confirmation. Moves above 1.1600 are a rebound into the resistance cluster rather than a confirmed break, while the range high and the primary boundary remain intact.
What this tells us
A line is only as good as the swings it rests on, and it is worth checking what a line is actually made of before treating it as resistance. The steeper boundary here is defined by the 28 August high and today's high, so today's touch is its second anchor, not a rejection from established resistance. A third interaction later is what would turn it into evidence.
The second lesson is what separates a reclaim from a breakout. The two boundaries are 19 pips apart at today's reference point, and because they are not parallel that gap narrows over time. Clearing the nearer one puts price back inside a cluster; clearing the range high and the line above it is what would change the structure, and a close carries more weight than a wick in both cases.
Does EUR/USD reclaim 1.1616 and take on the range high and the primary boundary above it, or does the range hold until Friday's payrolls decide it?
Any opinions, news, research, analyses, prices or other information contained on this website is provided as general market commentary and does not constitute investment advice. ThinkMarkets will not accept liability for any loss or damage including, without limitation, to any loss of profit which may arise directly or indirectly from use of or reliance on such information.
Bitcoin loses $77,000 - two deep tests, no close below Bitcoin has closed below the 23.6% retracement at $77,000 and trades at $76,571, after two deep tests of the base cluster in two days that produced no close beneath it. This analysis argues that the distinction between a test and a close is what decides whether the August range survives.
Key topics covered
The pennant resolved lower, as flagged: Yesterday's map put the lower boundary near $77,500 and said losing it would exit the pattern before price even reached the base cluster. The 16:00 candle on 1 September closed at $77,256, below the boundary, and the market has traded lower since.
The 23.6% level has flipped: The 23.6% retracement of the $62,631 to $81,438 advance sits at $77,000. It supported the market through late August and now caps it, with today's high at $76,996 stopping four points beneath it.
Two deep tests, no close below the cluster: The base cluster runs $76,200 to $76,660. Price reached $76,364 on 1 September and $76,204 today, four points above the lower edge, and closed back inside or above the cluster both times. Momentum agrees with price rather than diverging: RSI is 33.6, its lowest of the last thirty candles, with no divergence in the data.
The setup
Above price, the first zone runs $76,900 to $77,500 and now contains the 23.6% level. The second runs $77,600 to $77,940, the highs of 1 September and the 26 August low. The third runs $78,400 to $78,900, where the market based before the pennant broke.
Below price, the first zone is $76,200 to $76,660, near-term support built on 24 August and deeply tested twice this week. The second is $75,400 to $75,700, the 23 August low that anchors the entire August range and is the range floor proper.
Beneath that, price structure is sparse. The 17 to 21 August advance was vertical, so between $75,577 and roughly $68,900 there is no prior consolidation and no repeated touch. What remains are measured references from the same wave: the 38.2% at $74,254, the 50% at $72,035 and the 61.8% at $69,815.
Scenarios
Bullish — the cluster holds and the 23.6% is reclaimed: A four-hour close back above $77,500 puts $77,600 to $77,940 in play and would support a failed-selloff reading of this week's tests. The structure voids on a close below $76,200.
Bearish — a close below the cluster: A four-hour close beneath $76,200 would confirm a breakdown of the base cluster after two prior deep tests, exposing $75,400 to $75,700. Below that, the 38.2% near $74,254 becomes the next measured reference, followed by the 50% near $72,035 and the 61.8% near $69,815 if the decline extends.
No confirmation: Four-hour closes between $76,200 and $76,900 would leave the market without directional confirmation. Closes within $76,200 to $76,660 keep price inside the base cluster, while closes above $76,660 but below $76,900 are a rebound without a reclaim of resistance.
What this tells us
A level is not lost when it is touched, it is lost when the market agrees to stay beneath it. The wick is the argument, the close is the vote. Bitcoin has now spent two sessions reaching deep into the base cluster and closing back out of its lower half, which tells you sellers can reach the level but cannot yet hold price there.
That distinction is what separates a shakeout from a breakdown, and it is why an intraday break of a well-defined zone is worth watching rather than acting on. The same discipline applies in reverse on the way up.
Does the base cluster hold as it has twice this week, or does a close beneath $76,200 open the sparse ground under the August range?
Risk warning:
Any opinions, news, research, analyses, prices or other information contained on this website is provided as general market commentary and does not constitute investment advice. ThinkMarkets will not accept liability for any loss or damage including, without limitation, to any loss of profit which may arise directly or indirectly from use of or reliance on such information.
Gold holds above the 50% at $4,319 — floor or pause?Gold has fallen 414 points from the record at $4,696 and has recorded a low at $4,282.51, below the 50% retracement of the advance from $3,942, before recovering to $4,339. This analysis argues that the reclaim of that retracement, not the size of the decline, is what the next two days turn on.
Key topics covered
- The repricing has advanced materially, but its next leg remains data-dependent: CME FedWatch pricing for a September hike is around the mid-to-high 60% area following Warsh's Jackson Hole remarks. ADP was released this morning at 38,000 against a 47,000 forecast, a soft print that has not yet changed the rates picture, and payrolls follow on Friday.
- Yesterday's levels both gave way: Our 1 September map put the decision at $4,357, with $4,310 to $4,325 beneath it. Price closed below $4,357 within four hours, then traded through the second zone entirely and recorded $4,282.51 before buyers appeared.
- The 50% retracement and the 200 EMA frame the move: Measured from $3,942 to $4,696.56, the 50% sits at $4,319 and price has recorded levels on both sides of it today. The four-hour 200 EMA at around $4,362 sits above, inside the first resistance area, and price has been below it since early August.
The setup
On the four-hour timeframe, near-term momentum remains under pressure while price is below the $4,352 to $4,387 area. The current rebound is a potential stabilisation attempt until price confirms otherwise, and the decline itself is a pullback on this timeframe rather than a correction, which is a description that belongs to the daily chart.
Above price, the first zone runs $4,352 to $4,387, yesterday's failed shelf, and it holds the 200 EMA near $4,362. The second runs $4,408 to $4,435, where the 38.2% retracement at $4,408 meets the base of 31 August. The third runs $4,446 to $4,468, where the 100 and 50 EMAs are converging.
Below price, the first area runs $4,282 to $4,319 and is a support and resistance zone rather than plain support: price has recorded levels on both sides of it today and currently sits above it. Beneath that, $4,223 to $4,240 around the 6 August low, with the 61.8% retracement at $4,230 inside it. If that structure fails, the 78.6% at $4,104 sits just under the $4,100 to $4,125 late-July area.
The candle that recorded the $4,282.51 low produced a potential bullish hammer, a roughly $25 lower wick against a $9 body, formed between the 50% and the 61.8% rather than on either. Its location after a sharp decline, alongside an RSI that reached 19.6 and has since moved back above the oversold area, strengthens the relevance of the reaction, but the candle alone does not confirm a reversal. There is no divergence in the supplied data.
No trendline, channel, range, flag, pennant, triangle, double bottom or head and shoulders is present on this timeframe: the decline has been a straight sequence of lower highs and lower lows since 24 August, with no consolidation long enough to define one.
Scenarios
- Bullish — the 50% holds and resistance is reclaimed: Holding above $4,319 keeps the rebound alive, but stronger confirmation would require a four-hour close above $4,387, which would clear the failed shelf and the 200 EMA together and open $4,408 to $4,435, with the 38.2% inside it. The hammer interpretation is invalidated by a four-hour close below $4,282.51, which is a separate event from a confirmed loss of the 50% at $4,319.
- Bearish — the 50% is lost again: A four-hour close below $4,282.51 would end the hammer reading and leave $4,223 to $4,240 as the next zone, with the 61.8% at $4,230 inside it. Below that the 78.6% near $4,104 becomes the next measured reference.
- No confirmation: Four-hour closes between $4,282.51 and $4,352 indicate consolidation rather than a resolved direction, with the market inside the gap between the 50% retracement and the first resistance area.
What this tells us
A retracement level is only as good as the swing it is measured from. Move the origin of that swing by a few hundred points and every level moves with it, which turns a level that looked like the floor of the move into one that was never in play. Before a Fibonacci grid means anything, the low and the high it is drawn between have to be the actual start and end of the move on a timeframe above the one being traded.
That is also why confluence is worth more than any single ratio. The reaction here happened between two levels rather than on one, which is a weaker technical argument than the wick alone suggests, and it is the reclaim of $4,319 and then $4,387 that would turn a pause into a floor.
Does gold hold above the 50% at $4,319 and reclaim resistance, or does payrolls week take it down to the 61.8% at $4,230?
Any opinions, news, research, analyses, prices or other information contained on this website is provided as general market commentary and does not constitute investment advice. ThinkMarkets will not accept liability for any loss or damage including, without limitation, to any loss of profit which may arise directly or indirectly from use of or reliance on such information. Bitcoin: range narrows into payrolls — is $77,000 the floor?Bitcoin has spent nine days locked between $75,577 and $81,438 after a 23% vertical repricing in mid-August, and the swing inside that range has now compressed to 1,631 points with price at $77,730. This analysis argues that the 23.6% retracement at $77,000, sitting inside the range floor, is where the August move is either confirmed as a base or exposed as an overshoot.
Key topics covered
- The rate repricing is a crypto story too: After Warsh's Jackson Hole remarks, CME FedWatch pricing for a September hike moved from roughly 36% to about 65%, and the two-year yield jumped more than twelve basis points. Bitcoin is a liquidity asset before it is anything else, so a market pricing tighter policy is removing the fuel that drove the August advance.
- Compression, not direction, since 28 August: Three failed pushes above $80,000 with only three closes above it, four separate bases between $76,656 and $76,999, and a swing that has shrunk from 4,580 points to 1,631.
- $77,000 carries two arguments at once: The 23.6% retracement of the $62,631 to $81,438 advance lands at $76,999, exactly where the range floor cluster sits. It is the last shelf before the market has to revisit the vertical candle that created this level.
The setup
Our 22 August map flagged $79,460 as the ceiling with three touches. It broke on 25 August and the market ran to $81,438, so the level did its job and then flipped. Price has failed there four times since 30 August.
Above price: $78,900 to $79,470, then $80,200 to $80,820 where three pushes stalled, then $81,250 to $81,440. Below: $77,365 to $77,670, then $76,650 to $77,000 which holds four lows and the 23.6% level, then $75,400 to $75,700, the 23 August low that anchors the range.
Inside it, a pennant has formed since 28 August. The upper boundary falls through the 30 August high at $79,376, the 31 August high at $79,231 and today's high at $79,180, three touches sloping about 22 points down per four-hour candle, and sits at $79,135. The lower boundary rises through the 30 August low at $76,999 and today's low at $77,504, two anchors, so it is a reference boundary. At this rate they converge within about two days, putting the apex on Friday's payrolls.
RSI on the four-hour is 43.3, mid-range, with no divergence either way.
Scenarios
- Bullish — pennant break and a retest of the top: The upper boundary gives way before the $79,470 zone does. A four-hour close above $79,470 reclaims the old ceiling and puts $80,200 to $80,820 in play. The structure voids below $76,650.
- Bearish — the floor and the retracement go together: Losing $77,504 exits the pennant before price reaches the base cluster. A close below $76,650 then removes that cluster and the 23.6% level in one move, leaving $75,400 to $75,700, and beneath it the 38.2% at $74,254.
- No confirmation: Closes between $77,504 and $79,135 through ISM, JOLTS, ADP and Friday's payrolls mean the pennant is still compressing.
What this tells us
A vertical move creates levels that have never been tested. August took price from $62,600 to $81,400 in four days, so everything between those numbers is empty of history: no prior consolidation, no repeated touches, nothing to lean on except retracement mathematics. And when a pattern narrows towards an apex that lands on a scheduled event, the chart is not predicting the event. It is telling you the market has run out of room to keep waiting for it.
Does $77,000 hold and confirm the August range as a base, or does payrolls week send Bitcoin back into the vacuum below it?
Any opinions, news, research, analyses, prices or other information contained on this website is provided as general market commentary and does not constitute investment advice. ThinkMarkets will not accept liability for any loss or damage including, without limitation, to any loss of profit which may arise directly or indirectly from use of or reliance on such information. Gold at the 50% retracement — why 4,358 matters more than FridayGold has fallen 332 points from the record at $4,696 and is now sitting on the 50% retracement of the entire August advance at $4,358, with today's low at $4,364 stopping six points above it. This analysis argues that the level being tested today, not Friday's headline drop, is what decides whether August was a trend or an episode.
Key topics covered
- The repricing, not the speech: Ahead of Jackson Hole the market gave a September hike roughly a 36% chance. After Warsh said the Fed has more work to do if inflation does not move back toward 2%, that jumped to around 65%, and the two-year yield rose more than twelve basis points to about 4.354%. Barclays now looks for two hikes this year. Nothing has actually changed at the Fed; the price of the expectation has.
- The geopolitical bid is not being paid: US and Iran strikes lifted crude above $90, which would normally support gold twice over, through haven demand and through inflation. Instead the metal is at a two-week low. When the front end of the curve moves that fast, it overwhelms every other input in the metal.
- Four levels have collapsed into one band: The 50% Fib of the $4,019 to $4,696 advance sits at $4,358, the 100-day SMA is around $4,370, today's low is $4,364, and the first close below Monday's $4,396 pivot came at $4,371. Confluence this tight is rare, and it is where the argument now lives.
The setup
Monday's idea flagged $4,396 as the level that would decide the structure. It broke on the 05:00 candle, which closed at $4,370, and the market has since spent the session holding just above the retracement rather than accelerating through it. That distinction matters: a level that breaks and then fails to extend is behaving differently from one that breaks and runs.
Above price, the first zone is $4,415 to $4,435, the base of Monday's consolidation. The second is $4,446 to $4,465, where seven separate highs stacked up. The third is $4,480 to $4,487, Friday's post-crash ceiling. Below price, the first zone is $4,357 to $4,370, then $4,310 to $4,325, the base the whole August advance launched from, and $4,223 to $4,240 beneath that.
The 38.2% Fib at $4,438 has now flipped from support into resistance, and it sits inside the second zone. RSI on the four-hour reached 25.0 on the 05:00 candle, the lowest reading on this chart since June.
Scenarios
- Bullish — retracement holds into payrolls: A four-hour close back above $4,435 puts $4,446 to $4,465 in play and turns the last two sessions into a base rather than a staircase. The structure voids below $4,357.
- Bearish — loss of the 50% level: A close below $4,357 removes the last shelf before $4,310 to $4,325, and a loss of that band puts the entire August advance in question rather than just its final leg.
- No confirmation: Closes between $4,370 and $4,435 with ISM, JOLTS, ADP and Friday's payrolls still ahead mean the market is waiting, not deciding.
What this tells us
Markets do not trade events, they trade the distance between what was priced and what is now expected. No rate decision was taken on Friday, no data was released, and yet gold had its largest single-day fall since June, because the probability attached to a September hike almost doubled in one afternoon. The same logic works in reverse this Friday: a payrolls number can be weak in absolute terms and still lift the dollar if it is less weak than the market had assumed. When you map levels before an event, you are not forecasting the number. You are marking where the argument breaks if the crowd is wrong.
Does $4,358 hold as the floor of a correction, or does payrolls week turn August's 9.6% gain into a completed episode?
Any opinions, news, research, analyses, prices or other information contained on this website is provided as general market commentary and does not constitute investment advice. ThinkMarkets will not accept liability for any loss or damage including, without limitation, to any loss of profit which may arise directly or indirectly from use of or reliance on such information. XAUUSD: channel broken, price back at the launch pointGold has lost around 300 points since Monday's record high. From the record at 4,696 on Monday morning to today's low at 4,396, it now trades at 4,441.
More than 70% of the decline occurred in a single four-hour candle. The four-hour bar that opened at 13:00 GMT on Friday started at 4,601 and closed at 4,479 after trading down to 4,464, on the heaviest volume since the start of July. The four-hour bar contained Warsh's speech.
What happened
Kevin Warsh's first Jackson Hole keynote was hawkish. He put the fight against inflation and the restoration of price stability firmly back in focus and reaffirmed the commitment to the 2% target. He said that this summer's better-than-expected inflation readings do not tell him that underlying trends have meaningfully improved, and hinted that rates could need to move higher without more progress. He also refused to commit to forward guidance, saying market participants should not be looking primarily to the Fed for their next trade.
The dollar and Treasury yields rose, putting pressure on assets such as gold, the euro, bitcoin and parts of the equity market. The two-year yield, the most sensitive to policy expectations, rose more than six basis points to around 4.3%.
For gold, the mechanism is direct. A higher real yield means a higher cost of holding an asset that pays nothing.
The technical picture
The current four-hour candle opened at 4,435.73 and has moved between 4,433.84 and 4,448.26, with price at 4,441.33, up 5.64 points.
Three zones sit above. The first runs from 4,448 to 4,487 and is the ceiling of everything since the collapse: the 20 August low at 4,451 that has flipped into resistance, Friday's second high at 4,487, and today's four highs between 4,448 and 4,472. The second runs from 4,565 to 4,585, the Thursday and Friday lows from before the drop. The third runs from 4,605 to 4,632, the last consolidation and the high of the collapse candle itself.
Three zones sit below. The first runs from 4,396 to 4,420, today's low and the lowest print since 19 August. The second runs from 4,310 to 4,325, the 14 and 19 August lows, the base the whole advance started from. The third runs from 4,215 to 4,235, the 6 August low.
The broken rising channel
The channel that governed the whole of August is finished. Its lower rail joined the 3 August low at 4,019 to the 19 August low at 4,325 and rose by roughly 25–27 points per trading session. The first close beneath it came in Friday's candle at 4,479, with the rail at 4,524.
That rail is at 4,586 today, which leaves price about 145 points underneath it. The support has become a distant ceiling, and the rising structure we have been tracking since 3 August no longer stands.
Back at the launch point
The most important thing on the chart today is that price has returned to the area where the breakout began. The range gold traded between 11 and 19 August ran from 4,311 to 4,450, and its break on 19 August is what launched the move to the record. Price is now at 4,441, inside the ceiling of that same range.
In other words, the metal has given back the entire breakout and come back to test the launch point from above.
Fibonacci
Measured from the 3 August low at 4,019 to the record at 4,696, a range of roughly 678 points, the 38.2% retracement sits at 4,438, which is exactly where price is. Above it, 23.6% is at 4,537. Below, 50% is at 4,358, 61.8% at 4,278 and 78.6% at 4,164.
So price is standing on a double confluence: the ceiling of the broken range at 4,450 and the 38.2% retracement at 4,438. That narrow band is what the coming sessions turn on.
Scenarios
Bullish: a four-hour close above 4,487 takes price out of the first resistance zone and puts 4,565 to 4,585 back in play.
Bearish: a close below 4,396 gives up the confluence of the range ceiling and the 38.2% retracement, leaving the way open towards 4,310 to 4,325, the base of that same range, with the 50% level at 4,358 on the way.
Are you watching whether 4,438 holds, or a break of 4,396? Share your thoughts in the comments.
Any opinions, news, research, analyses, prices or other information contained on this website is provided as general market commentary and does not constitute investment advice. ThinkMarkets will not accept liability for any loss or damage including, without limitation, to any loss of profit which may arise directly or indirectly from use of or reliance on such information. XAUUSD: three days of lower highs into the Warsh speechGold has slipped from its record at 4,693 and has been building a run of lower highs for three sessions, trading at 4,604 hours before Fed Chair Kevin Warsh delivers his first keynote at Jackson Hole. We map the active zones above and below price and both rails of the rising channel.
Gold is trading at 4,604 in almost complete stillness, hours before the most important speech of the week. The metal is about 90 points below the record 4,693 it printed on Tuesday morning, and it has been building a run of lower highs ever since: 4,673, then 4,650, then 4,643, then 4,619.
The question today is simple. Is this a pause inside the advance, or the start of something deeper? The chart gives clear limits for both.
What the market is watching today
Federal Reserve Chair Kevin Warsh speaks at 10 a.m. ET, 14:00 GMT, in his first major address as chairman, with markets looking for clarity on the Fed's rate strategy after his stance at the last meeting created confusion.
Three Fed officials have already sounded the alarm about sticky inflation while the new chief has resisted providing forward guidance, and futures imply around a 35% chance of a hike at the 16 September meeting, with a move fully priced by December.
That is what matters for gold. Its primary lever is the real yield, so any hint of tightening for longer raises the cost of holding an asset that pays nothing, and any hint of flexibility does the opposite.
The technical picture
The current four hour candle opened at 4,602.88 and has moved between 4,602.08 and 4,604.39, with price at 4,603.69, up 0.64 points. That is an unusually tight range, and it says the market is waiting.
Three zones sit above. The first runs from 4,613 to 4,645, the ceiling of the last two sessions, where price has been turned away five times since Wednesday morning. The second runs from 4,648 to 4,675, the highs of Tuesday and Wednesday. The third runs from 4,685 to 4,695 and holds the record at 4,693.
Three zones sit below. The first runs from 4,567 to 4,590, the lows of the last twenty four hours with the extreme at 4,567, tested five times. The second runs from 4,505 to 4,535, where the market based four times on 20 and 21 August. The third runs from 4,430 to 4,455, the 11, 13 and 18 August highs that broke to the upside. Further zones were left out, the nearest being the 19 August low at 4,327.
Two broken ranges
The advance was built on two consecutive range breaks, and both met their measured objectives in full.
The first ran from 23 July to 4 August between 4,000 and 4,120, a height of 120 points. It broke to the upside on 5 August and the measured objective at 4,240 was met the following day.
The second ran from 11 to 19 August between 4,314 and 4,452, a height of 138 points, a continuation range after the early August surge. It broke on 19 August and the measured objective at 4,590 was met on 21 August.
Which means the structure has no remaining measured objective from the ranges. What governs price now is the channel, the flag and the horizontal zones.
The falling flag
The shape that has formed since the record is a falling flag: a small down-sloping channel inside a wider uptrend. Its upper rail joins Tuesday's high at 4,693 to Thursday's high at 4,643, and the lower rail runs parallel about 70 points beneath, touched by Tuesday's low at 4,608 and Thursday's low at 4,567. Today they sit near 4,611 and 4,541.
The pole that preceded the flag runs from the 19 August low at 4,327 to the record, 366 points, which is the figure the measured move technique projects from a break point if one occurs. The shape is invalidated on a break of its lower rail.
The rising channel
Gold is still inside the rising channel that has held since 3 August. Its lower rail joins the 3 August low at 4,021 to the 19 August low at 4,327, with four more touches inside seven points, and the upper rail runs parallel 267 points above, touched by the 11 August high and then by the record. The channel climbs about 27 points a session, which puts the rails at 4,517 and 4,784 today.
So the falling flag is moving entirely within the upper half of the rising channel, and that double structure is what frames price today.
Fibonacci levels
Measured from the 3 August low at 4,021 to the record at 4,693, a range of 672 points, the 23.6% retracement sits at 4,534, on the upper edge of the second support zone, and the 38.2% sits at 4,436, inside the third. Below those, 50% is 4,357 and 61.8% is 4,278.
The two confluences are what matter: horizontal support and Fibonacci agree at 4,534, and again at 4,436.
The live candlestick pattern
The four hour candle that closed at 6 p.m. GMT yesterday formed a bullish engulfing: it opened at 4,586.87 and closed at 4,615.15, engulfing the body of the down candle before it, and it formed on the lower edge of the first support zone. It stays live unless price closes below 4,567.42.
Technical summary
Price is boxed in by three levels sitting almost on top of each other: the upper rail of the flag at 4,611, the lower edge of the first resistance zone at 4,613, and the first support zone between 4,567 and 4,590 carrying a live bullish engulfing. A squeeze like this before a major event is familiar, and the side it resolves to is usually decided in the first hour after the speech.
Scenarios
Bullish : a four hour close above 4,645 breaks the run of lower highs and exits the flag in the same move, putting 4,648 to 4,675 back in play and then the record zone.
Bearish : a close below 4,567 invalidates the engulfing and breaks the lower rail of the flag at the same time, opening the way to 4,505 to 4,535 where horizontal support meets the 23.6% retracement, with the lower channel rail at 4,517 rising 27 points a session, so the two converge.
Are you watching the 4,645 break, or the flag base at 4,541? Share your thoughts in the comments.
Any opinions, news, research, analyses, prices or other information contained on this website is provided as general market commentary and does not constitute investment advice. ThinkMarkets will not accept liability for any loss or damage including, without limitation, to any loss of profit which may arise directly or indirectly from use of or reliance on such information. Gold at 200MA as double bottom neckline! Breakout or rejection?Gold pushed to $4,670 as the dollar flipped lower after a three-day advance on optimism around US-Iran negotiations and the pause of "Project Freedom". This video maps the double bottom at $4,500, the 200 MA neckline, and the measured move that opens the door to $4,820 and the 5K handle.
Key topics covered
- Dollar reversal on Iran de-escalation : The DXY flipped lower on Wednesday after a three-day advance as Rubio confirmed offensive operations have ended and Trump paused Project Freedom to allow time for renewed talks with Tehran.
- ADP and NFP catalysts : Markets turn to ADP private payrolls today and NFP on Friday, the data that likely decides how the price action around the 200 MA resolves.
- Double bottom at $4,500 with bullish RSI divergence: Two defended lows at the 50% Fib flip point, with RSI on the 4-hour at 62, above the 50 line and showing bullish divergence with room to run before overbought.
Scenarios & trade plan
Bullish — neckline breakout: A daily close above the 200 MA on the 4-hour chart confirms the double bottom, opening the door to $4,700 first, then $4,820 from the measured move, and $4,890 ahead of the 5K handle. Invalidation below $4,500.
Bearish — third rejection: A failure at the 200 MA and a loss of $4,590 reasserts the move toward $4,500. A break with conviction opens the golden pocket at $4,400, while another bounce there could form a triple bottom and reset the structure.
Does the third test of the 200 MA finally break the neckline and run to $4,820, or does the dollar find a floor and send gold back to the golden pocket?
This content is not directed to residents of the EU or UK. Any opinions, news, research, analyses, prices or other information contained on this website is provided as general market commentary and does not constitute investment advice. ThinkMarkets will not accept liability for any loss or damage including, without limitation, to any loss of profit which may arise directly or indirectly from use of or reliance on such information.  Long
Long

Bitcoin stuck at fresh 2026 highs above $80K — Is bottom in?Bitcoin pushed above $80,500 to fresh 2026 highs while the Dow fell 557 points on UAE-Iran missile escalation, with $2.44B in April ETF inflows fuelling the divergence. This video maps the wave 3 flip level, the 200 SMA test, and the leading diagonal that could open the door to 100K and beyond.
Key topics covered
- Bitcoin-equity decoupling : Risk-off across stocks on UAE missile interception and oil at $114, but Bitcoin is holding gains on $2.44B April ETF inflows, the strongest month since October.
- $80,500 wave 3 flip : The bottom of wave 3 from the October decline, with the 200 SMA at $83,500 and the 38.2% Fib at $85,400 as the next confluences before the 50% Fib at $93,200 flips sentiment.
- Leading diagonal setup : The recovery off $60,100 might be a leading diagonal, with extended wave 3 targets at the 161.8% Fib at $96,000 and the 261.8% Fib at $105,900 if the bottom is in.
Scenarios & trade plan
Bullish — wave 3 extension : A daily close above $80,500 for three consecutive days confirms the breakout, opening a setup towards $85,400, $93,200 and beyond. Invalidation tiers at $78,000, $75,000 and $73,000, with the channel base at $70K as structural support.
Bearish — corrective unwind : A rejection at $80,500 and a loss of $76K, then $73,800, opens the door towards $70K, which reasserts the corrective interpretation, and the move can extend.
Is the wave 3 flip the start of a leading diagonal towards 100K, or does $80,500 hold as resistance and send Bitcoin back to $70,000?
This content is not directed to residents of the EU or UK. Any opinions, news, research, analyses, prices or other information contained on this website is provided as general market commentary and does not constitute investment advice. ThinkMarkets will not accept liability for any loss or damage including, without limitation, to any loss of profit which may arise directly or indirectly from use of or reliance on such information.  Long
Long
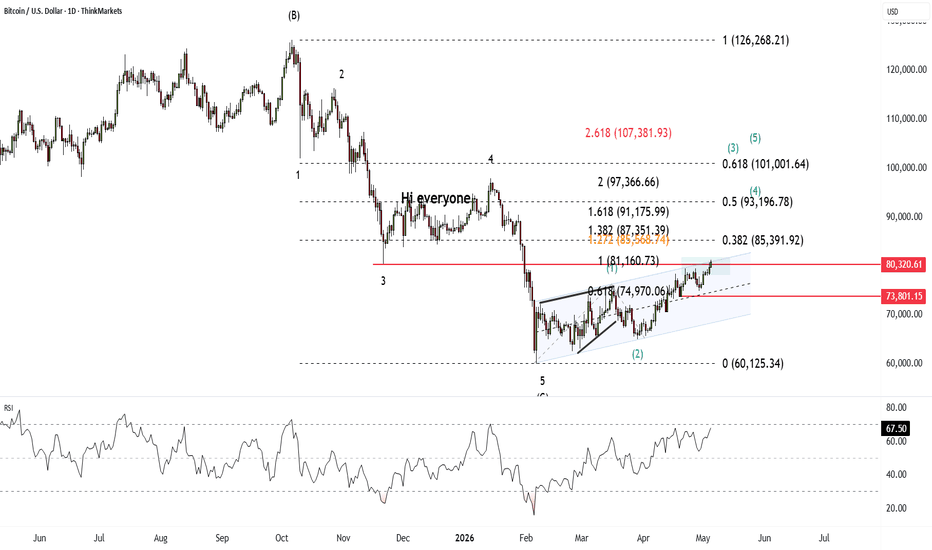
Nasdaq triple divergence! Resolve or extension to 28K?Nasdaq hit a record high at 27,500, then reversed completely on a hawkish FOMC, with mixed Big Tech earnings after hours setting up a critical open today. This video maps the rare triple divergence on the chart, the split earnings reactions, and the levels that decide whether 28K is next or 26,250 comes back into play.
Key topics covered
- Hawkish FOMC reset : The Fed held rates with an 8-4 split, the most dissents since 1992, with CME FedWatch now pricing no chance of a December cut and ~20% chance of a January 2027 hike.
- Split earnings reactions : Alphabet and Amazon delivered, but Microsoft and Meta sold off after hours on rising capex, with Wall Street rewarding AI revenue and punishing rising capex.
- Triple divergence at 27,500 : Price completed an impulsive wave with a rare triple divergence on RSI, with momentum resetting at the 50 line, the same level where a directional decision is forced.
Scenarios & trade plan
Bullish — extended wave continuation: If the open absorbs the mixed earnings and price breaks 27,500 with momentum, an extended wave opens toward 28K, then 28,900 based on the Fibo expansion. This setup gets invalidated on a daily close below 27K.
Bearish — divergence resolves : If Microsoft and Meta weakness drags the open lower and 27,500 holds as the top, 26,250 comes into play, the prior record peak that aligns with the 23.6% Fib. Below that, the 38.2% Fib and the 61.8% Fib open up, but the close needs to confirm.
Does today's open extend the 20% one-month rally, or does the triple divergence finally do its job?
This content is not directed to residents of the EU or UK. Any opinions, news, research, analyses, prices or other information contained on this website is provided as general market commentary and does not constitute investment advice. ThinkMarkets will not accept liability for any loss or damage including, without limitation, to any loss of profit which may arise directly or indirectly from use of or reliance on such information.  Short
Short

GBP/USD in broadening pattern ahead of BOE vote count!GBP/USD has pulled back from a double top at 1.3600 to 1.3447, forming a broadening pattern after a 5-wave impulse from 1.3158. Tomorrow's BOE decision, alongside today's FOMC, are the catalysts that decide whether this is a base or the start of a deeper correction.
Key topics covered
- BOE vote count: The BOE is expected to hold, but the split between hawks, doves, and those voting to cut will determine how markets price the rate outlook. A hawkish skew could support sterling, while a dovish one could price out the expected pre-December hike.
- Broadening pattern : Price has corrected from 1.3600 into a broadening structure, with a false breakdown at 1.3430 holding twice, suggesting a potential base, but the pattern can continue to expand before resolving.
- 23.6% Fib cluster at 1.3500 : Price is testing this level from below after the false break, with RSI mid-range and room in either direction, making the BOE outcome the trigger.
Scenarios & trade plan
Bullish — hawkish BOE : If 2-3 MPC members vote for a hike, the false breakdown at 1.3430 could hold and a bullish opportunity might open towards 1.3550 and the 1.3600 double top. A break above 1.3600 could open the door to a double top breakout setup.
Bearish — dovish BOE : If no hawks emerge and cuts are on the table, the broadening pattern could extend lower towards the 38.2% Fib at 1.3430, then the 50% Fib at 1.3380 and 61.8% Fib at 1.3330.
Is the false breakdown at 1.3430 the base that launches a retest of 1.3600, or does a dovish BOE open the door to a deeper Fibonacci correction?
This content is not directed to residents of the EU or UK. Any opinions, news, research, analyses, prices or other information contained on this website is provided as general market commentary and does not constitute investment advice. ThinkMarkets will not accept liability for any loss or damage including, without limitation, to any loss of profit which may arise directly or indirectly from use of or reliance on such information.
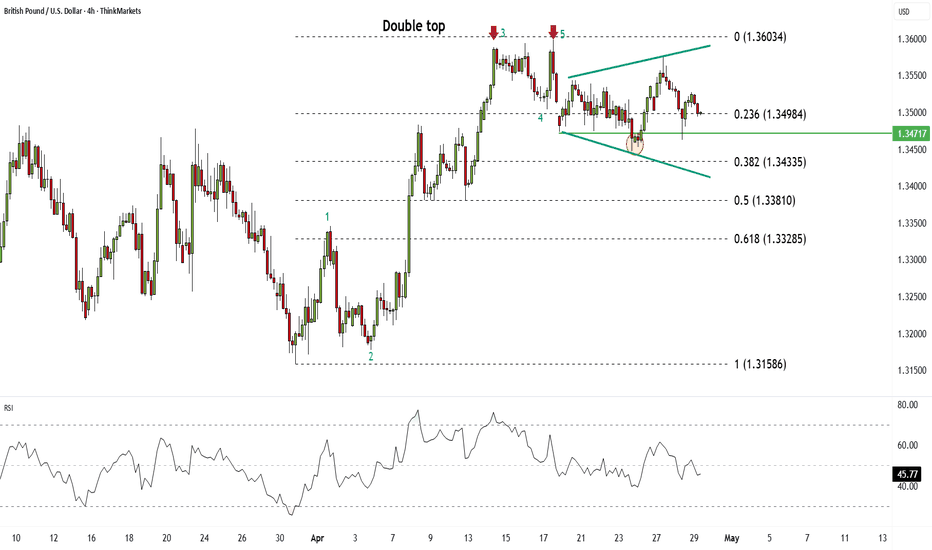
 Short
Short
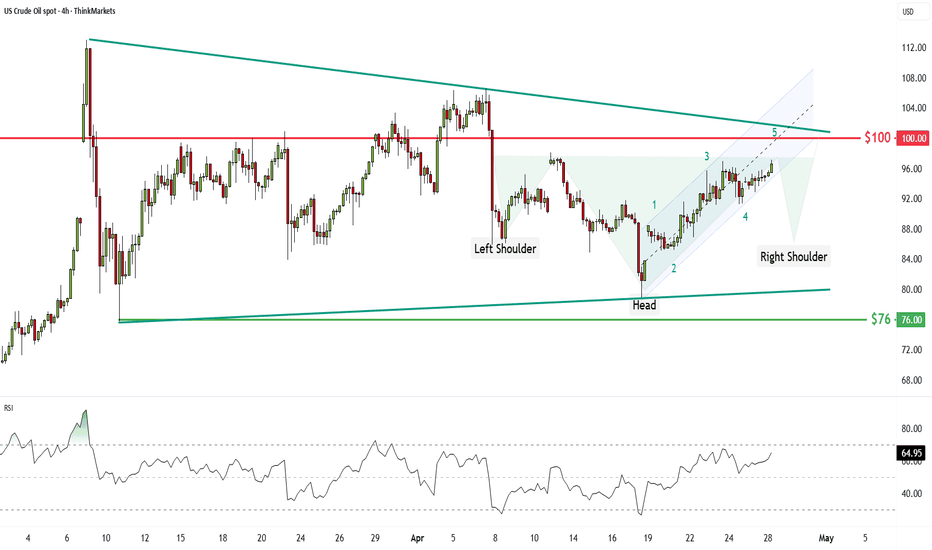
EUR/USD drops to 1.1670 — wave 4 base or start of bigger unwind?EUR/USD pulled back from 1.1850 to the 38.2% Fib at 1.1670, triggered by Iran's parliament speaker Ghalibaf resigning, dollar strength on oil at $103, and some of Eurozone PMIs sliding into contraction. This video maps the two structural scenarios and why 1.1640 is the line that decides both.
Key topics covered
- Geopolitical dollar bid : Ghalibaf's resignation, Israel's defence minister warning of resumed operations, and Trump's Navy order pushed oil to $103 and lifted the dollar.
- Eurozone PMIs : The EZ composite fell to 48.6 and services to 47.4, with France at 47.6 but price passthrough contained. The ECB is still expected to hold at 2% for a 7th consecutive meeting on April 30.
- 38.2% Fib cluster at 1.1670 : The pullback lands where a wave 4 correction should, with the 100% Fib extension and 38.2% Fib confluencing in this zone. The move to 1.1850 extending beyond the 161.8% Fib supports the impulsive structure.
Scenarios & trade plan
Bullish — wave 5 continuation : If 1.1670 holds, a bullish setup opens towards 1.1850, then the wave 5 target at 1.1940. Stop below 1.1640, with the room to the target making this a well-structured sccenario.
Bearish — corrective ABC unwind : If 1.1640 gives way on a daily close, the entire rally from 1.1410 becomes an ABC correction. Watch 1.1550 as the next support, as it could be wave 1, with 1.1410 back in play below that.
Is 1.1670 the wave 4 floor that launches the next leg to 1.1940, or does the dollar stay in control and unwind the whole move?
This content is not directed to residents of the EU or UK. Any opinions, news, research, analyses, prices or other information contained on this website is provided as general market commentary and does not constitute investment advice. ThinkMarkets will not accept liability for any loss or damage including, without limitation, to any loss of profit which may arise directly or indirectly from use of or reliance on such information. Bitcoin up 2% but is the $80,500 double top the real test?Bitcoin has recovered from a low of $60,125 to retest $74,500 as support, fuelled by ceasefire news that flipped risk sentiment and triggered $228 million in ETF inflows in a single session.
This video maps the two structural scenarios in play and the key levels that decide which one wins.
Key topics covered
- Ceasefire catalyst : The Middle East ceasefire flipped risk sentiment, squeezed short positions and drove the best monthly ETF inflow total since October at $1.86B.
- Corrective vs impulsive recovery : The move off $60,125 has looked corrective in structure, leaving open whether the bottom is in or a continuation lower follows.
- $80,500 double top : Price is forming a potential double top at resistance, with the 38.2% Fibo retracement and a Fibo extension confluence at $85,390 as the next resistance above it.
Scenarios & trade plan
Bullish — continuation : If $74,500 holds and price closes above $80,500, a bullish setup opens toward the $85,390 confluence zone. A break and hold there brings the 50% Fib at $93,200 into view, the level where sentiment fully flips.
Bearish — false break : If $80,500 proves to be a double top and the price loses $74,500, the corrective structure reasserts itself. Watch $70,500 as the first level, with $65,000 as the medium-term target.
Is $80,500 the launchpad or the ceiling, and does the structure confirm a bottom at $60,125? Let us know in the comments!
This content is not directed to residents of the EU or UK. Any opinions, news, research, analyses, prices or other information contained on this website is provided as general market commentary and does not constitute investment advice. ThinkMarkets will not accept liability for any loss or damage including, without limitation, to any loss of profit which may arise directly or indirectly from use of or reliance on such information. Long