USD/JPY Jumps as BOJ Hike Disappoints Yen BullsUSD/JPY jumped as much as roughly 1.2% on Friday, September 18, trading near 157.90 after the BOJ raised its policy rate by 25 basis points to 1.25%, the highest level in 31 years. The hike itself was fully expected. The surprise came from the 7-2 vote and the lack of a more forceful signal that additional hikes are imminent. Governor Kazuo Ueda kept the door open to further tightening, but markets focused on the dissent and the absence of a clear acceleration in the hiking cycle. The result was classic “buy the rumor, sell the fact” behavior in the Japanese Yen.
The U.S. side made that reaction even more violent. The Fed raised rates this week to 3.75%-4.00% and signaled that additional tightening remains on the table, keeping Treasury yields elevated and preserving a wide rate advantage for the U.S. Dollar. That leaves the BOJ in an awkward spot: it is tightening faster than before, but still not fast enough to close the policy gap. Intervention risk therefore stays relevant if USD/JPY pushes back toward 160, especially after the coordinated U.S.-Japan action earlier this summer. Today’s move says the market wants more than a BOJ hike. It wants a credible path toward several more.
USD/JPY is in a reflex rally after a violent breakdown, and the chart still looks damaged. The pair flushed from roughly 160.00 to the 153.00 area, then snapped back to 156.70. That rebound has reclaimed the fast moving averages, which is constructive at the margin, but price is still underneath the heavier 50-, 100-, and 200-day resistance cluster sitting roughly in the 158.00-159.00 zone. Until that area is recovered, this reads more as a bounce inside a broken trend rather than a new leg higher. The cleaner bearish setup is selling a failed push into 157.50-158.50. That zone catches the longer moving averages and the underside of the prior breakdown. If USD/JPY stalls there, the first downside level is 155.50, then 154.00, with the recent low around 153.00 as the bigger test. USD/CHF Breaks Out as Fed Hike Widens the Rate GapUSD/CHF rose roughly 0.9% on Wednesday and pushed above 0.8250 as the Dollar firmed broadly following the Federal Reserve's decision to lift the target range by 25-bps to 3.75%-4.00%, its first increase since 2023. The vote was unanimous, and the updated Summary of Economic Projections carried a hawkish tilt, with only two participants treating the new range as sufficient for the remainder of the year against four projecting a further 50-bps before December. Chair Kevin Warsh used the press conference to stress a faster return to the 2% inflation target, giving the Dollar a second leg of support once the statement itself had been digested.
The Swiss side of the pair offers no offset. The SNB policy rate has sat at 0% through both the March and June assessments, markets assign almost no probability of a change at next Thursday's update, and the first hike is not priced until well into 2027. That leaves USD/CHF as the cleanest rate differential expression in G10, and one that is widening at a time when most other policy spreads are compressing. It also explains the growing interest in the pair as a carry vehicle, with Swiss funding costs pinned at zero and none of the two-sided policy risk embedded in USD/JPY, where the BOJ is still normalizing and officials have a history of leaning against the move near round numbers. Swiss authorities have tended to lean the other way, flagging a willingness to counter excessive franc appreciation, though the franc's safe haven bid remains the clearest threat to any carry structure should risk sentiment deteriorate.
In the above chart, USD/CHF has cleared 0.8200 for the first time since June 2025, a level that rejected the pair in July 2026 and has stalled advances repeatedly since. Today's move carries better quality than those earlier attempts, trading decisively through the level rather than probing it intraday. There is little reference overhead until 0.8500, the high from the last period the pair occupied this range. RSI has pushed to 70, and while that reading would ordinarily invite a contrarian fade in a range-bound market, momentum extremes are unreliable in the opening stage of a repricing and overbought conditions can persist while global markets absorb the Fed's shift. The more useful near-term test is whether 0.8200 converts from resistance into support on the first pullback, which would define a new range. A failure to hold it would frame today as an event-driven one-off rather than a trend change. Euro Holds Key Support as Fed Hike Bets Firm and Oil CoolsEUR/USD traded lower on Friday but held a remarkably tight range for the week as a whole, with a heavy calendar failing to dislodge the pair from its recent footing. U.S. CPI landed roughly in line with expectations, and the Dollar firmed on the release as traders read the print as clean enough to allow the Federal Reserve to tighten next week. Offsetting that, crude retreated around 3% from its highs, easing the energy-linked drag that had weighed on the Euro through the first half of the week and leaving EUR/USD only modestly softer into the weekend.
The Euro's inability to capitalize on Thursday's ECB decision remains the story of the week. Policymakers raised rates and President Christine Lagarde struck a mildly hawkish tone, pointing to the likelihood of further increases through year-end, yet the single currency gained little traction as surging crude prices sustained safe haven demand for the Dollar. Friday reversed that dynamic in part: with oil off its highs and market-implied odds of a hike at next week's FOMC meeting now above 80%, the relative rate story is being priced from the U.S. side rather than the European one. That leaves the week ahead dependent primarily on the Fed, with oil back on the front page as a secondary driver; fresh highs in crude have so far translated into marginal Dollar strength against the Euro and other risk sensitive currencies.
In the above chart, EUR/USD rates are clinging to the 1.1600 handle after a week of compressed, two-way trade. The initial Dollar bid on the CPI release stretched the pair down to 1.1570, where the daily 50- and 100-EMAs (exponential moving average) cluster, and the rejection there ahead of the U.S. cash open was firm. Euro bulls now need a spot close above 1.1600, home to the 5- and 20-EMA cluster, to carry a neutral technical balance into next week. Dollar bulls, by contrast, need another test of support near 1.1580 that gives way on a closing basis; without it, Friday's probe lower reads as a failed break rather than the start of a larger downturn. Japanese Yen Rips as BOJ Hike Bets BuildUSD/JPY traded lower as U.S. trading resumed on Tuesday as the Japanese Yen extended its sharp rally, briefly strengthening to its best level since February before giving back part of the move later in the session. The catalyst? Domestic Japanese data: real wages rose 2.4% year-over-year in July, the strongest gain since 2021; and second-quarter GDP was revised up to a 1.4% annualized pace. That gave markets more confidence that the Bank of Japan has enough cover to raise rates again at the September 17-18 meeting, with traders pricing in 97% chance of a 25-basis-point hike to 1.25%, per Japan overnight index swaps.
The U.S. side is keeping the move from becoming a straight-line collapse in USD/JPY. Friday’s stronger payrolls report kept September Fed hike odds alive near 60%, and this week’s U.S. inflation data can still reset the U.S. Dollar quickly. Intervention risk remains in the background after the summer’s Yen-buying operations, but today’s move looked more like carry-trade stress and BOJ repricing than fresh official action. Rate checks and MOF warnings can still hit the tape if price action gets disorderly, but the Japanese Yen finally has a cleaner fundamental driver, at least through the end of next week: wages, growth, and a BOJ that may be ready to move again.
USD/JPY has broken trend support, losing the rising trendline that carried the entire advance from the April 2025 low. The pair has since sliced through the moving-average cluster and is now sitting below the 155.00 shelf that had been the key support zone since the summer intervention scare. The chart’s structure has evolved, from controlled uptrend to downside momentum with failed rebounds likely to get sold.
A clean bearish setup could be selling failed rebounds into 155.00-156.50. That zone is now the first major test. Momentum confirms the damage. MACD has rolled over below the zero line with red histogram expanding, and stochastics are buried near oversold. The pair is stretched short term, so a snapback is possible, but the broader message is clear: the Japanese Yen has taken control and the U.S. Dollar has lost the rate-driven trend support. If USD/JPY cannot reclaim it quickly, sellers could stay in control and the next downside levels are 152.00, then 150.00-150.50. A move into that area would mark a full reset of the summer breakout. GBP/USD Firms as Warsh Dollar Rally Loses SteamGBP/USD traded modestly higher on Monday, with Sterling up 0.13% near 1.3548 as the U.S. Dollar eased from Friday’s Warsh-driven spike. Fed hike odds remain elevated after Kevin Warsh warned that the Fed still has work to do on inflation, but traders are now waiting for August payrolls before pressing the U.S. Dollar higher again. The median Reuters forecast is for 55,000 jobs after July’s surprise contraction, so the labor print has real power to reset September Fed pricing.
The U.K. side is still being filtered through gilts and the BOE. The 10-year gilt yield eased slightly to 5.14%, but it remains high enough to keep financial conditions tight and the policy debate uncomfortable. U.K. inflation rose to 2.9% in July, the labor market remains subdued, and markets have pushed the next full BOE hike deeper into 2027 as oil volatility complicates the inflation outlook. GBP/USD caught a bid today, but the move was mostly U.S. Dollar weakness. Sterling still needs calmer gilts and a cleaner U.K. growth story to build anything more durable.
GBP/USD has pulled back into the first real test of the August breakout. The pair cleared the descending trendline that had capped rallies since the February spike, ran into the upper-1.36s, then faded back toward 1.3550. That puts price right on the line between a healthy retest and a failed breakout near the July swing high. Cable has repaired the chart, but buyers now need to defend the breakout zone.
The key area is 1.3500-1.3550. That zone has the prior breakout, the short-term moving averages, and the first support shelf from the August advance. Hold it, and the broader recovery remains intact. Lose it, and the move starts looking like another false break in a pair that has spent most of the year chopping around trendline resistance. MACD is still positive, but it has rolled over. Stochastics have flushed quickly toward oversold, which says the near-term selling pressure is getting mature, though it has not confirmed a turn yet. Aussie Nears 0.7200 as Dollar Awaits Warsh at Jackson HoleAUD/USD traded 0.33% higher on Thursday, lifting the pair toward 0.7200 and its highest level since late May. The move also puts AUD/USD on track for a ninth straight weekly gain. The rally has stairstepped higher since the June lows, with the pair chopping for days at a time around each round number before trading decisively through it, and 0.7200 is now the next of those tests.
The domestic case for the Aussie Dollar was established earlier in the week. Australian inflation came in above expectations, keeping further RBA tightening firmly in play, with some economists now positioning for a hike as soon as the September meeting. That leaves the near-term swing factor on the Dollar side, where the currency is balancing a hot PCE reading that argues for a firmer policy stance against a risk-on tone that erodes safe-haven demand. Risk appetite has been winning in this pair, which is unsurprising for a high-beta currency carrying a live domestic tightening story behind it, but Fed Chair Kevin Warsh's Jackson Hole address on Friday is the event capable of resetting that balance into the weekend. Australian GDP next week follows as the next scheduled test of the domestic case for higher rates.
In the above chart, AUD/USD rates are approaching 0.7200, a level that repeatedly capped rallies in the spring as the shoulders of a head and shoulders top. That formation has lost most of its predictive value now that price has recovered to where the pattern began, but the horizontal supply it left behind is still the obstacle in front of the market. The one time the pair cleared this area, the rally extended to just shy of 0.7300, the logical next reference point on a daily close above 0.7200. Momentum is worth watching from here. RSI has reached 70, a threshold commonly read as overbought, though in a trend that has held for nine weeks that reading can equally reflect the strength of the move rather than signal a turn. A clearer warning would be RSI failing to make a new high alongside price. To the downside, a rejection at 0.7200 that leaves a lower high would put the weekly streak at risk, and given how abruptly the pair has flushed on reversals this year, 0.7100 stands as the next congestion point below. USD/CAD Rises as Canada Trade Shock Hits the LoonieUSD/CAD rose half of one percent on Monday as the Canadian Dollar came under pressure after U.S.-Canada trade negotiations broke down. Markets reacted to the renewed tariff fight, with the U.S. imposing 50% tariffs on a range of Canadian goods and Canada preparing a dollar-for-dollar response. That hit the Canadian Dollar directly because it raises growth risk, threatens export demand, and adds a fresh political premium to Canadian assets. Even though the broader U.S. Dollar was not especially clean today, it outperformed the Canadian Dollar as trade risk became the dominant driver.
Oil made the move worse. Crude prices fell around 2% as markets waited for new U.S. sanctions on Iran, stripping away the usual commodity support Canada gets when energy markets are firm. For the BOC, this is a bad mix: tariffs threaten growth, oil weakness hurts the terms-of-trade story, and inflation risk is still complicated by trade policy. The central bank has room to stay patient, but the Canadian Dollar does not get much support from a patient BOC when the U.S. side still has firmer rate expectations and Canada is absorbing a direct trade shock.
USD/CAD is bouncing, but the chart has not repaired yet. The pair flushed hard from the late-June high above 1.4200, broke below the moving-average stack, and sliced through the prior support zone around 1.3920-1.3970. That zone is now the key resistance band. Today’s move back toward 1.3825 is a relief rally from oversold conditions, not a confirmed trend reversal.
The short-term damage is still visible. The 1-week and 1-month EMAs (exponential moving averages) are sloping lower, price is below the 50-day EMA, and the 1.3920-1.3970 shelf sits directly overhead. MACD remains negative, which says downside momentum has not fully unwound. Slow Stochastics are the one near-term bullish input: they are turning up from oversold territory, so the Canadian Dollar short squeeze has paused and the U.S. Dollar can bounce for a few sessions. But until USD/CAD reclaims the broken support zone, the move looks corrective. EUR/USD Rises as U.S. Dollar Buckles Under Bond-Market StressEUR/USD traded higher on Thursday, August 20 as the U.S. Dollar came under pressure after Treasury moved to expand long-dated bond buybacks in an effort to calm stress at the long end of the curve. The move initially pulled yields lower and hit the U.S. Dollar, with markets treating it as a signal that policymakers are becoming more sensitive to the rise in long-term borrowing costs. The Euro caught the bid, but the rally was more about U.S. Dollar weakness than a sudden improvement in the Eurozone growth story.
For the Eurozone, the ECB rate path remains defined by inflation risk rather than economic strength. Higher energy prices and lingering supply pressures are keeping another ECB hike on the table, even as growth across the bloc remains uneven. That gives the Euro some support, but it is not a clean bullish setup. EUR/USD is moving because the U.S. side of the trade is cracking first: bond-market stress, Fed uncertainty, and a U.S. Dollar long trade that is being forced to unwind.
EUR/USD broke above the descending trendline that has capped rallies since the January spike, cleared the moving-average cluster, and pushed into the mid-1.16s. That shifts the short-term structure from “sell every rally” to “respect the breakout.” The Euro is no longer stuck underneath the downtrend. It has forced the U.S. Dollar back onto defense.
The current setup may favor buying pullbacks into 1.1620-1.1600, using a close back below 1.1550 as the line in the sand. If buyers defend that zone, EUR/USD has room toward 1.1750, then 1.1800. That 1.1800 area is the next major test because it lines up with the spring failure zone. It would likewise line up with the Dollar Index ( TVC:DXY ) returning towards its yearly lows. For shorts, the setup is not “sell because it rallied.” The better bearish case needs time because it would be a failed breakout: price loses 1.1600, slips back under the moving-average cluster, and momentum rolls over. Until that happens, fading the Euro is fighting the tape. Australian Dollar Rises as RBA Keeps Hike Risk AliveAUD/USD moved higher on Tuesday after the Reserve Bank of Australia held the cash rate at 4.35% and kept a hawkish bias in place. The pause was expected, but the message was not dovish. Governor Michele Bullock made clear that another hike remains possible if inflation does not keep moving in the right direction. That gave the Australian Dollar support, with traders treating the decision as a hold with teeth rather than a step toward easing.
The U.S. side is now the next test. The U.S. Dollar was steady as markets waited for July CPI, with Fed hike odds cooling after the weaker jobs report but not disappearing. Oil remains a complication after renewed Strait of Hormuz tension, because higher energy prices can keep inflation risk alive for both the Fed and the RBA. For AUD/USD, the setup is straightforward: the Australian Dollar has support from an RBA that is still worried about inflation, but follow-through depends on whether U.S. CPI gives the U.S. Dollar a fresh reason to push back.
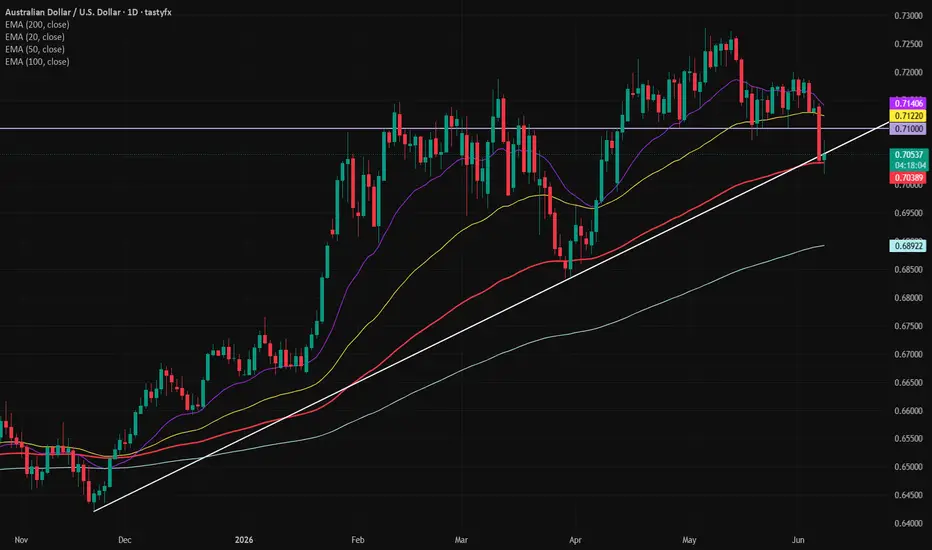
AUD/USD is in better shape than it was in late-June and early-July. The pair has rebuilt from the 0.6880 area, reclaimed the 0.7000 handle, and is now holding above the moving-average cluster. That is constructive. The rising trendline from the late-2025 low is still intact, and the July pullback held well above that longer-term support. The chart has repaired enough to shift the short-term bias from “sell the bounce” to “respect the recovery.”
The issue is overhead supply. Price is trading near 0.7065, right into the lower end of the old breakdown zone from June. The next real test is 0.7100/30. That area is where prior support turned into resistance, and it is where the Australian Dollar needs follow-through to prove this is more than a relief rally. Momentum is supportive but not explosive. MACD has turned higher and is back above the zero line, while Slow Stochastics are near the upper end of the range and starting to flatten. That says buyers have control, but the easiest part of the bounce may have already happened. USD/JPY Intervention Bought Time, But Did the Trend Change?USD/JPY stayed under heavy scrutiny on Friday after Japan reportedly intervened in New York trading on Thursday, buying Japanese Yen and selling U.S. Dollars as the pair’s move toward the mid-160s became politically and economically dangerous. The timing matters. Japan is already dealing with an Iran-driven energy shock, and a weaker Japanese Yen makes imported fuel more expensive, worsens the terms of trade, and pushes household inflation pain higher. The BOJ then kept rates unchanged at 1%, with one dissent in favor of a 25-basis-point hike, which tells the market the central bank is still moving gradually even as the currency problem becomes more acute. That is why intervention helped, but did not fully change the conversation. It slowed the move, punished crowded longs, and bought time. It did not erase the U.S.-Japan rate gap.
The process matters as much as the price action. In Japan, the Ministry of Finance makes the intervention decision, and the BOJ typically executes as agent. The sequence usually starts with verbal warnings, then rate checks, where authorities ask banks for live dollar-yen quotes. A rate check is not the trade itself; more like the market equivalent of loading a shotgun loudly. If they move, Japan sells U.S. Dollars from its reserves and buys Japanese Yen, which drains yen liquidity from the system. That is why traders look at BOJ current account projections afterward. An unusually large projected funds shortfall can reveal the rough size of the operation, and today’s estimates pointed to a potentially massive yen-buying effort. Intervention can create violent downside gaps in USD/JPY, while a durable Japanese Yen recovery probably requires either lower U.S. yields, faster BOJ tightening, or both. USD/JPY has sliced through the short-term moving averages and is now testing the more important support shelf. MACD is rolling over and the histogram has flipped sharply negative, which says upside momentum has been damaged. Stochastics have also plunged from overbought toward the lower end of the range, which confirms the near-term shift from trend-following to liquidation. The key point: this is no longer a clean long U.S. Dollar/Japanese Yen chart, but rather an intervention-risk chart sitting on trend support.
For traders looking on the Yen’s side, chasing down here is probably imprudent and a more patient approach could be selling failed rallies back into 160.50-162.00, where trapped longs and moving-average resistance should show up. If USD/JPY cannot reclaim that zone quickly, the intervention candle becomes overhead supply. Closing below the rising trendline from 2025 would make the next downside pocket just under 158.00 at the 200-day EMA before a larger range of 156.00 is realistic, but it would likely require participation from U.S. Treasury yields and a belief that selling Yen is fraught in the face of interventionist threats. Aussie Dollar Falls as RBA Warning Fails to Beat the U.S. DollarAUD/USD traded lower on Tuesday, July 28 as the Australian Dollar slipped despite another hawkish warning from RBA Governor Michele Bullock. Bullock said underlying inflation remains too high and that another slowdown in domestic demand may be needed to bring price pressures under control. Markets still price another RBA hike this year, which would take the cash rate toward 4.6%, but that was not enough to lift the Australian Dollar against a broadly stronger U.S. Dollar.
The issue is relative policy momentum. The RBA is hawkish because inflation is sticky and oil-driven costs are still passing through the economy, but the Fed has the immediate event risk this week. Falling oil prices eased some global inflation pressure, yet markets are still treating a Fed hike as a live outcome. That kept AUD/USD under pressure. The Australian Dollar has a domestic tightening story, but today the U.S. Dollar had the cleaner catalyst.
AUD/USD is losing short-term control after failing at the 0.7000 area. That level is doing a lot of work: round-number resistance, prior support, and a cluster of short and medium-term moving averages all sit around the same zone. The rally off the July low near 0.6830 recovered enough to reset sentiment, but it has stalled directly into supply. Price is now back under 0.6970, which turns the recent bounce into a corrective move unless buyers can quickly reclaim 0.7000.
Momentum is also fading. MACD has recovered from the June/July washout, but it is flattening near the zero line instead of accelerating through it. That says the rebound has lost energy before confirming a real trend shift. Stochastics have rolled over from the upper half of the range, which adds near-term downside pressure. The moving averages are flattening and compressing, so this is less of a clean trend and more of a failed recovery attempt inside a broader chop zone. Canadian Dollar Stuck Between Tariffs and OilUSD/CAD traded with a firmer tone on Tuesday as the Canadian Dollar remained under pressure from the latest U.S. tariff escalation. The U.S. imposed a 50% tariff on a range of Canadian goods tied to disputes over cars, alcohol, and dairy, which immediately complicates Canada’s trade outlook. Normally, elevated oil prices would give the Canadian Dollar a cleaner tailwind, but tariff risk and weaker domestic momentum are making that support less powerful.
For the BOC, the rate path remains a hold story. The central bank kept rates at 2.25% last week and continues to balance elevated inflation against soft growth and trade uncertainty. Canadian inflation already surprised to the downside this week and is expected to ease if oil and gasoline pressures fade, but that forecast now sits against a more complicated trade backdrop. The Canadian Dollar is stuck between two forces: oil supporting Canada’s terms of trade and tariff risk undermining confidence in the growth outlook.
In the above chart, USD/CAD has found follow through in recent weeks after finally breaking out of a multiyear triangle that originated in 2023. In June it was noted that “the first hurdle to validate the bullish breakout is the band of resistance formed by the highs in January, March, and April of this year around 1.3929/66. Through these levels, USD/CAD may have offered the strongest confirmation yet that the near three-year triangle has ceded way to a new bullish trading regime.” Along these lines, USD/CAD’s recent turn higher through its 50-day EMA (exponential moving average) ahead of 1.3929/66 suggests that a series of higher highs and higher lows is emerging. The low carved out by the bullish engulfing bar on July 20 just above 1.4000 may be respected as a turning point in the near-term. That said, a resolution of the fundamental disputes, particularly on tariffs, could override this technical turning point and shift the near-term focus back to the downside. EUR/USD Holding Intact Despite Soft Inflation and Oil SpikeEUR/USD probed the top of its monthlong range on Wednesday, closing at a three-week high just below 1.1470, before easing back under 1.1450 through Thursday's U.S. session. The pair has largely absorbed this week's softer inflation prints and shrugged off the initial lift they provided, leaving it hemmed inside the roughly 1.1350 to 1.1450 band that has contained it for about a month. Rather than pressing the upside, EUR/USD has drifted back toward the middle of the range as the Dollar reasserts a firm tone.
The fundamental backdrop has quietly shifted beneath the price action. This week's CPI and PPI both landed below expectations, softening the near-term inflation picture, but a fresh climb in oil has since begun to overshadow those misses. Heightened geopolitical tension, with U.S. strikes against Iran intensifying and Brent pushing above $85, has revived inflation concerns and firmed the case for further tightening, while also lending the Dollar a safe-haven bid. The same oil shock cuts the other way for the Euro, weighing more heavily on Eurozone growth prospects given the region's reliance on imported energy. With the Fed and ECB otherwise viewed in broadly similar positions, that asymmetry in how the two economies absorb the oil move has been enough to keep the Dollar supported and the Euro capped.
In the above chart, EUR/USD rates continue to respect a monthlong consolidation, with ~1.1450 reasserting itself as former support turned resistance. Wednesday's close just under 1.1470 marked a brief peek above that hurdle, but the failure to hold there and the subsequent slip back below 1.1450 leaves the range unbroken and the breakout unconfirmed. Within the holding pattern, short-term traders can watch the 20-day EMA (exponential moving average), sitting right at today's low, to gauge whether it holds as near-term support. A decisive push through 1.1470 would reopen the path toward 1.16, while a move below 1.1350 would validate what is shaping up as a bear flag and shift focus to the downside. With no major data due between now and next week's ECB meeting, geopolitical developments may prove the most likely catalyst to break the pair out of its range. Sterling Clears 1.35 as Soft PPI Cracks the DollarGBP/USD rallied around 1% over the past seven hours, clearing both 1.34 and 1.35 within the same session to trade above 1.3550 by Tuesday afternoon. The move puts Sterling up more than 1.5% from this week's lows and marks the highest level since May 12. The pace and breadth of the advance stand out against a backdrop in which the U.S. Dollar largely shrugged off softer CPI data yesterday.
The rally reflects a combination of forces working in Sterling's favor. On the domestic side, fading U.K. political uncertainty has lifted the pound, while on the U.S. side, a softer than expected PPI print has weighed on the Dollar. That second leg is the more notable development: the Dollar had held up reasonably well through June even as both CPI and PPI came in soft, so today's reaction looks like the clearest crack yet in an otherwise resilient Dollar. Whether the move has legs will depend on whether it is underpinned by a genuine shift in the Dollar or simply a burst of political optimism that fades once positioning settles.
In the above chart, GBP/USD has broken decisively higher through 1.35, exposing a fresh range with the next resistance sitting above 1.36. Price has also pulled clear of its major moving averages, which had been clustered around 1.340 and now sit below as potential support. Momentum is firmly to the upside, but the scale of the move warrants some caution: today's range is running at roughly double the pair's average true range (ATR), and with RSI approaching 70 a near-term pullback would not be surprising even if the broader uptrend holds. A single strong session does not confirm a trend, and some consolidation may be needed before the durability of the breakout can be judged. USD/CHF Rises as Dollar Yield, Safe-Haven Demand ReturnsUSD/CHF rose 0.63% on Monday as the U.S. Dollar caught a fresh bid from renewed geopolitical stress and rising energy prices. The latest escalation between the U.S. and Iran pushed oil higher and put inflation risk back at the center of the market. Higher energy prices complicate the Fed’s job, keeping markets focused on whether U.S. rates need to stay higher for longer. Even with the broader Dollar Index only modestly firmer, the U.S. Dollar outperformed the Swiss Franc as traders leaned into U.S. rate support and safe-haven liquidity.
Switzerland’s setup is different. The SNB left its policy rate at 0% in June and kept its inflation forecast low, with average inflation projected below 1% through 2028. Higher oil prices have lifted near-term Swiss inflation, but the SNB still views medium-term price pressure as contained. That gives policymakers little reason to follow the Fed higher. The SNB has also signaled a willingness to intervene if Swiss Franc appreciation becomes excessive, which limits the currency’s safe-haven upside. Today’s USD/CHF move underscored that policy split: U.S. inflation risk is keeping the Fed conversation alive, while Switzerland still looks like a low-rate, low-inflation economy.
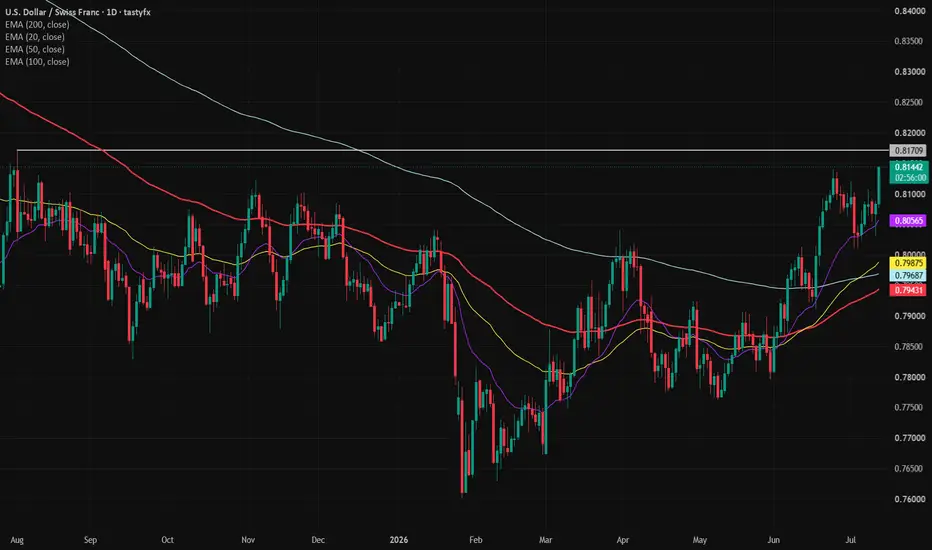
In the above chart, USD/CHF rates are taking another crack at resistance in what has become a very familiar area near 0.8100, which has be the major unclearable hurdle for advance for the past 13 months. When USD/CHF rallied to this area at the end of June, it was noted that “while a pause in this area wouldn’t be a surprise, the context of the Dollar Index (DXY) breaking above 100 suggests a meaningful low in the USD-complex has been found.” Price action has reinforced this view, with USD/CHF indeed failing to break above 0.8100 but DXY was able to sustain its breakout above 100, confirming the attempt at a major USD bottom. A push through the August 2025 high at 0.8171 would offer a strong signal that USD/CHF has turned the corner, perhaps for the next several months. Conversely, a failure at resistance would leave the range intact and tilt the risks lower, particularly if inflation cools enough to sideline the case for near-term Fed hikes or if fading geopolitical tensions erode safe-haven demand for the Dollar. NZD/USD Falls as RBNZ Hike Path Gets MessyNZD/USD fell as much as half of one percent to start the week as the U.S. Dollar regained ground coming out of the holiday weekend. U.S. yields were mixed, but the broader dollar tone improved as markets wait for Wednesday’s Federal Reserve minutes and reassessed how much room the Fed really can ease – or worse yet, have to tighten – while inflation remains sticky. That left the New Zealand Dollar exposed, especially after a rough stretch where global growth concerns, softer commodity sentiment, and fading risk appetite have weighed on higher-beta currencies.
In New Zealand, the focus is squarely on the RBNZ’s July 8 policy decision. The Official Cash Rate (OCR) sits at 2.25%, but the debate has shifted from easing risk to whether the central bank needs to gradually remove accommodation as inflation stays above target. The limiting factor for delivering a rate hike is growth. The IMF recently warned that New Zealand’s recovery has been delayed by the oil shock and global uncertainty, with inflation expected to stay above the RBNZ’s target band through year-end. That leaves the RBNZ with an ugly, almost stagflation-like mix: inflation too high to turn dovish, growth too soft to sound aggressive.
In the above chart, NZD/USD is struggling to establish a bottom after hitting fresh yearly lows within the past two weeks. The rebound has seen a bearish evening star candlestick pattern emerge against the 1-month moving average, suggesting that recent gains haven’t been significant enough to confidently call a durable low. Similarly, a close below 0.5681 would mean failure to retake the April swing low and would offer greater confidence that a return to the yearly low at .5627 could be revisited soon. USD/CHF Slips as Fed Hike Bets Lose SteamUSD/CHF fell 0.2% midway through Monday, June 29 as the U.S. Dollar softened after a strong June run, perhaps profit taking at the end of month and quarter. The key shift has been the retracement in Fed hike odds over the past few sessions. Markets had aggressively priced a more hawkish Federal Reserve after firmer inflation pressure, resilient U.S. data, and the Iran oil shock, but that trade is starting to cool as oil stabilizes and Treasury yields lose some momentum. Once the rate impulse faded, the U.S. Dollar lost its cleanest source of support.
For Switzerland, the setup remains steadier. The Swiss Franc is still backed by defensive demand and a Swiss National Bank that has little reason to fight currency strength while inflation remains contained. The SNB’s inflation outlook remains low by global standards, giving policymakers flexibility even as imported price pressures fluctuate. Today’s move was less about a sudden Swiss catalyst and more about the U.S. side of the equation: when Fed hike expectations stop rising, USD/CHF becomes vulnerable to a pullback.
In the above chart, USD/CHF rates have found resistance at a familiar area near 0.8100, which has capped rallies since late-June 2025. While a pause in this area wouldn’t be a surprise, the context of the Dollar Index (DXY) breaking above 100 suggests a meaningful low in the USD-complex has been found. To this point, USD/CHF’s downtrend from the 2025 high has likewise broken, adding another piece of technical evidence that major lows have been established. For the time being, USD/CHF’s overall bullish momentum profile should keep dip buyers intrigued, with support coming near the June 11 swing high and 1-month EMA (exponential moving average) around 0.8010/30. That said, the longer the pair lingers without a meaningful push to the topside, the greater the risk that momentum fades and the wider 2026 range comes back into play to the downside. Sterling Slips Below 1.3200 as Fed Hike Bets Outweigh Political GBP/USD traded lower on Tuesday, slipping around 0.5% to trade back under 1.3200, a level that has come to define the floor of the pair's 2026 range. Sterling first tested this area last Thursday in the immediate fallout from the FOMC and Bank of England decisions, but it found its footing over the following sessions, bouncing on both Friday and Monday before today's renewed selling. The move owes largely to a firmer U.S. Dollar, with the USD drawing support from an aggressive repricing of the Federal Reserve's policy path. Notably, the pound's lack of standout moves on the crosses (little changed against the Euro, firmer against the Aussie, softer against the Yen) is exactly what a risk-off backdrop would produce, reinforcing that today is a dollar and risk story rather than anything sterling-specific.
That repricing has been the week's dominant force. Last week's FOMC, compounded by fresh tech-driven jitters across risk assets in recent sessions, has nudged markets toward pricing in one or more Fed rate hikes before year-end, a shift squeezing bond markets and lifting the cost of capital, both dollar-supportive. On the U.K. side, Prime Minister Keir Starmer's surprise resignation initially weighed on the pound, only for the reaction to reverse as markets coalesced around expectations that Andy Burnham would assume the leadership uncontested. The prospect of an orderly handover rather than the turmoil some had feared, paired with optimism over steadier governance, has tempered the domestic risk premium. Attention now shifts to Thursday's PCE inflation report as the key test: a hotter print would validate the hawkish Fed narrative and extend the dollar's bid, while a cooler reading could reopen the path for risk assets, Sterling included, to recover.
In the above chart, GBP/USD is back to pressing 1.3200, the level that increasingly looks like the floor of the broader 2026 range. Until last week, price action had the look of a consolidating triangle, drawn off the early-April lows and the May highs near 1.3600, with the pair chopping around 1.3400, but last week's break lower has reframed that structure as a test of the range bottom rather than a coil within it. The early-April lows, which double as the year-to-date lows, held firm on their brief test then and are doing the heavy lifting again now, having absorbed Thursday's initial probe before Friday's and Monday's bounces. A decisive close below 1.3200 would turn attention toward the November 2025 low near 1.3000 as the next downside reference; until then, the repeated defenses of recent sessions keep the range intact. Loonie Treads Water Ahead of BOC DecisionUSD/CAD was mostly unchanged on Tuesday as traders largely stayed on the sidelines ahead of the Bank of Canada’s policy announcement. The Canadian Dollar found support from improving risk sentiment after tensions in the Middle East eased, but gains were limited as investors remained focused on the domestic outlook. With oil prices off their recent highs and recession concerns lingering in Canada, the currency market spent the session waiting for guidance from Governor Tiff Macklem rather than reacting to geopolitical developments.
The consensus expectation is that the BOC will leave its overnight rate unchanged at 2.25%, extending a pause that has been in place since late 2025. Policymakers continue to face competing forces: inflation has moved higher due to energy prices, but underlying demand remains soft and the economy has struggled to generate sustained momentum. Markets increasingly believe the BOC will remain on hold for most, if not all, of 2026, leaving USD/CAD caught between a relatively resilient U.S. economy and a Canadian economy still searching for firmer footing.
In the above chart, the sheer scale of the consolidation is noteworthy, insofar as USD/CAD may finally be breaking out of a multiyear triangle that arguably began in 2023. Triangle resistance from the February 2025 and March 2026 highs has been breached. The first hurdle to validate the bullish breakout is the band of resistance formed by the highs in January, March, and April of this year around 1.3929/66. Through these levels, USD/CAD may have offered the strongest confirmation yet that the near three-year triangle has ceded way to a new bullish trading regime.
Failure here to confirm the breakout would increase the possibility that the triangle interpretation is invalid, and instead a sideways consolidation between 1.3480 and 1.3970 would be a more proper framing for price action. Euro Rebounds as ECB Hawkish Shift Meets Softer Dollar EUR/USD rose by 0.2% on Thursday as traders continued to shift expectations around the European Central Bank ahead of next week’s policy meeting. Persistent inflation concerns tied to energy, tariffs, and services pricing have pushed markets toward expecting a more hawkish ECB stance, with growing speculation that policymakers may need to tighten further rather than move toward easing. That repricing helped support the euro despite uneven growth conditions across the Eurozone, as investors focused more heavily on inflation persistence and the potential for higher rates.
On the U.S. side, weaker jobless claims and services data weighed on Treasury yields and softened the dollar ahead of Friday’s nonfarm payrolls report. Markets are increasingly debating whether the U.S. economy is beginning to slow after a prolonged period of resilience, particularly as higher oil prices, tariffs, and tighter financial conditions work through the economy. The combination of a firmer ECB outlook and softer U.S. macro momentum helped lift EUR/USD, with the pair driven primarily by shifting relative rate expectations between the Eurozone and the United States.
In the above chart, EUR/USD has consolidated into a triangle since January, with price action producing a narrowing range that may be nearing its breakout point. Triangle support is holding for now, off the uptrend from the March and May lows, but EUR/USD is still pinned below its exponential moving average (EMA) envelope. A loss of recent swing lows near 1.1577 would suggest that a bearish breakout has begun. Otherwise, bulls won’t find technical confirmation until a breach of the May high at 1.1796. Sterling lags peers as Markets Reassess U.K. Outlook GBP/USD found its footing midway through Thursday, May 28 but remained down around -0.15% on the week as Sterling continues to struggle for momentum amid growing concern about the U.K. economic outlook. Recent U.K. data has pointed toward slower activity across consumer-facing sectors while elevated borrowing costs and persistent inflation continue tightening financial conditions. Investors remain cautious toward U.K. assets following recent volatility in Gilt markets, with concerns lingering that weaker growth and sticky inflation leave policymakers with limited flexibility.
In the United States, a comparatively firmer economic backdrop and stable Treasury yields helped keep the U.S. Dollar supported, though risk‑on sentiment following Thursday’s Iran‑related headlines erased much of its early‑week strength. Markets continue to view the Federal Reserve as patient but not yet prepared to pivot aggressively, particularly as inflation risks tied to energy and supply chains remain present underneath the surface. For Sterling, the challenge remains balancing slowing domestic momentum against a U.S. Dollar still benefiting from relative macro resilience, leaving GBP/USD stuck in a subdued and range-bound environment to close the week.
In the above chart, GBP/USD rates consolidated into a symmetrical triangle since the start of the year: resistance is defined by the downtrend from the January and May 2026 highs, while support is defined by the uptrend from the January 2025 and March 2026 lows. Contextually, the consolidation marks a continuation of sideways, choppy price action that has keep GBP/USD rangebound between 1.3000 and 1.3800 since last April. In the short-term, the lack of direction leaves GBP/USD in a relatively unappealing setup; in the long-term, the consolidation (akin to a coiling spring) will ultimately lead to a breakout. Traders should be open-minded about either a move higher or lower, though patience may be required. Aussie Jumps as Trade Relief Boosts Risk AppetiteAUD/USD rose by 0.6% on Wednesday, May 20 as the Australian Dollar benefited from a broad improvement in global risk sentiment tied to stabilizing trade relations between the United States, China, and the European Union. Markets responded positively to signs that tariff tensions may be easing and that supply-chain pressures tied to industrials, semiconductors, and commodities could stabilize in the months ahead. For Australia, whose economy remains deeply linked to Chinese demand and global trade flows, the shift supported commodity-sensitive currencies and helped drive renewed buying interest in the Aussie.
On the U.S. side, the greenback softened modestly as Treasury yields stabilized and investors rotated back toward higher-beta currencies following several weeks of defensive positioning. Australia’s domestic backdrop also remained relatively supportive, with markets continuing to price a cautious but steady Reserve Bank of Australia policy stance as inflation risks tied to energy and housing remain elevated. The result was a strong session for AUD/USD, driven less by domestic economic surprises and more by improving global macro sentiment and easing trade-related stress.
In the above chart, AUD/USD has found support at its 50-day exponential moving average (EMA), holding the broad uptrend that’s defined calendar year 2026 thus far. While base metal prices have subsided in recent days, as well as precious metals, the continued yield advantage held by the Australian Dollar thanks to the RBA’s hawkish bias are helping to reinforce the push to the upside. If the next leg higher is beginning, then the lows seen over the past few sessions around 0.7079 should hold. Failure to sustain prices above 0.7150, on the other hand, could open the pair to renewed weakness within the broader range of 0.6900 - 0.7100. Sterling Slides as Gilts React to Inflation and Political RiskGBP/USD dropped again on Friday to fall over 2% on the week as investors pulled back from UK assets amid a renewed surge in gilt yields driven by persistent inflation concerns and escalating political uncertainty around Prime Minister Keir Starmer. Markets are increasingly questioning the government’s ability to maintain fiscal discipline while navigating a slowing economy and elevated price pressures, particularly as internal political tensions build. The sharp rise in long-dated gilt yields reflected both inflation risk and a broader deterioration in investor confidence, drawing comparisons to prior episodes where political instability fed directly into UK financial markets.
The pound also faced pressure from a comparatively firmer U.S. backdrop, where Treasury yields stayed elevated and the Federal Reserve maintained a steady, data-dependent stance. For the Bank of England, the current environment is becoming increasingly difficult to manage. Sticky inflation limits flexibility to ease policy, but tighter financial conditions driven by rising gilt yields threaten to weigh further on growth and credit conditions. Sterling’s decline today reflected that tension, as markets reassessed the UK outlook through the combined lens of inflation risk and political instability.
In the above chart, GBP/USD rates have rapidly priced in the difficult political path, with the pair dropping through the entirety of its moving average envelope in the span of three sessions. Momentum has turned sharply negative, with Slow Stochastics in oversold territory and MACD slipping through its signal line. A challenge to the uptrend from the April 2025 and March 2026 lows appears in short order. Beyond there, GBP/USD rates have largely traded between 1.3100 and 1.3800 for the better of the past year; a drop into range lows amidst ongoing political turmoil wouldn’t be the most surprising outcome.