Gold (XAUUSD) EMA Crossover Strategy | Trade Setup AnalysisGold (XAUUSD) EMA Crossover Strategy | Trade Setup Analysis
Professional Educational — Candle by Candle Analysis With Reasons
This Gold (XAUUSD) EMA Strategy chart explains how traders analyze market movement using EMA 9, EMA 15, candlestick behavior, momentum, volume confirmation, entry zones, stop loss, and target management. Every candle shows the battle between buyers and sellers and helps identify possible market direction.
---
1. Bullish Trend Candles
Candle Behavior:
Price moves upward with consecutive green candles and stays above EMA lines.
Reason:
Buyers are dominating because demand is stronger than selling pressure. EMA lines act as dynamic support during the uptrend.
Trading Insight:
As long as candles respect EMA support, bullish momentum remains active.
---
2. EMA 9 & EMA 15 Alignment
Candle Behavior:
EMA 9 moves above EMA 15 during the bullish phase.
Reason:
Short-term momentum is stronger than the longer trend, showing increasing buyer strength.
Trading Insight:
EMA alignment helps traders understand the current market trend.
---
3. Trend Weakness Candles
Candle Behavior:
Small candles appear near the top after a strong rise.
Reason:
Buying pressure starts decreasing and sellers begin entering the market.
Trading Insight:
A slowdown near highs can be an early warning of a possible reversal.
---
4. EMA Bearish Crossover Candle
Candle Behavior:
EMA 9 crosses below EMA 15.
Reason:
Short-term momentum becomes weaker and sellers start gaining control.
Trading Insight:
The crossover becomes stronger when confirmed by candle closing below EMA.
---
5. Strong Selling Candle
Candle Behavior:
A large red candle closes below EMA 9.
Reason:
Sellers show strong pressure and break the previous bullish momentum.
Trading Insight:
Strong candle confirmation gives more confidence than only an EMA crossover.
---
6. Sell Entry Confirmation Candle
Candle Behavior:
Price closes below the EMA zone and confirms weakness.
Reason:
The market shows that sellers are controlling the current movement.
Trading Insight:
Entry confirmation helps avoid false signals.
---
7. Stop Loss Placement
Candle Behavior:
Stop loss is placed above the recent high.
Reason:
The recent high becomes an invalidation level. If price breaks above it, the selling idea loses strength.
Trading Insight:
Proper risk management protects capital.
---
8. Volume Confirmation Candles
Candle Behavior:
Higher volume appears during the strong movement.
Reason:
Increased volume shows stronger participation from market players.
Trading Insight:
Volume can support the strength of a price move.
---
9. Target Reaching Candles
Candle Behavior:
Price continues moving toward the target zone.
Reason:
Selling momentum remains active after EMA confirmation.
Trading Insight:
A complete setup requires entry planning, risk control, and target management.
---
Final Trading Lesson
Every candle has a reason:
Large Green Candle → Strong Buying Pressure
Large Red Candle → Strong Selling Pressure
EMA 9/15 Crossover → Momentum Change
Candle Close → Confirmation Signal
Volume Increase → Market Participation
Stop Loss → Risk Protection
Target Zone → Trade Planning
Professional traders do not follow candles blindly. They study candle formation, EMA behavior, momentum, and risk management to understand the complete market story.  Education
XAUUSD 4H | Liquidity Sweep & Institutional Order FlowXAUUSD 4H | Bullish Trade Direction — Liquidity Sweep & Institutional Order Flow
This 4H Gold chart presents a detailed educational analysis of bullish market structure, liquidity sweeps, institutional order flow, Fair Value Gaps (FVG), BOS, CHoCH, EQH/EQL, demand zones, mitigation areas and key liquidity objectives.
The main purpose of this chart is to study the market candle by candle and understand why each price reaction develops into the next structural move. The analysis focuses on the relationship between candle bodies, wicks, liquidity, displacement, support and resistance rather than treating any single candle as an isolated trading signal.
Initial Price Formation — 4,000 Area
The chart begins around the 4,000–4,100 region, where Gold develops a period of consolidation.
The early candles have relatively small bodies with mixed bullish and bearish closes. This indicates temporary balance between buyers and sellers.
Several candles create similar lows, forming equal-low liquidity.
The repeated lower wicks are important because sellers repeatedly attempt to push price below the previous lows, but buyers continue absorbing that pressure.
When candles fail to establish sustained acceptance below the lows, the downside momentum begins weakening.
This creates the first important demand and liquidity formation.
Bullish Displacement
After the consolidation phase, Gold begins producing stronger bullish candles.
The first larger bullish candles demonstrate increased buying pressure.
The important factor is not simply that the candles are green; they begin closing above previous short-term highs.
This creates a structural shift in order flow.
The sequence becomes:
Liquidity Formation → Bullish Displacement → Break of Structure → Higher High
The larger bullish bodies indicate stronger momentum, while the smaller bearish candles between them represent temporary retracements.
First Bullish FVG Formation
The strong bullish displacement creates several Bullish Fair Value Gaps.
These FVGs represent areas where Gold moved rapidly without significant two-sided trading.
The reason these areas remain visible on the chart is that they can later become potential reaction or mitigation zones.
A bullish FVG is more meaningful when price returns to the area and buyers produce rejection followed by continuation.
Therefore, the FVG should be studied together with candle reaction and structure rather than used independently.
4,200–4,300 Structural Development
As Gold moves higher, the candles begin forming a sequence of higher lows and higher highs.
Some bearish candles appear during the upward movement.
These bearish candles do not immediately invalidate the bullish structure because price continues to hold above previous protected lows.
The smaller bearish bodies indicate temporary profit-taking or retracement.
When the following bullish candle recovers the previous range, it demonstrates that buyers are still defending the structure.
August Bullish Expansion
The strongest bullish phase begins as Gold moves through the 4,300–4,400 region.
Several candles show large bullish bodies and relatively limited lower wicks.
This indicates aggressive buying during those sessions.
The candles repeatedly close near their upper portions, showing that buyers maintain control into the 4H close.
Each successful break above a previous short-term high creates another bullish structural confirmation.
The important sequence is:
Higher Low → Bullish Candle Expansion → BOS → Higher High → Retracement → Higher Low
This is the basic structure supporting the bullish directional bias shown on the chart.
First Major High Reaction
Gold eventually approaches the 4,600–4,700 region.
The candle behavior changes significantly around this area.
Instead of continuous strong bullish bodies, several candles develop upper wicks and smaller bodies.
The reason is that buyers are still testing higher prices, but sellers are beginning to defend the premium area.
The 4,700 region therefore becomes an important external liquidity reference.
A wick above a previous high followed by a close back below it can indicate rejection and possible liquidity collection.
CHoCH After the High
Following the high, Gold starts producing weaker bullish candles.
The candles begin closing lower, and short-term higher lows are eventually broken.
This creates the visible CHoCH.
The reason the CHoCH is important is that it shows a change in short-term order flow.
The market transitions from:
Higher Highs / Higher Lows
toward:
Lower Highs / Lower Lows
The subsequent bearish candles provide additional confirmation because they continue pushing price lower.
Bearish Displacement
Gold then produces a strong bearish displacement from the upper region.
The large bearish candles demonstrate aggressive selling pressure.
One of the important bearish candles breaks below the previous structural support and creates a BOS.
The candle close is more significant than a temporary wick because it demonstrates stronger acceptance at lower prices.
The following bearish candles continue the correction.
However, this bearish phase should be understood in the context of the larger structure rather than automatically interpreted as a permanent trend reversal.
Demand Reaction
After the bearish displacement, Gold reaches the lower 4,200–4,300 demand region.
The candles begin showing longer lower wicks.
This indicates that sellers are still attempting to push price lower, but buyers are absorbing the selling pressure.
The candles around the 4,257–4,223 region become especially important because this area corresponds with previous structural lows and the visible demand zone.
When price repeatedly tests a level without sustained acceptance below it, liquidity can accumulate around that area.
Sell-Side Liquidity Around 4,257
The 4,257.637 region represents an important sell-side liquidity reference.
Price repeatedly approaches the area and creates reactions.
The reason this level is important is that previous lows provide a natural location for liquidity.
A future sweep below the level followed by a strong bullish recovery could provide evidence of a liquidity-grab type reaction.
However, a clean bearish close below the structural floor would represent a different scenario and should not be treated as a bullish confirmation.
Bullish Recovery
After reacting from the lower region, Gold begins producing stronger bullish candles again.
The first bullish candles show initial demand.
The following candles become more important because they begin breaking short-term lower highs.
This creates another CHoCH/MSS-type transition.
The market begins moving from:
Lower High → Lower Low
toward:
Higher Low → Higher High
This is why the current bullish structure is based on a sequence of reactions rather than one isolated bullish candle.
Current Recovery Structure
The recent candles show Gold recovering from the discount area.
Several bullish candles close progressively higher.
The pullbacks between these bullish candles remain relatively controlled.
This indicates that buyers are attempting to maintain the recovery structure.
The recent candles around the 4,300–4,377 region are particularly important because price is developing inside an internal decision area.
A sustained sequence of higher lows would strengthen the recovery structure.
4,377 — Current Market Area
The current price around 4,377.290 sits below the first major upside decision level.
Recent candles show mixed order flow.
Bullish candles are attempting to recover the upper range, while bearish candles continue producing reactions around the supply area.
This creates a short-term battle between buyers and sellers.
The next candle closes are therefore important for determining whether the market develops another bullish expansion or returns toward lower demand.
4,434 — Internal Resistance
The 4,434.397 area represents an important internal resistance/mitigation level.
Price has previously reacted around this region.
A strong bullish 4H candle closing above the area would demonstrate increased buying pressure.
If the breakout is followed by additional bullish candles, the market could potentially move toward the next structural objective.
On the other hand, repeated upper-wick rejection around this level would indicate that sellers remain active.
4,508 — Expansion Level
The 4,508.776 region is the next important upside structural reference.
This level aligns with the previous swing-high structure and the upper FVG region.
For a bullish continuation scenario, the quality of the move toward this area should be judged by candle strength.
A strong bullish displacement candle followed by continuation provides better confirmation than a single wick above the level.
4,508–4,580 Bullish Imbalance
The large blue area around the upper region represents an important Bullish Imbalance/FVG zone.
If price enters this area, candle reaction should be monitored carefully.
Strong bullish closes inside or above the zone would indicate continued demand.
Repeated upper wicks could indicate supply absorption or rejection.
The zone therefore acts as a reaction area, not a guaranteed target.
4,632 — Premium Supply Boundary
The 4,632.225 region sits inside the upper premium area.
This area is important because it is positioned close to the previous major high and external liquidity.
If Gold reaches this region, traders should monitor whether candles show:
- Strong bullish displacement
- Upper-wick rejection
- Small-bodied indecision
- Bearish engulfing behavior
- Failed breakout
- Sustained closes above resistance
The candle reaction will determine whether price is accepting or rejecting the premium area.
4,700 — External Liquidity High
The 4,700 region represents the major external liquidity reference shown on the chart.
The previous high creates an obvious pool of buy-side liquidity.
If price approaches this level, a temporary wick above the high should not automatically be interpreted as a confirmed breakout.
A genuine structural breakout would require stronger candle acceptance and follow-through.
This is why the chart marks the area as a liquidity objective, rather than presenting it as a guaranteed destination.
Bullish Projection
The black projection on the chart represents a potential bullish expansion path.
The first important step is a reclaim of the 4,434 area.
If buyers establish acceptance above that level, the next structural area becomes 4,508.776.
A continued bullish expansion could then bring price toward the 4,632.225 premium supply region and eventually the 4,700 external liquidity high.
The scenario remains conditional on candle confirmation and market structure.
Alternative Reaction Scenario
If Gold fails to reclaim the upper resistance area and produces strong bearish displacement, the market could instead return toward the lower demand region.
The 4,257.637–4,223.546 area would then become important for evaluating buyer response.
A strong bullish rejection from this zone could preserve the recovery structure.
A decisive bearish close below the structural floor would weaken the bullish scenario and indicate that the market structure requires reassessment.
Candle-by-Candle Reading Framework
This chart demonstrates that candle analysis should always be performed in context.
A bullish candle at demand has a different meaning from a bullish candle directly underneath supply.
Likewise, a bearish candle inside a bullish trend may represent a normal retracement, while a bearish displacement candle breaking a protected higher low can signal a meaningful structural change.
The professional sequence is:
Candle Body → Wick → Closing Position → Previous High/Low → Liquidity → FVG → BOS/CHoCH → Follow-Through
The objective is not to predict every candle, but to understand how each candle contributes to the evolving market structure.
Complete Market Structure
The overall structure visible on this 4H Gold chart can be summarized as:
Accumulation → Liquidity Formation → Bullish Displacement → BOS → Bullish Expansion → External High → CHoCH → Bearish Displacement → BOS → Demand Reaction → Liquidity Formation → Bullish Recovery → Internal Reclaim → Potential Expansion
Key Educational Levels
4,700.000 — External Buy-Side Liquidity
4,632.225 — Premium Supply Boundary
4,508.776 — Major Expansion Level
4,434.397 — Internal Resistance
4,377.290 — Current Market Area
4,257.637 — Sell-Side Liquidity
4,223.546 — Structural Floor
4,066.622 — HTF Demand Anchor
The primary educational focus of this chart is the interaction between liquidity, displacement, imbalance and market structure. The bullish direction shown on the chart is a conditional scenario based on structural confirmation, not a guaranteed market outcome.
Educational Disclaimer: This chart is strictly for educational and informational purposes only and does not constitute financial, investment or trading advice. Market conditions can change rapidly, and no trade direction, breakout, target, support, resistance or price level is guaranteed. Always conduct your own analysis, wait for appropriate confirmation and apply proper risk management before making any trading decision. Long 
XAUUSDHello Traders! 👋
What are your thoughts on Gold?
Gold was recently rejected from the upper boundary of the ascending channel and the key $4,700 resistance zone, triggering a corrective move lower.
The correction pushed price toward the lower boundary of the ascending channel, where it also reached the important $4,200–$4,250 support zone. This area carries significant technical importance, as it coincides with the channel support and the 0.618 Fibonacci retracement around $4,245. Buyers reacted from this zone and managed to prevent further downside.
Gold has subsequently broken above the short-term descending trendline, suggesting that the corrective structure is losing momentum and that the broader bullish structure may gradually be resuming.
From here, we expect price to spend some time consolidating and fluctuating around the current levels. After this consolidation, Gold could potentially make a pullback toward the broken descending trendline.
Following the pullback, we expect buyers to step back into the market from the highlighted $4,200–$4,250 support zone, which, as mentioned above, remains an important area due to the confluence of the ascending channel support and the 0.618 Fibonacci retracement.
If price reacts positively from this support zone and buying pressure returns, the market could begin its next bullish leg. In this scenario, Gold could initially move toward the $4,600 area, followed by a retest of the major $4,680–$4,700 resistance zone.
On the upside, $4,600 represents an intermediate resistance, while the $4,680–$4,700 zone remains the key resistance area and the previous rejection point.
As long as Gold remains above the $4,200–$4,250 support zone, the broader bullish structure remains intact and the upside scenario continues to be technically valid.
However, a decisive break and daily close below the $4,200–$4,250 support zone would weaken the current bullish structure and could increase the probability of a deeper corrective move.
If you found this analysis helpful, please support it with a like and share your thoughts in the comments! Good luck with your trades!❤️ Long 
GOLD - The Hunt for Liquidity Ahead of a Decline ICMARKETS:XAUUSD continues to form a countertrend correction, driven by the decline in oil prices. The fundamental backdrop remains weak...
The dollar is stagnating after a strong rally triggered by the Fed’s hawkish stance and rising interest rates. However, the Dollar Index remains strong, which continues to put pressure on gold. At the same time, the decline in oil prices has given the metal some room to recover. The market remains highly dependent on geopolitical developments.
There is not much major news ahead next week, with the key focus on PMI data and Friday’s Durable Goods Orders. Technically, gold remains under pressure from the bearish trend
Resistance levels: 4,402, 4,434, 4,511
Support levels: 4,340, 4,250, 4,200
Gold is forming a countertrend correction. The dollar remains strong, while the fundamental backdrop is unfavorable for gold due to the Fed’s hawkish stance and rising interest rates.
Technically, the key focus is on two triggers: 4,402–4,434. A short squeeze could trigger a decline toward 4,340–4,250
Best regards,
R. Linda! Short 
 Education
XAUUSD — Weekly Wave 5 Lower Toward 4,060
From Kelly’s view, gold enters next week inside a broader bearish corrective structure. Price is currently trading around 4,378, after recovering from the 4,240–4,250 area, but the rebound is still developing beneath a descending channel and an important sell zone around 4,390–4,410.
The key idea is simple: the current recovery may represent a corrective Wave (4), while the main weekly scenario remains a continuation lower into Wave (5) if sellers defend the upper resistance zone.
⟡ Market structure
Gold remains inside a descending structure after the major peak near 4,680. Recent rebounds have continued to form below important resistance, while the descending channel is still controlling the broader direction.
The current recovery from around 4,240 has pushed price back toward the 4,390–4,410 sell zone, where Fibonacci resistance and the projected Wave (4) completion area overlap.
For next week, 4,334 is the first important support. A clean break below this level could confirm renewed bearish momentum and expose the 4,240–4,255 area.
If that support also fails, the larger Wave (5) projection points toward the 4,045–4,075 zone.
➤ Key levels
◌ Current price area: 4,375–4,385
◌ Main sell zone: 4,390–4,410
◌ Strong resistance: 4,410–4,430
◌ Strong support: 4,334
◌ Secondary support: 4,240–4,255
◌ First target: 4,334
◌ Second target: 4,240–4,255
◌ Main target: 4,045–4,075
◌ Invalidation: Above 4,430
⌁ Elliott Wave view
Wave (1): The first bearish leg pushed price lower from the previous recovery high.
Wave (2): Gold produced a corrective rebound before sellers regained control.
Wave (3): The stronger bearish impulse extended toward the 4,240 area.
Wave (4): The current rebound may be completing near 4,390–4,410, where the descending channel and Fibonacci resistance overlap.
Wave (5): If sellers reject this zone, the final bearish leg could develop toward 4,240 first, followed by the larger 4,045–4,075 target area.
▸ Trading scenario
Preferred bearish scenario
Entry: 4,390–4,410 after bearish confirmation
Stop Loss: Above 4,430
Take Profit 1: 4,334
Take Profit 2: 4,240–4,255
Take Profit 3: 4,045–4,075
The cleaner plan is to wait for rejection from the sell zone rather than chase price lower around current levels. A bearish reaction near 4,390–4,410, followed by a break below 4,334, would strengthen the Wave (5) scenario.
Alternative scenario:
If gold breaks above 4,410–4,430 and holds above the descending structure, the bearish Wave (5) setup may be delayed and price could extend toward the next higher resistance before sellers regain control.
◌ Invalidation
The main bearish scenario would weaken if price gains sustained acceptance above 4,410, and a confirmed break above 4,430 would invalidate the preferred Wave (5) structure for next week.
⌁ Kelly’s view
Kelly’s main view remains bearish for next week while gold stays below 4,390–4,430.
The current rebound may still have room to test the sell zone, but the broader structure favors another bearish leg if sellers defend resistance. 4,334 is the first confirmation level, while 4,240–4,255 remains the next major support before the larger 4,045–4,075 Wave (5) target comes into focus.
Do you think gold will reject the 4,390–4,410 sell zone first, or break 4,334 directly next week? Short 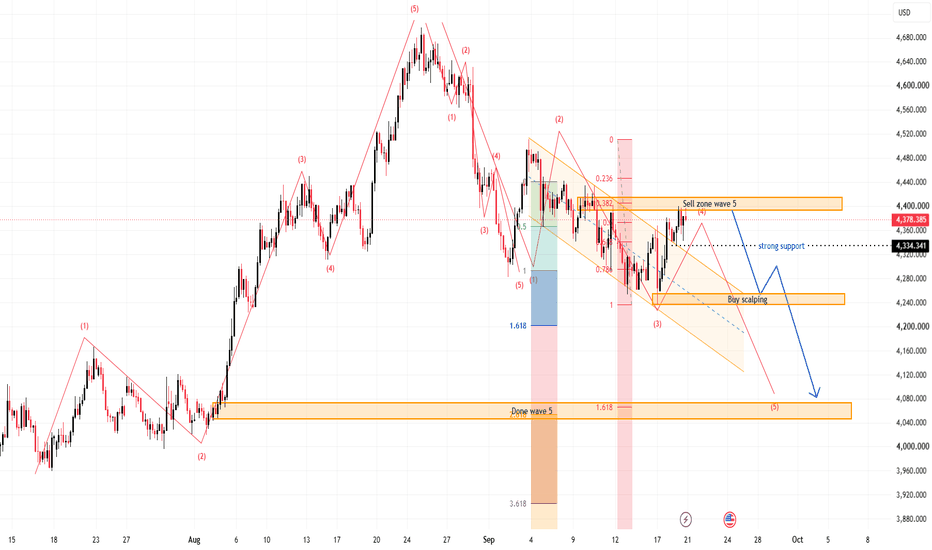
XAUUSD: Bullish Structure & FVG Continuation SetupThis analysis focuses on the current market structure, liquidity behavior, Fair Value Gaps (FVGs), and the developing bullish trend-line structure.
Price has recently shown a bullish Change of Character (CHoCH) and Break of Structure (BOS), suggesting that buyers have gained short-term structural control. The marked FVG areas can act as potential reaction zones if price retraces into them.
Key areas to monitor:
Current area: Around 4,377
First potential objective: Around 4,435
Main marked target: Around 4,435
Bullish OB: Approximately 4,260–4,275
Multiple FVGs below price may provide potential support/reaction areas.
The chart illustrates a bullish continuation scenario, but the projected path is not guaranteed. A sustained move above nearby structure would provide stronger confirmation, while a decisive break below the relevant bullish structure could invalidate or weaken the setup.
Guidance & Risk Management
Use the marked levels as areas of interest rather than guaranteed entry or target points. Wait for price action confirmation before making any trading decision. Consider position sizing, stop-loss placement, risk-to-reward, and overall market conditions before taking a position. Never risk more than you can afford to lose.
This publication is for technical analysis and educational purposes only, not financial or investment advice.
This format emphasizes reasoning and avoids promotional or guaranteed-profit language, consistent with TradingView's current House Rules and publishing guidance. Long 
Gold Technical Analysis: Sellers Defend 4,400 Resistance ZoneHello traders! Here’s my technical outlook based on the current XAUUSD (4H) chart structure. XAUUSD previously traded inside a range before breaking higher and later forming a descending structure after turning around from the highs. Price then tested the 4,400 Seller Zone multiple times, where sellers rejected the upside. Currently, XAUUSD is trading below the 4,400 Seller Zone while holding above the 4,280 Buyer Zone and Support Line. The recent rejection from resistance suggests a possible continuation lower toward support. As long as XAUUSD remains below the 4,400 Seller Zone and respects the descending channel, the bearish scenario remains valid. A continuation lower could push price toward the 4,280 Buyer Zone (TP1). However, a breakout and close above 4,400 would weaken the bearish outlook and increase the possibility of further upside. Please share this idea with your friends and click "Boost" 🚀 Short 
XAUUSD Support Resistance Explained Complete Trading Education
XAUUSD Support & Resistance Explained | Complete Trading Education Guide
This educational XAUUSD H4 chart explains how Support and Resistance work and how traders can study price action, rejection candles, breakouts, pullbacks, and market structure step by step.
The purpose of this chart is to understand why price reacts at important levels, rather than simply predicting whether price will go up or down.
Candle-by-Candle Price Action Explanation
1. First Bullish Candles — Buyers Enter the Market
The initial bullish candles show that buyers are gradually gaining control. Price starts creating higher highs and higher lows. The reason for this movement is increasing buying pressure after price reacts from the lower support area.
2. Support Reaction Candles — Buyers Defend the Zone
When price reaches the green Key Support Zone, several candles show rejection from the lower prices. These candles are important because sellers are unable to push price strongly below the zone. The reason for the reaction is that buying pressure becomes stronger around support.
3. Bullish Continuation — Higher Highs Form
After support holds, consecutive bullish candles push price upward. The formation of higher highs and higher lows indicates improving bullish structure. This is an important lesson: support is not simply a line; it is an area where price may react.
4. First Resistance Reaction — Selling Pressure Appears
Price eventually reaches the red Resistance Zone. The candle wicks and bearish reaction show that sellers are becoming active. The reason is that previous highs can attract selling pressure and liquidity.
5. Rejection From Resistance — Price Moves Lower
After touching resistance, bearish candles begin to appear. This shows that buyers are losing short-term control while sellers push price away from the resistance area.
6. Pullback Candles — Market Corrects
The bearish movement continues as price moves away from resistance. This is a pullback rather than automatically a complete trend reversal. Traders should study the structure instead of assuming every bearish candle means a full reversal.
7. Second Support Reaction — Buyers Return
Price reaches the green support zone again and produces another reaction. The reason is that buyers defend the area, while sellers struggle to maintain downward momentum.
8. Bullish Recovery — Buyers Regain Control
Bullish candles begin forming from support and price starts moving upward again. Higher lows provide evidence that buyers are becoming stronger.
9. Previous Resistance Is Tested Again
Price returns toward the previous resistance level. This is an important area because traders can observe whether price will reject again or finally break through the level.
10. Resistance Breakout — Strong Bullish Candles
A strong bullish candle breaks above the resistance area. The reason this candle is important is that buyers have pushed price through a level where sellers previously reacted.
11. Pullback / Retest — Resistance Turns Into Support
After the breakout, price pulls back toward the previous resistance. This area is marked as a Pullback / Retest Zone. A successful retest can show that the previous resistance is beginning to act as support.
12. Continuation Candles — Higher Highs
After the retest, bullish candles continue higher and price creates new highs. This demonstrates the concept of Resistance → Breakout → Retest → Continuation.
Key Support & Resistance Lessons
Support: A price zone where buying pressure may become strong enough to slow or stop a downward move.
Resistance: A price zone where selling pressure may become strong enough to slow or stop an upward move.
Important: Support and resistance are generally zones, not exact single-price lines. Price can move slightly above or below a level before reacting.
What Traders Should Watch
Previous highs and lows
Rejection candles and wicks
Strong bullish or bearish candles
Break of Structure (BOS)
Breakout confirmation
Pullback and retest
Support becoming resistance
Resistance becoming support
Higher highs and higher lows
Lower highs and lower lows
The main lesson is to wait for price confirmation instead of predicting every candle. A single candle should be studied together with its location, previous market structure, support/resistance zone, and the candles around it.
Market Education Academy — Learn • Analyze • Trade
Educational content only. This chart is created for learning technical analysis and market structure. It is not financial advice or a guaranteed trading signal. Always perform your own analysis and manage risk carefully. TRADING PSYCHOLOGY | THE DISCIPLINE BEHIND CONSISTENT EXECUTIONTrading psychology is a critical part of consistent execution. This educational framework highlights how hope, confidence, greed, fear, panic, and frustration can influence trading decisions, while emphasizing discipline, patience, emotional control, risk management, and following a defined trading plan. The goal is to focus on process, wait for quality setups, manage risk responsibly, learn from mistakes, and maintain consistency rather than reacting emotionally to short-term market movements. Education 
 Long
Long
BITCOIN: Huge Cycle Expansion, Historical Signal Flashed!Hello Community,
welcome to my new analysis of Bitcoin from a global timeframe perspective. BITCOIN is a major, significantly transformative asset which completed several historical expansion cycles with significant impact on the financial system. We have always witnessed how BITCOIN critics stated it would go to zero, while it could lead the next major bullish expansion.
In my chart, we can see how BITCOIN always perfectly follows the historical cycle expansion, which sets a new bullish paradigm. It always consists of the descending triangle formation, the bounce within the 50-EMA, a simultaneous bounce within the RSI, and a massive upward expansion that matches the halving cycle expansion.
At the moment, BITCOIN is just boiling up to complete the fifth major descending triangle formation breakout, as it is marked on my chart, while the historical RSI bounce has been confirmed for a fifth time in a row. Considering a breakout and continuous bullish expansion to the upside, BITCOIN will accelerate these bullish dynamics once the next fifth historical halving has been completed.
In this manner, thank you a lot for watching!
The support is highly appreciated.
VP GOLD MARKET ANALYSIS — XAUUSDGold is currently trading near the 4,378 area after recovering strongly from the lower support zone. The recent price action shows a liquidity sweep followed by a bullish recovery, with price continuing to form higher lows along the short-term bullish trend line.
The 4,340–4,360 region is now an important near-term support area. As long as price maintains this zone and continues holding above the bullish structure, buyers may attempt another move toward the upper resistance area.
📈 BULLISH SCENARIO — RECOVERY & CONTINUATION
If Gold holds above 4,340–4,360 and breaks the 4,380–4,400 resistance zone with strong momentum, the next upside areas to watch are:
TP1: 4,400
TP2: 4,420
TP3: Above 4,420
A clean breakout and hold above 4,400 could strengthen the continuation structure and bring higher levels into focus.
📉 BEARISH SCENARIO — REJECTION & PULLBACK
If Gold fails to break the 4,380–4,400 resistance area and sellers regain control, price could retrace toward the nearby support.
Support 1: 4,360
Support 2: 4,340
Support 3: 4,300–4,320
A sustained break below 4,340 would weaken the current recovery structure and could expose the lower 4,300–4,320 demand/support zone.
🔎 MARKET VIEW
The short-term structure remains mixed around resistance, so the reaction from 4,380–4,400 is important. Buyers need a confirmed breakout for further upside, while rejection could trigger a pullback toward 4,340 and 4,300–4,320.
your support means a lot! If you found this analysis useful, leave a Like and tell me your thoughts in the comments. Best of luck with your trading journey! 🚀 Long 
Long 
BITCOIN - A strong market. Retest of resistance BINANCE:BTCUSDT.P is maintaining its local bullish trend, while the five-week consolidation following the strong rally — during which the coin broke its medium-term bearish trend — points to underlying market strength
After breaking the trend and staging a strong rally, Bitcoin has been consolidating for five weeks. Negative news failed to trigger a decline, while the long squeeze became a technical catalyst for further upside.
The coin continues to confirm its bullish market structure. The breakout of the wedge resistance, which marks the consolidation boundary, is triggering another retest of key resistance. The main focus is on 82,300–82,800. A close above this zone could accelerate the move toward 86K
Resistance levels: 82,300, 82,850, 86,000
Support levels: 80,500, 80,000
A retest of the 82,800 resistance could trigger a correction, but if the market manages to hold the local pullback within the current range, this would provide another confirmation of the market’s readiness for a rally. A close above 83,000 could become a technical catalyst for further upside toward 86K–100K
Best regards,
R. Linda! Long 
Gold at $4,400: Breakout or Rejection?TVC:XAU Update
#Gold is compressing below a major descending trendline resistance.
Price is currently around $4,378, with the trendline coming in around $4,390–$4,400. We’ve already seen multiple rejections from this area, so this is an important level to watch.
The bigger resistance zone is around $4,400–$4,416, while the key downside level is $4,308.
RSI is around 63, showing that momentum has recovered, but it’s not yet in an extreme overbought zone.
If gold breaks and closes above $4,416, the bearish structure could start weakening.
But if price gets rejected from the trendline again, a move toward $4,308 looks possible, with the $4,270–$4,290 zone acting as the next major support.
Short 
Gold Technical Analysis | Upside & Downside Liquidity TargetsXAUUSD 4H — Market Structure, Retest & Liquidity Analysis
Gold is trading around 4,377 on the 4H chart. The current structure shows a period of consolidation after the previous bullish expansion, with price now approaching a key retest/resistance area around 4,402–4,450. The chart also highlights potential upside and downside liquidity targets.
🔹 1. Initial Bullish Expansion
The left side of the chart shows a strong sequence of bullish candles. Price consistently formed higher highs and higher lows, indicating that buyers were controlling the short-term structure.
The BMS marked on the chart confirms a structural shift, while subsequent bullish candles continued the expansion. Pullbacks were relatively shallow, showing that buyers were willing to defend previous levels.
🔹 2. Momentum Toward the Highs
As price moved toward the 4,600–4,700 region, several consecutive bullish candles pushed the market higher.
The reason for this move, from a price-action perspective, was the continuation of the bullish structure and successful breaks of previous swing highs. However, after reaching the upper area, momentum began to weaken.
🔹 3. Bearish Structure Shift
Near the late-August high, price started producing smaller candles and repeated rejection wicks. This indicated that bullish momentum was losing strength.
The following strong bearish candles broke important swing levels, creating a CHoCH/BMS-type structural shift. This was followed by further downside movement as sellers gained control.
🔹 4. September Selling Pressure
During the next phase, bearish candles dominated several sections of the chart. Price repeatedly failed to maintain higher highs and started creating lower highs.
The reason for these declines was the continued bearish structure combined with rejection from higher levels. Every failed attempt to reclaim the previous resistance allowed sellers to push price toward lower liquidity.
🔹 5. Mid-Range Consolidation
Around the 4,300–4,450 region, price entered a more compressed range. Candles became smaller and alternated between bullish and bearish closes.
This indicates a temporary balance between buyers and sellers. The BMS visible around this region suggests that short-term structure was attempting to shift, but confirmation remains important.
🔹 6. Current Price Action
The latest candles show price recovering from the lower area and moving back toward 4,400+.
However, price is approaching the marked RETEST BEFORE ENTRY region. This means the area should be treated as a confirmation zone rather than an automatic entry point.
A strong rejection could indicate renewed selling pressure, while a confirmed breakout followed by a successful retest could change the short-term structure.
🎯 Important Levels
4,402–4,450 → Key resistance / retest area
4,444.92 → Upper range
4,234.68 → Lower range
4,318–4,345 → Nearby support/liquidity area
4,103.49 → Downside liquidity target
4,682–4,722 → Potential upside target region
📈 Bullish Scenario
If price breaks and closes above the 4,402–4,450 resistance area, then holds the level on a retest, the next upside liquidity/target area marked on the chart becomes relevant.
Confirmation through BMS/CHoCH + retest would provide stronger technical evidence than entering on the initial breakout candle.
📉 Bearish Scenario
If price rejects the resistance/retest area and breaks below the nearby support structure, downside liquidity could become the focus.
A sustained move below the lower range would increase attention toward the 4,103 area shown on the chart.
Risk Management
This analysis represents technical scenarios based on the displayed 4H structure. It is not a guaranteed signal. Avoid entering solely because price touches a level; wait for confirmation, define invalidation beforehand, and use appropriate position sizing.
Educational approach: individual candles do not have a guaranteed single “reason.” Their interpretation comes from their close, wick, surrounding structure, liquidity and location within the trend. Short 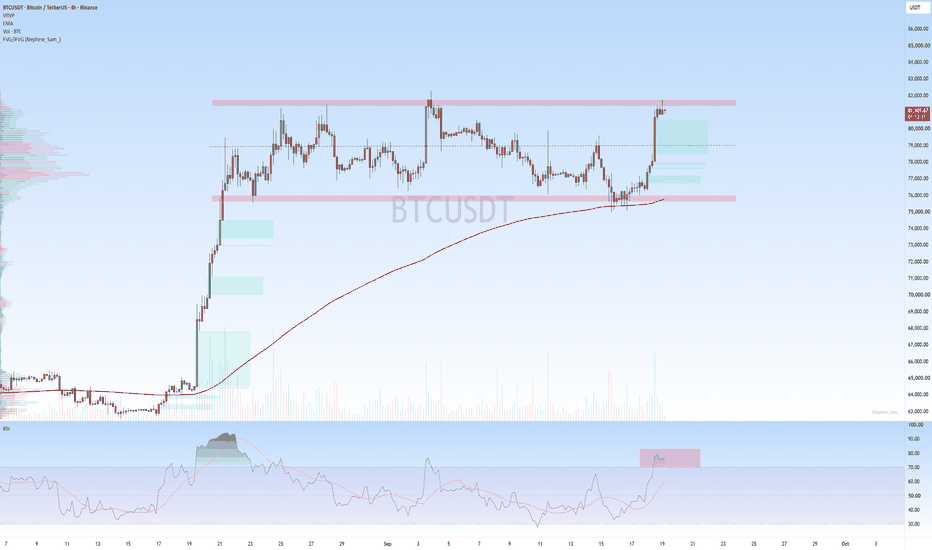
 Long
Long


