Long
Long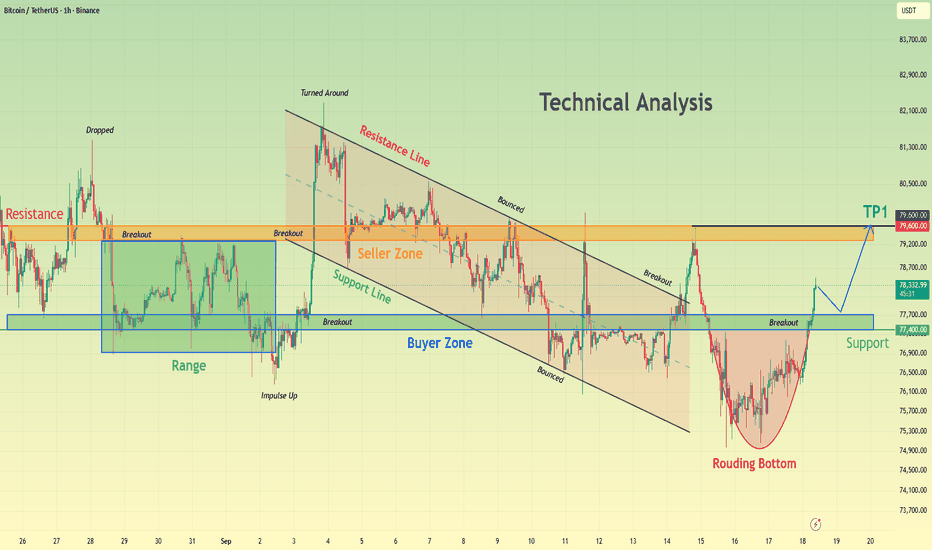
Short 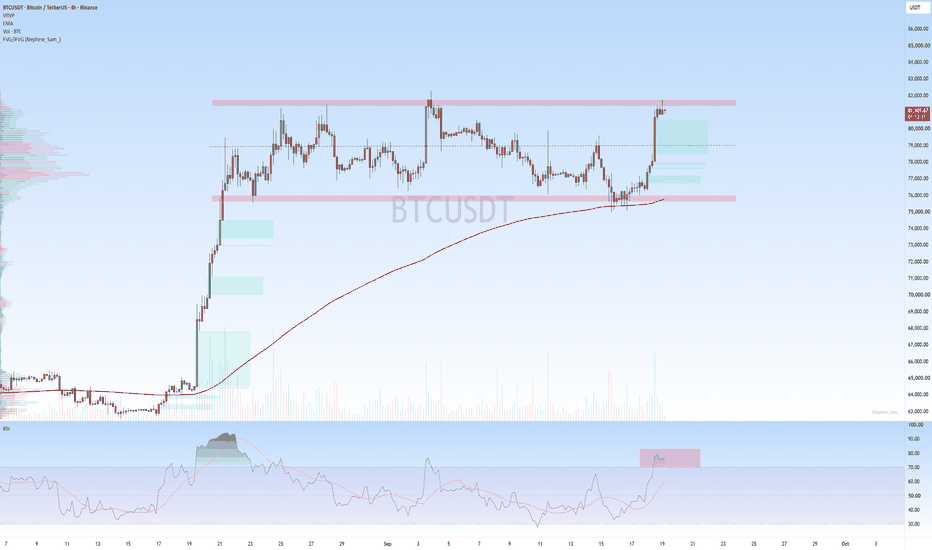
Gold Technical Analysis | Upside & Downside Liquidity TargetsXAUUSD 4H — Market Structure, Retest & Liquidity Analysis
Gold is trading around 4,377 on the 4H chart. The current structure shows a period of consolidation after the previous bullish expansion, with price now approaching a key retest/resistance area around 4,402–4,450. The chart also highlights potential upside and downside liquidity targets.
🔹 1. Initial Bullish Expansion
The left side of the chart shows a strong sequence of bullish candles. Price consistently formed higher highs and higher lows, indicating that buyers were controlling the short-term structure.
The BMS marked on the chart confirms a structural shift, while subsequent bullish candles continued the expansion. Pullbacks were relatively shallow, showing that buyers were willing to defend previous levels.
🔹 2. Momentum Toward the Highs
As price moved toward the 4,600–4,700 region, several consecutive bullish candles pushed the market higher.
The reason for this move, from a price-action perspective, was the continuation of the bullish structure and successful breaks of previous swing highs. However, after reaching the upper area, momentum began to weaken.
🔹 3. Bearish Structure Shift
Near the late-August high, price started producing smaller candles and repeated rejection wicks. This indicated that bullish momentum was losing strength.
The following strong bearish candles broke important swing levels, creating a CHoCH/BMS-type structural shift. This was followed by further downside movement as sellers gained control.
🔹 4. September Selling Pressure
During the next phase, bearish candles dominated several sections of the chart. Price repeatedly failed to maintain higher highs and started creating lower highs.
The reason for these declines was the continued bearish structure combined with rejection from higher levels. Every failed attempt to reclaim the previous resistance allowed sellers to push price toward lower liquidity.
🔹 5. Mid-Range Consolidation
Around the 4,300–4,450 region, price entered a more compressed range. Candles became smaller and alternated between bullish and bearish closes.
This indicates a temporary balance between buyers and sellers. The BMS visible around this region suggests that short-term structure was attempting to shift, but confirmation remains important.
🔹 6. Current Price Action
The latest candles show price recovering from the lower area and moving back toward 4,400+.
However, price is approaching the marked RETEST BEFORE ENTRY region. This means the area should be treated as a confirmation zone rather than an automatic entry point.
A strong rejection could indicate renewed selling pressure, while a confirmed breakout followed by a successful retest could change the short-term structure.
🎯 Important Levels
4,402–4,450 → Key resistance / retest area
4,444.92 → Upper range
4,234.68 → Lower range
4,318–4,345 → Nearby support/liquidity area
4,103.49 → Downside liquidity target
4,682–4,722 → Potential upside target region
📈 Bullish Scenario
If price breaks and closes above the 4,402–4,450 resistance area, then holds the level on a retest, the next upside liquidity/target area marked on the chart becomes relevant.
Confirmation through BMS/CHoCH + retest would provide stronger technical evidence than entering on the initial breakout candle.
📉 Bearish Scenario
If price rejects the resistance/retest area and breaks below the nearby support structure, downside liquidity could become the focus.
A sustained move below the lower range would increase attention toward the 4,103 area shown on the chart.
Risk Management
This analysis represents technical scenarios based on the displayed 4H structure. It is not a guaranteed signal. Avoid entering solely because price touches a level; wait for confirmation, define invalidation beforehand, and use appropriate position sizing.
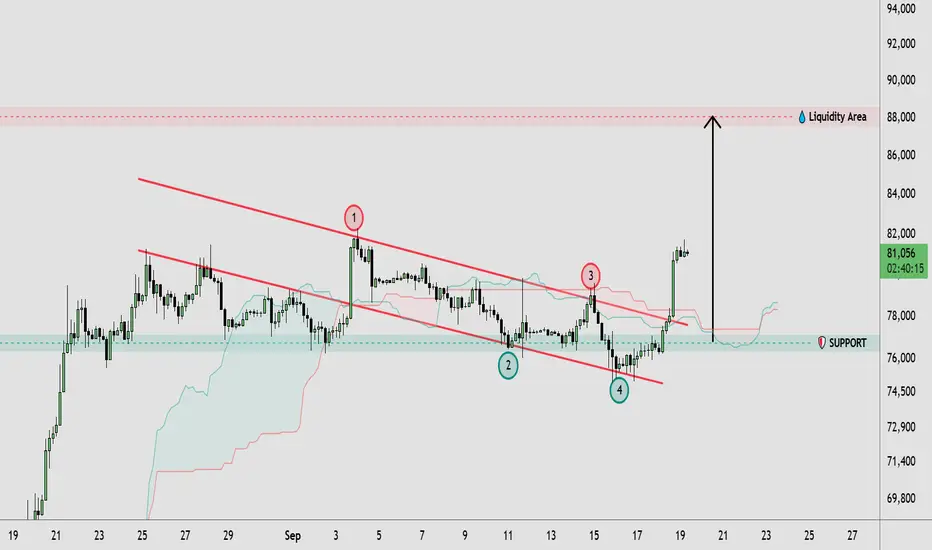
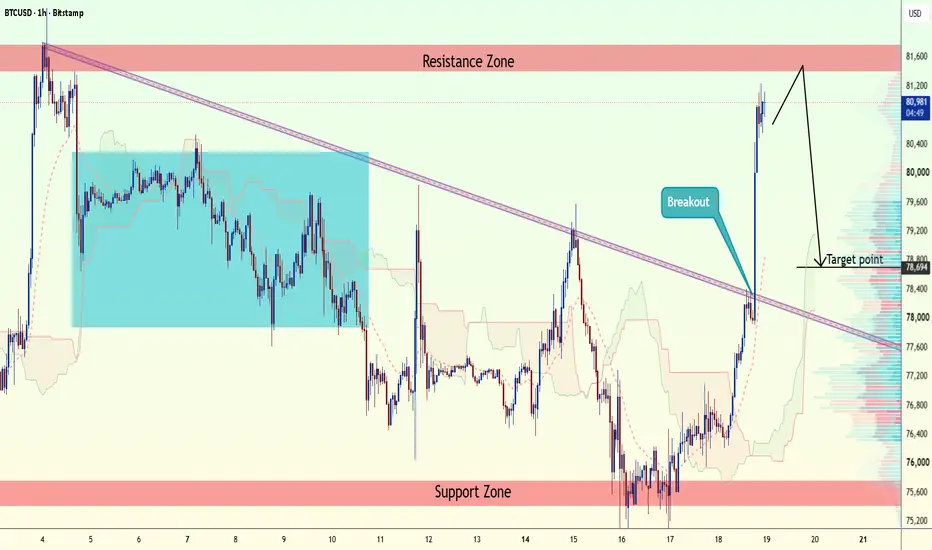
Educational approach: individual candles do not have a guaranteed single “reason.” Their interpretation comes from their close, wick, surrounding structure, liquidity and location within the trend. BTCUSD Breaks Descending Channel | 88K Liquidity in Focus🔹 BTCUSD has broken above the descending channel structure after multiple tests of its upper boundary, suggesting a shift in short-term price action. Price is currently holding around the 81,000 area after a strong bullish expansion from the 76,000–77,000 support zone. The breakout places attention on the recent swing highs around 82,000, while the larger highlighted liquidity area near 88,000 remains an important resistance region. The previous channel structure and support zone continue to provide key areas for market structure analysis.
🔸 If BTCUSD maintains the breakout and holds above the former channel resistance, price could continue building toward higher liquidity, with the 88,000 area becoming a potential zone of interest. Traders may wait for price confirmation and a successful retest before considering any trade. If the breakout fails and price moves back below the 76,000–77,000 support area, the bullish structure could weaken and a deeper retracement might develop.
This analysis is for educational purposes only and does not constitute financial or investment advice. Always conduct your own research before making trading decisions. Long 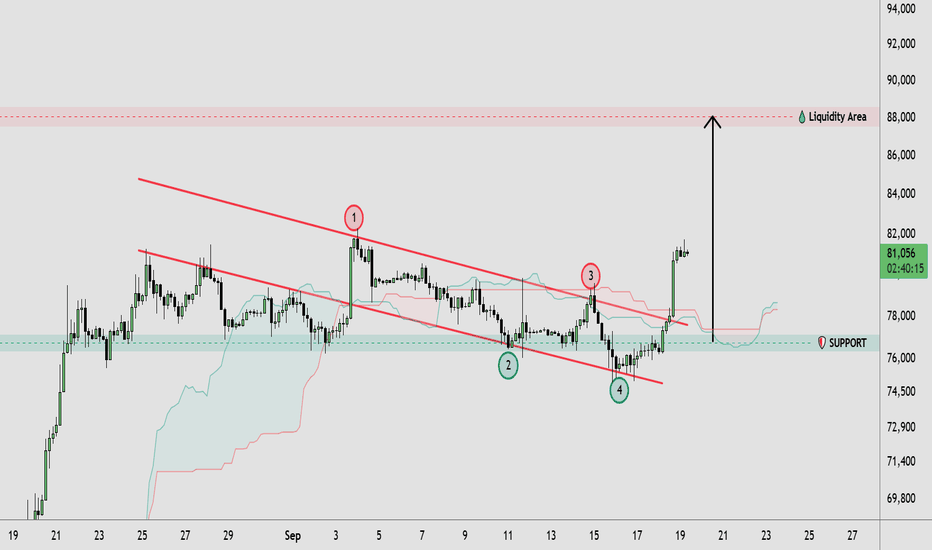
 Short
Short
 Short
Short
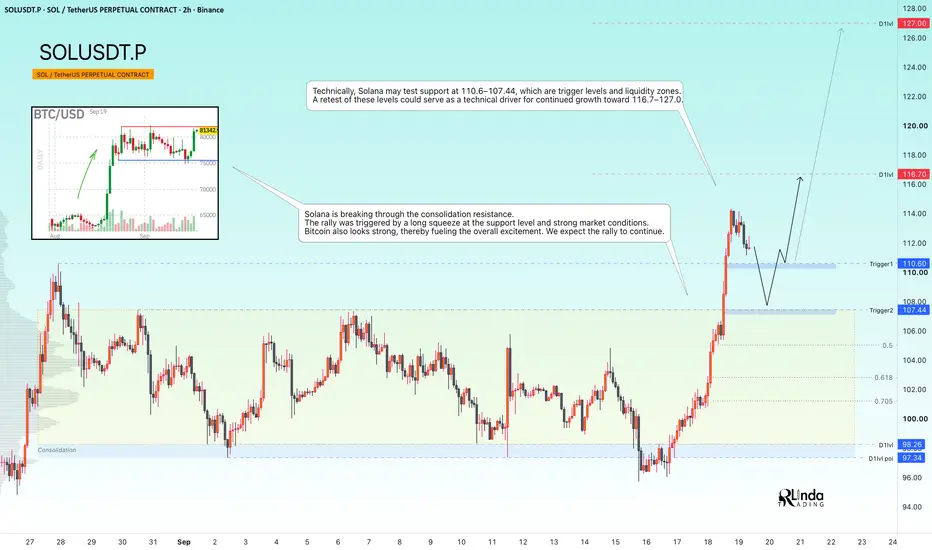
SOLUSDT - A hunt for liquidity ahead of the rally's continuationBINANCE:SOLUSDT confirms its bullish market structure. The long squeeze of support that we expected in the previous analysis played out perfectly. The bulls quickly took control of the situation and strengthened their positions...
Previously, we discussed how the market turned out to be stronger than expected: Bitcoin showed virtually no reaction to higher interest rates, the Fed’s hawkish stance, or the fact that the CLARITY Act was not passed. Consolidation continued, which further confirmed the strength of the market.
As for Solana, the altcoin is breaking through the consolidation resistance, suggesting that the coin is ready to continue its move higher. The rally was triggered by a long squeeze of support and the overall strength of the market
Resistance levels: 116.7, 127.0
Support levels: 110.6, 107. 44
Technically, Solana could retest the 110.6–107.44 support zone, which represents both key triggers and liquidity areas. A retest of these levels could become a technical catalyst for further upside toward 116.7–127.0
Best regards,
R. Linda!  Long
Long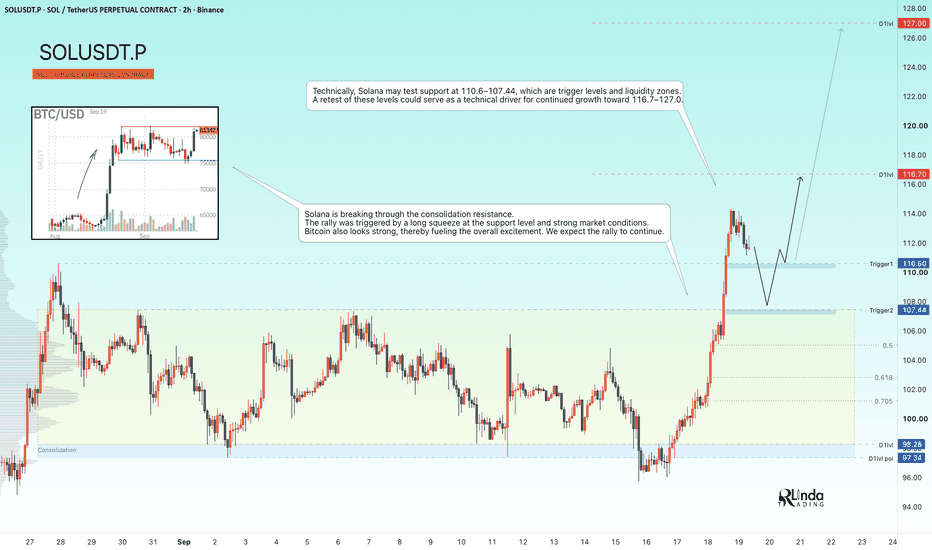
XAUUSD — Weekly Wave 5 Lower Toward 4,060
From Kelly’s view, gold enters next week inside a broader bearish corrective structure. Price is currently trading around 4,378, after recovering from the 4,240–4,250 area, but the rebound is still developing beneath a descending channel and an important sell zone around 4,390–4,410.
The key idea is simple: the current recovery may represent a corrective Wave (4), while the main weekly scenario remains a continuation lower into Wave (5) if sellers defend the upper resistance zone.
⟡ Market structure
Gold remains inside a descending structure after the major peak near 4,680. Recent rebounds have continued to form below important resistance, while the descending channel is still controlling the broader direction.
The current recovery from around 4,240 has pushed price back toward the 4,390–4,410 sell zone, where Fibonacci resistance and the projected Wave (4) completion area overlap.
For next week, 4,334 is the first important support. A clean break below this level could confirm renewed bearish momentum and expose the 4,240–4,255 area.
If that support also fails, the larger Wave (5) projection points toward the 4,045–4,075 zone.
➤ Key levels
◌ Current price area: 4,375–4,385
◌ Main sell zone: 4,390–4,410
◌ Strong resistance: 4,410–4,430
◌ Strong support: 4,334
◌ Secondary support: 4,240–4,255
◌ First target: 4,334
◌ Second target: 4,240–4,255
◌ Main target: 4,045–4,075
◌ Invalidation: Above 4,430
⌁ Elliott Wave view
Wave (1): The first bearish leg pushed price lower from the previous recovery high.
Wave (2): Gold produced a corrective rebound before sellers regained control.
Wave (3): The stronger bearish impulse extended toward the 4,240 area.
Wave (4): The current rebound may be completing near 4,390–4,410, where the descending channel and Fibonacci resistance overlap.
Wave (5): If sellers reject this zone, the final bearish leg could develop toward 4,240 first, followed by the larger 4,045–4,075 target area.
▸ Trading scenario
Preferred bearish scenario
Entry: 4,390–4,410 after bearish confirmation
Stop Loss: Above 4,430
Take Profit 1: 4,334
Take Profit 2: 4,240–4,255
Take Profit 3: 4,045–4,075
The cleaner plan is to wait for rejection from the sell zone rather than chase price lower around current levels. A bearish reaction near 4,390–4,410, followed by a break below 4,334, would strengthen the Wave (5) scenario.
Alternative scenario:
If gold breaks above 4,410–4,430 and holds above the descending structure, the bearish Wave (5) setup may be delayed and price could extend toward the next higher resistance before sellers regain control.
◌ Invalidation
The main bearish scenario would weaken if price gains sustained acceptance above 4,410, and a confirmed break above 4,430 would invalidate the preferred Wave (5) structure for next week.
⌁ Kelly’s view
Kelly’s main view remains bearish for next week while gold stays below 4,390–4,430.
The current rebound may still have room to test the sell zone, but the broader structure favors another bearish leg if sellers defend resistance. 4,334 is the first confirmation level, while 4,240–4,255 remains the next major support before the larger 4,045–4,075 Wave (5) target comes into focus.
Do you think gold will reject the 4,390–4,410 sell zone first, or break 4,334 directly next week?  Short
Short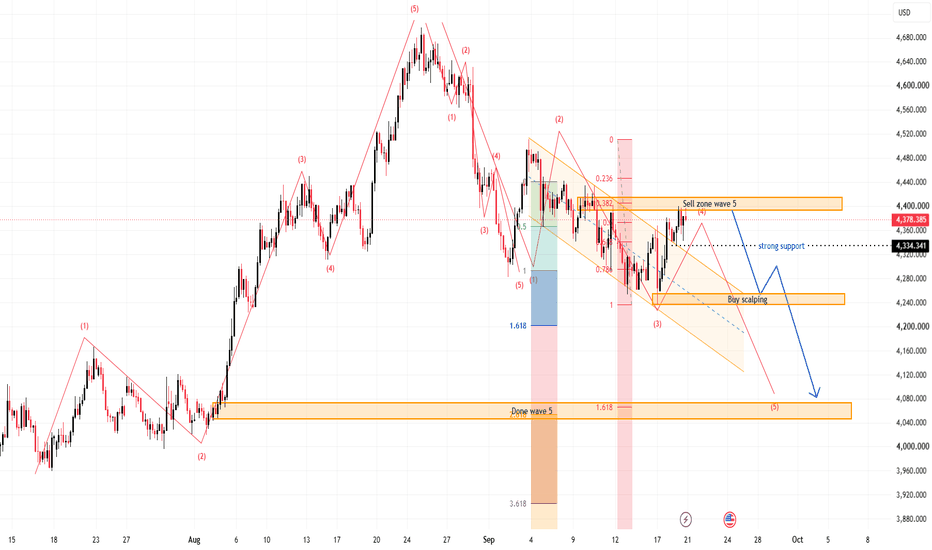
XAUUSD Weekly Outlook — Breakout Needs a Retest
Gold is sitting around 4,378 after breaking the H4 descending trendline.
The structure is improving, but price is now testing the 4,385–4,405 immediate resistance area.
The simple read
A pullback toward 4,290–4,320 would be the cleaner test for buyers.
If this zone holds, Gold may recover toward 4,400 first, followed by the major 4,485–4,510 resistance.
A clean break above 4,510 could later expose the H4 resistance around 4,630.
If 4,290 fails, the major swing support near 4,235 becomes important again.
Key price zones
4,385–4,405 — immediate resistance
4,290–4,320 — key pullback support
4,235 — major swing low
4,485–4,510 — major resistance
4,630 — H4 resistance
The trendline break is encouraging, but I prefer a retest before continuation.
Do not chase the breakout.
Wait for the zone.
Can buyers defend 4,30x and open the path toward 4,500? Long 
 Short
Short
Long 
#BTCUSDT LONG SET UP ALERT !#BTC
The price is moving within a bearish channel on the 1-hour timeframe; it has reached the lower boundary and appears poised for a rebound. A retest of this boundary is expected, supporting some upward movement.
The Relative Strength Index (RSI) indicates a bearish trend, but an upward breakout is likely due to oversold conditions on the 1-hour chart.
There is initial support at 74,960, acting as a primary support zone.
A key support zone (marked in green) exists at 72,769; the price has rebounded from this area multiple times, making it a strong support level.
The price is trending toward the 100-period moving average—a level we are currently approaching—which supports the case for a rise.
Entry Price: 80,365
Target 1: 81,262
Target 2: 82,446
Target 3: 83,800
Stop Loss: At the green resistance zone.
Remember this simple rule: Capital management.
If you have any questions, please leave a comment.
Thank you. Long 
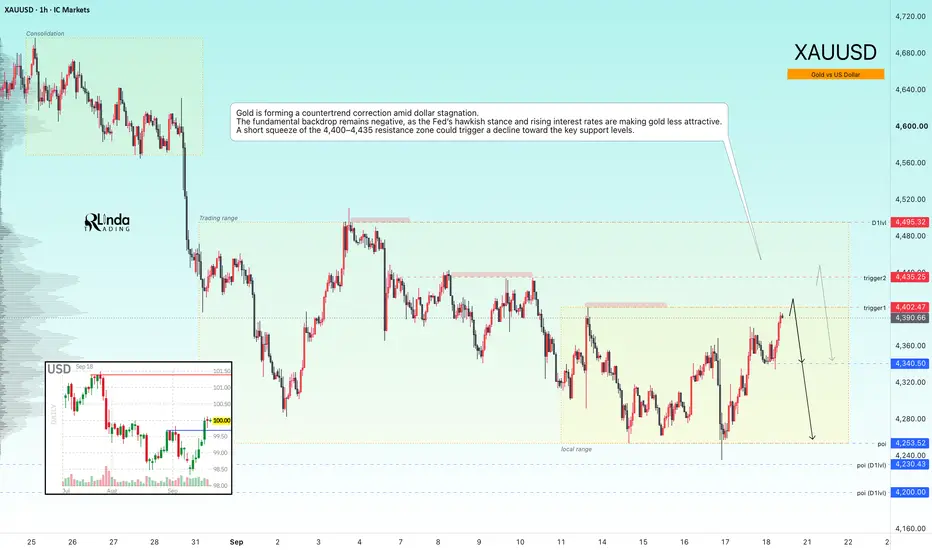
GOLD - A countertrend correction aimed at liquidity huntingICMARKETS:XAUUSD has been forming a countertrend correction toward the 4,400–4,430 liquidity zone since the session opened. The fundamental backdrop remains weak, and the market is still in a bearish trend
The dollar is stagnating after breaking through local resistance levels. The Fed’s hawkish stance and rising rates are supporting the Dollar Index, which is putting medium-term pressure on the metals market. However, the correction in oil prices is giving gold some room to recover as it tests key levels.
Gold is stabilizing, but further upside remains limited by the Fed’s hawkish outlook and geopolitical risks. The BOJ decision and developments in the Middle East will determine the short-term direction
Drivers:
Upside: further declines in oil prices and yields, de-escalation of the conflict, softer U.S. data, dovish BOJ.
Downside: escalation in the Middle East, higher oil prices, hawkish Fed stance, dollar strength
Resistance levels: 4,402, 4,435, 4,495
Support levels: 4,340, 4,253, 4,200
Gold is forming a countertrend correction amid dollar stagnation. A short squeeze of the 4,400–4,435 resistance zone — with the key focus on two triggers — could trigger a decline toward the key support levels. The formation of reversal patterns after the retest could provide a potential entry opportunity
Best regards,
R. Linda! Short 
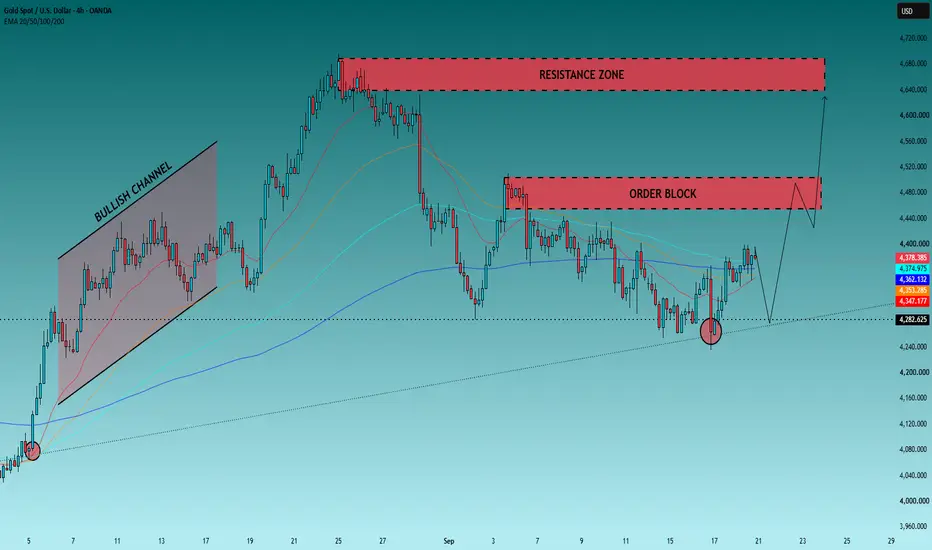
XAUUSD: The 4,282 Floor Could Decide Gold’s Next Big MoveGold is doing something interesting on this chart.
It is not breaking out.
It is not collapsing either.
Instead, price is rebuilding above a level that has already proved important — 4,282.
And that gives us a much cleaner way to trade the next move.
Forget trying to predict whether the next candle will be green or red. There are three doors on this chart:
4,282 → Survival
4,450–4,500 → Permission
4,630–4,680 → Destination
The trade depends on which door Gold opens first.
4,282 Is More Important Than It Looks
Look at the reaction around the recent low.
Gold pushed below the 4,282 area, tested the rising trendline and immediately recovered. Buyers did not simply defend the level — they forced price back toward the EMA cluster.
Price is now trading around 4,378, above the EMA 20/50/100/200 cluster shown on the chart.
That is constructive.
But I would not call Gold fully bullish yet.
Why?
Because buyers have recovered the middle of the battlefield, but they have not defeated the sellers waiting above.
The real problem starts around 4,450.
The Trap Is Between 4,400 and 4,450
This is where I think many traders could get caught.
A move above 4,400 will look bullish enough to attract breakout buyers.
But the major H4 Order Block sits roughly around 4,450–4,500.
That means buying blindly at 4,400 gives you very little information about whether Gold can actually break the important supply.
I want confirmation, not excitement.
BUY Scenario #1 — Buy the Pullback
I will consider a BUY if Gold pulls back toward 4,340–4,360, holds that area and then closes back above 4,380.
Entry: 4,375–4,385
SL: 4,335
TP1: 4,420
TP2: 4,455
TP3: 4,490
The idea is simple: the EMA cluster becomes support instead of resistance, giving buyers another attempt at the Order Block.
BUY Scenario #2 — Let Sellers Lose First
This is the setup I prefer for a larger bullish move.
Gold must break the 4,450–4,500 Order Block and produce a convincing H4 close above 4,500.
Then I want the breakout area to survive a retest.
Entry: 4,485–4,505 after confirmation
SL: 4,445
TP1: 4,560
TP2: 4,630
TP3: 4,680
Above 4,500, the chart changes considerably.
The next major destination becomes the upper 4,630–4,680 resistance zone, which is also where the previous major high was formed.
SELL Scenario — One Level Changes Everything
I am not interested in selling Gold simply because it reaches resistance.
The cleaner bearish trigger is 4,282.
If price returns there and we get an H4 close below 4,282, the recent recovery has failed and the rising trendline is no longer protecting buyers.
That would invalidate my bullish recovery thesis.
Entry: 4,275–4,285 on a failed retest from below
SL: 4,320
TP1: 4,240
TP2: 4,200
TP3: 4,160
There is also a more aggressive SELL opportunity at 4,450–4,500, but only if Gold reaches the Order Block and prints a clear rejection back below 4,440.
In that case:
Entry: 4,435–4,445
SL: 4,510
TP1: 4,380
TP2: 4,330
TP3: 4,285
My Map for Gold
Right now, I give buyers a slight advantage while price remains above 4,282 and the rising trendline.
But there is an important distinction:
4,282 keeps buyers alive.
4,500 puts buyers in control.
Until 4,500 breaks, the current rise is still a recovery into supply rather than a confirmed bullish continuation.
So I am not chasing Gold around 4,380.
I would rather buy a confirmed pullback, buy after sellers lose 4,500, or switch bearish if 4,282 finally gives way.
Three doors. Three completely different trades.
Which one do you think Gold opens first — 4,282 or 4,500? Long 
ETH/USD — Liquidity Sweep, CHoCH & Bullish Continuation🚀 ETH/USD — Liquidity Sweep, CHoCH & Bullish Continuation
📊 Market Structure
ETH/USD has shown a strong recovery from the 2,370–2,390 support area. After the downside move, buyers stepped in and price formed a clear bullish reaction, followed by an upward structure shift.
💧 Liquidity Zone
Price has now pushed into the marked 2,580–2,620 liquidity area, where previous price action suggests resting liquidity. This zone may produce short-term volatility or a pullback before the next directional move.
🔄 CHoCH Confirmation
The marked CHoCH around 2,535–2,545 indicates a shift from the previous bearish structure toward a more bullish intraday structure. Holding above this area keeps the bullish scenario technically supported.
📦 Key Zones
Liquidity: 2,580–2,620
FVG: 2,540–2,560
FVG: 2,520–2,540
Order Block: 2,500–2,520
Major Support: 2,370–2,390
🎯 Bullish Scenario
If price retraces into the FVG/Order Block area and buyers defend the zone, a continuation toward the upper liquidity and 2,650–2,680 region could be considered.
⚠️ Invalidation
A decisive break and sustained move below the 2,500–2,520 Order Block would weaken the current bullish structure and require reassessment.
🧠 Key Takeaway
The chart currently shows support reaction → CHoCH → strong upside displacement → liquidity test. The main focus is whether ETH can hold the marked FVG/OB zones during any pullback.
📌 Educational market analysis only. Wait for price confirmation and manage risk before taking any trade.  Long
Long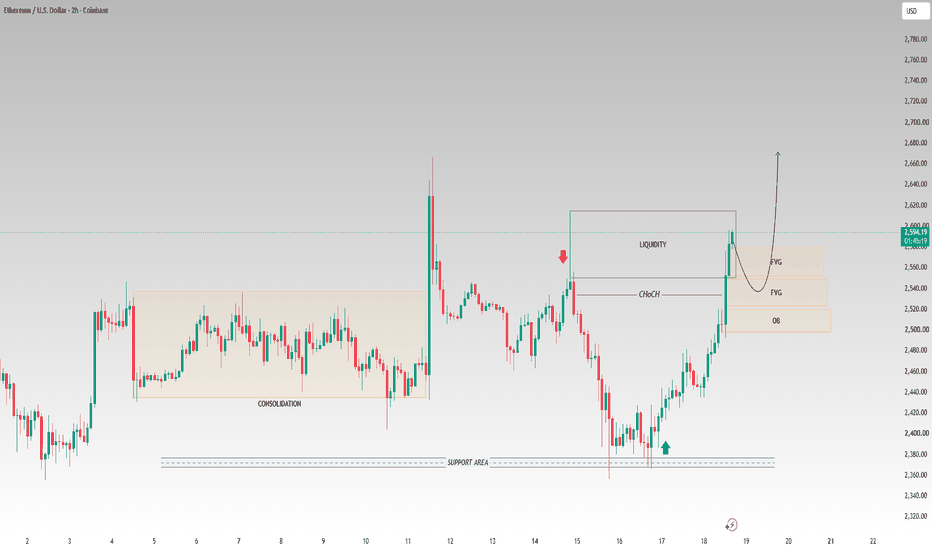
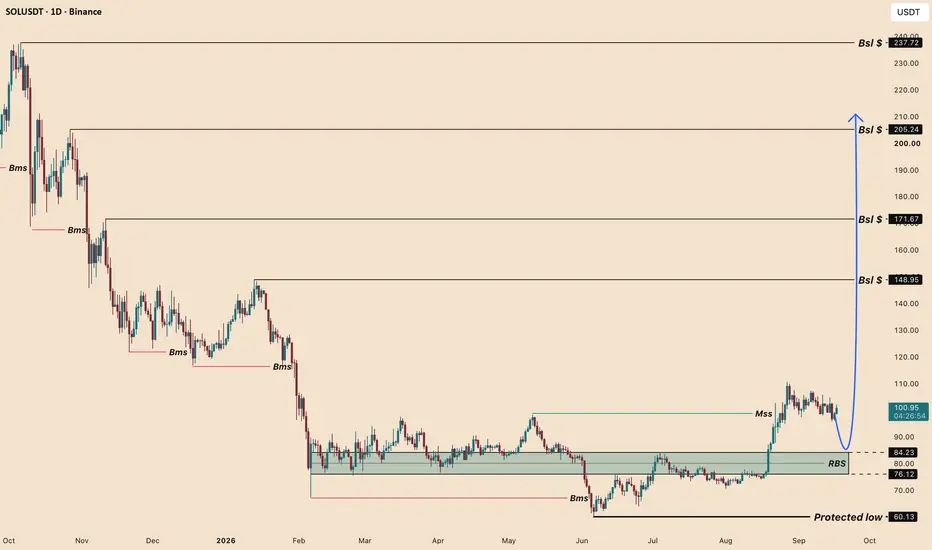
SOL | Structure Turned, Four Pools Sit AboveBy analyzing the #SOL (Solana) chart on the Daily timeframe, we can see a market that spent a year making lower lows, shifted structure upward in September, and now holds a discount zone beneath price with four untouched liquidity pools stacked above.
━━━━━━━━━━━━━━━━━━━━
DAILY TIMEFRAME
━━━━━━━━━━━━━━━━━━━━
The downtrend was relentless. From the October high at $237.72 price printed five separate BMS events on the way down — through October, November, December, February and again into June. Each consolidation that looked like a base became the next break.
The last of them bottomed at the Protected Low of $60.13 in June. From there price built for three months and then, in September, broke the May swing high with the MSS — the first upside structural break of the entire move. Price is now at $100.95 , holding above the break.
━━━━━━━━━━━━━━━━━━━━
THE LIQUIDITY ABOVE
━━━━━━━━━━━━━━━━━━━━
BSL 1 — $148.95
BSL 2 — $171.67
BSL 3 — $205.24
BSL 4 — $237.72
Four old highs, none revisited since they formed. A high that has never been defended isn't resistance, it's a target.
━━━━━━━━━━━━━━━━━━━━
THE BIAS
━━━━━━━━━━━━━━━━━━━━
Bullish for as long as price holds above the Protected Low at $60.13 .
━━━━━━━━━━━━━━━━━━━━
SCENARIO A — THE BASE CASE
━━━━━━━━━━━━━━━━━━━━
The entry is not here. The area worth waiting for is the RBS zone at $76.12 – $84.23 — the resistance that capped price from February through May, broken in September and now flipped to support. Price consolidated inside that band for seven months, which is what makes it the strongest demand on the chart rather than just a line.
A reaction from there targets $148.95 first, and above it the ladder opens.
━━━━━━━━━━━━━━━━━━━━
SCENARIO B — NO RETRACE
━━━━━━━━━━━━━━━━━━━━
Price never returns to the zone and continues directly from current levels. Same destination, worse price, and no defined risk — which is why this version is the one to watch rather than trade. The confirmation for a continuation entry is a daily close above $110.60 , the September swing high.
━━━━━━━━━━━━━━━━━━━━
INVALIDATION
━━━━━━━━━━━━━━━━━━━━
A daily close below the Protected Low at $60.13 . That is the origin of the shift, and beneath it the bullish structure is finished.
An earlier warning: a daily close below $76.12 with no reclaim means the RBS zone failed as support and the entry thesis is broken well before the structure is.
And the rule that governs all of it: a break is a candle close, not a wick. The RBS zone is where a wick beneath will look like failure — seven months of range-trading inside that band means stops sit on both sides of it, and that is exactly what a wick is built to collect.
━━━━━━━━━━━━━━━━━━━━
FUNDAMENTAL BACKDROP
━━━━━━━━━━━━━━━━━━━━
The network side is improving. Weekly network revenue rose to $45.35 million from $32 million , transactions climbed to 1.07 million , and the Transaction V1 upgrade lifted maximum transaction size to 4,096 bytes . Solana ETFs have now run an 11-week streak of positive inflows holding roughly $1.41 billion in assets.
The other side is real. Weekly ETF inflows collapsed 96% — from $153.87 million to $6.18 million — and trading volume halved from $699.39 million to $350.27 million . Much of the on-chain revenue is memecoin-driven, with Pump.fun at ~85% of launchpad activity, and that demand disappears faster than it arrives.
Strong network metrics, thinning institutional bid. That combination supports a retracement into discount far more than it supports chasing — which is exactly what the chart is already saying.
This analysis will be updated as the market evolves.
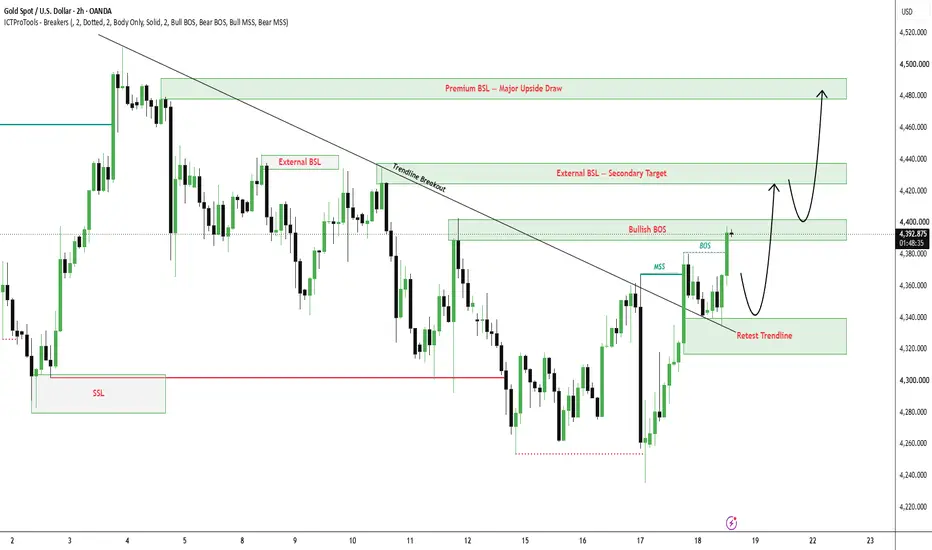
Best Regards, BigBeluga 🐳 XAUUSD — Trendline Breakout, Buy the RetestGold is trading around $4,394 after extending the post-FOMC recovery and breaking above the descending H1 trendline. The latest expansion has already produced a bullish BOS, showing that short-term order flow is shifting away from the previous bearish delivery structure.
The macro backdrop has also improved for Gold in the near term. Gold rebounded more than 2% on Thursday as the U.S. dollar and Treasury yields retreated from their post-Fed highs, while easing oil prices reduced some immediate inflation pressure. The U.S. 10-year yield has since stabilized near 4.94%, and Brent has eased toward $103–104. However, the Fed’s recent 25 bp hike and its signal that further tightening remains possible still limit the strength of the broader bullish case.
SMC View
The key technical development is the breakout above the descending trendline, followed by bullish BOS around the $4,390 area.
Buy-side liquidity around the previous internal highs has already been taken, confirming displacement through the former resistance structure. The cleaner continuation setup is therefore not to chase the current expansion, but to wait for price to retrace into the broken trendline and rebalance before looking for another bullish leg.
The $4,320–$4,340 Retest Trendline zone is the main bullish POI. If this area holds and produces a bullish MSS or CHOCH, the next liquidity draw sits above current price.
Main Trading Scenario
Buy Priority: $4,320–$4,340
Condition: Wait for Gold to retrace into the broken trendline / retest zone and show clear bullish rejection. A lower-timeframe bullish MSS or CHOCH should confirm that buyers are defending the new structure.
Entry: $4,320–$4,340 after confirmation
SL: Below $4,305 and the retest structure
TP1: $4,425–$4,440
TP2: $4,478–$4,495
Key Zones to Watch
$4,390–$4,400 — Bullish BOS / current resistance
$4,425–$4,440 — External BSL / secondary target
$4,478–$4,495 — Premium BSL / major upside draw
$4,320–$4,340 — Main trendline retest POI
Below $4,305 — Immediate bullish setup weakens
Prime Gold View
The H1 structure has improved materially after the trendline breakout and bullish BOS, but price is already trading close to short-term resistance.
The higher-quality buy remains a controlled retracement into $4,320–$4,340, followed by bullish confirmation. If buyers protect that structure, Gold could continue toward $4,425–$4,440 first, with the larger $4,478–$4,495 Premium BSL remaining the main upside liquidity objective.
No confirmation, no trade. Long 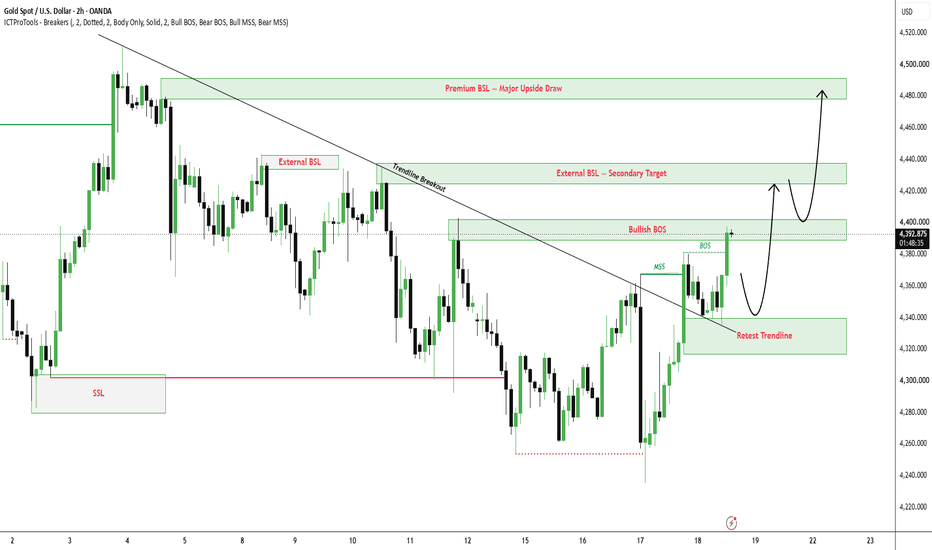
Weekly Outlook: Bullish Retest After Trendline BreakoutGold enters next week after posting its first weekly gain in four weeks, supported by easing oil prices and the unwinding of bearish positions built ahead of the Fed meeting. The Fed raised rates by 25 bp this week, but traders are now pricing roughly a 55% chance of another hike in October. Meanwhile, the U.S. dollar remains near a seven-week high and the 10-year Treasury yield is hovering around the critical 5% area, so the macro environment is still mixed for Gold.
Next week, attention shifts toward Fed speakers, U.S. PMI data and broader inflation signals. Oil remains above $100 and Middle East tensions are still an important source of volatility, while markets will also monitor the Trump–Xi meeting for potential shifts in global risk sentiment.
SMC View
The H1 chart is showing a meaningful structural improvement.
Price has broken the descending trendline, printed a bullish MSS followed by BOS, and is now consolidating beneath the $4,390–$4,400 bullish BOS area. This suggests bearish delivery has weakened and short-term order flow is beginning to reprice higher.
The cleaner continuation setup is not to chase current price. The $4,320–$4,340 trendline retest / FVG rebalance area remains the strongest discount POI for a potential continuation move.
If buyers defend this area and produce fresh bullish displacement, external buy-side liquidity above becomes the next logical draw.
Main Trading Scenario
Buy Priority: $4,320–$4,340
Condition: Wait for a controlled retracement into the broken trendline / FVG rebalance zone. A liquidity sweep followed by bullish rejection and a lower-timeframe MSS or CHOCH would provide confirmation.
Entry: $4,320–$4,340 after bullish confirmation
SL: Below $4,300 and the confirmed reaction structure
TP1: $4,390–$4,400
TP2: $4,424–$4,440
TP3: $4,445–$4,460
Key Zones to Watch
$4,390–$4,400 — Bullish BOS / immediate resistance
$4,424.395 — Decision POI
$4,425–$4,440 — External BSL / secondary target
$4,445–$4,460 — Premium BSL / major upside draw
$4,320–$4,340 — Main trendline retest / FVG POI
$4,295–$4,310 — Discount Demand
Below $4,295 — Bullish continuation structure weakens
The weekly bias remains Buy, but the preferred approach is to wait for discount rather than chase price beneath resistance.
A retracement into $4,320–$4,340 followed by bullish confirmation would keep the breakout structure constructive and could reopen delivery toward $4,400, then the external liquidity around $4,425–$4,440. If bullish momentum persists, the $4,445–$4,460 Premium BSL remains the larger upside objective.
No confirmation, no trade. Long 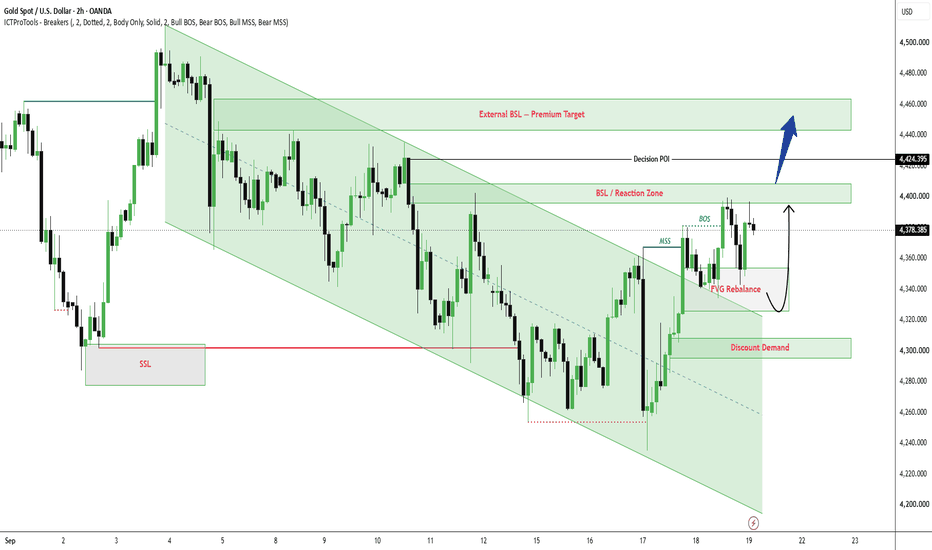
Long
Short