BTC Rejected at Key Resistance — Downside Toward 62KHello traders! Here’s my technical outlook based on the current BTCUSDT (3H) chart structure. BTCUSDT previously recovered from the 57,800 Support Zone and formed a Double Bottom, leading to a strong bullish move into a broad consolidation range. Price later broke above the range and rallied toward the 65,000 Seller Zone, where sellers stepped in and pushed price lower. Currently, BTCUSDT is trading below the 65,000 Seller Zone while holding above the 62,000 Buyer Zone and the descending support line. The latest rejection from resistance suggests that sellers remain active. As long as BTCUSDT remains below the 65,000 Seller Zone and respects the descending resistance line, the bearish scenario remains valid. A continuation lower could push price toward the 62,000 Support Zone (TP1). However, a breakout above 65,000 and the descending trendline would weaken the bearish outlook and favor further upside. Please share this idea with your friends and click "Boost" 🚀  Short
Short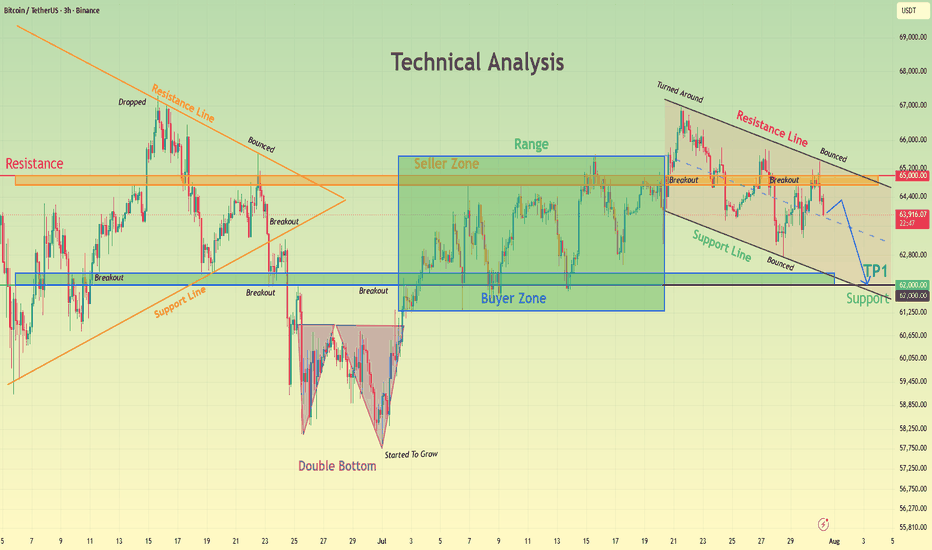
XAUUSD: Sellers Defend Trendline as 4,000 Becomes Next TargetHello everyone, here is my breakdown of the current XAUUSD setup.
Market Analysis
XAUUSD previously traded below a long-term descending trendline before breaking beneath triangle support, confirming bearish momentum. After the decline, price entered a broad consolidation range and later formed a descending channel. Although buyers managed to break above the channel, the recovery stalled near the 4,120 Resistance Zone, where a false breakout signaled renewed selling pressure.
Currently, XAUUSD is trading above the 4,000 Support Zone while remaining below the 4,120 Resistance Zone and the long-term descending trendline. Price is testing resistance again, where the next rejection or breakout could determine the next major move.
My Scenario & Strategy
As long as XAUUSD remains below the 4,120 Resistance Zone and the descending trendline, the bearish scenario remains valid. A rejection from current levels could push price toward the 4,000 Support Zone (TP1).
However, if XAUUSD breaks above the 4,120 Resistance Zone and the descending trendline, the bearish outlook would weaken, opening the door for a stronger bullish recovery.
That’s the setup I’m tracking. Thank you for your attention, and always manage your risk.  Short
Short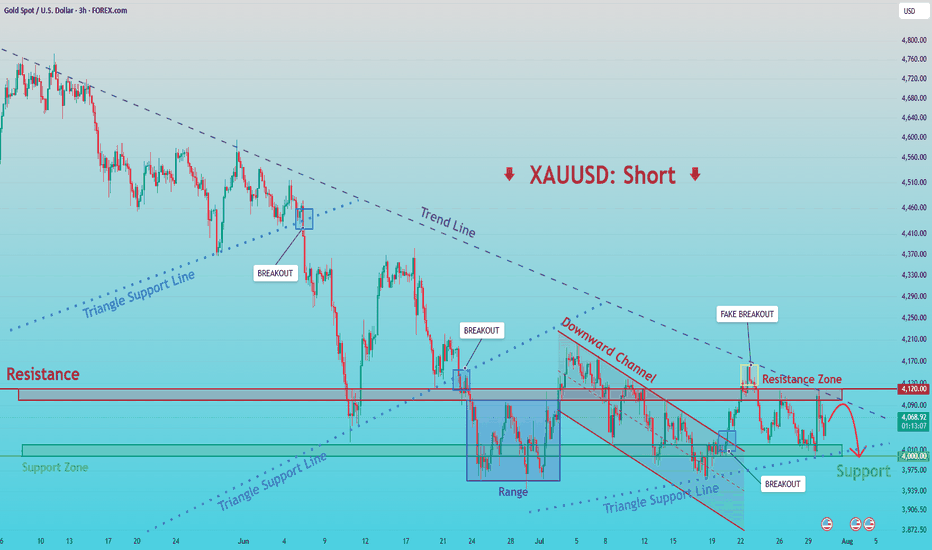
Long 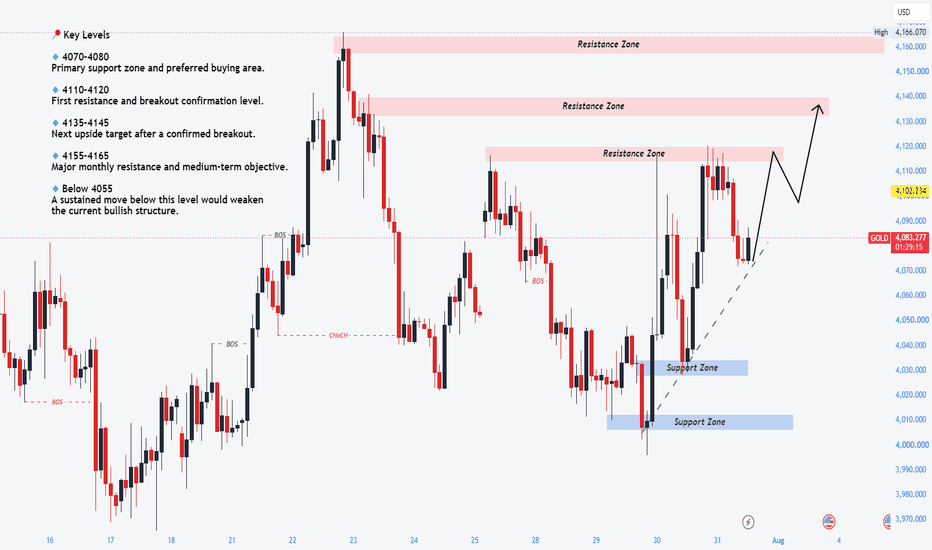
EURUSD Breaks the Downtrend ChannelLook at the bigger picture first. EURUSD had been moving inside a prolonged downtrend, consistently forming lower highs while respecting the descending channel. For most of this move, sellers remained in control, with every recovery attempt being rejected near dynamic resistance.
But now, something important has changed. Price is no longer being rejected at the upper boundary of the channel. Instead, EURUSD has broken above the descending trendline with a strong bullish move, signaling that bearish momentum is starting to weaken and the market structure is shifting.
The next thing I’m watching is the reaction after this breakout. If EURUSD pulls back into the breakout area and buyers step in to defend it, that would provide stronger confirmation for the bullish scenario. A successful retest would suggest this move is more than just a short-term technical bounce and could open the way for further upside toward the 1.1620 target.
The bullish setup would be invalidated if price falls back below the breakout zone and starts trading inside the previous descending channel again. In that case, the breakout could turn into a false move, giving sellers another opportunity to regain control.
For now, I see this as a meaningful structural shift rather than just a temporary recovery. The market has broken its bearish structure, and the next challenge for buyers is proving they can hold this new support area.
This is only my personal market view, not financial advice. Always wait for confirmation before entering a trade and manage your risk carefully. XAUUSD – Bullish Recovery From Key Support ZoneXAUUSD – Bullish Recovery From Key Support Zone
🔍 Market Overview
Gold is showing signs of a potential recovery after finding strong buying interest around the highlighted support area. Price has recently reacted from this demand zone, suggesting that sellers are losing control and buyers are attempting to build a stronger base.
The previous bearish structure is still visible, with price trading below the descending trendline. However, the latest reaction from support indicates that momentum is gradually shifting. A breakout above this falling trendline would be an important confirmation that buyers are regaining control.
📈 Market Structure Insight
Market Bias: Bullish
Momentum: Improving
Current Phase: Recovery from support & breakout attempt
As long as XAUUSD continues to hold above the highlighted support zone, the bullish recovery structure remains valid.
🚀 Trading Scenarios
✅ Bullish Scenario (Primary Bias)
Conditions:
Price holds the current support zone.
Buyers break above the descending trendline.
A higher-low structure continues to develop.
Trade Plan:
Look for buying opportunities after a confirmed breakout or a successful retest of the broken trendline. A clean breakout would strengthen the probability of further upside continuation.
🎯 Target 1: 4,120
🎯 Target 2: 4,164
❌ Bearish Invalidation Scenario
Conditions:
Price loses the current demand zone.
Sellers push gold back below the recent support area.
Bearish momentum returns after the failed recovery attempt.
Trade Plan:
A breakdown below support would invalidate the bullish idea and suggest that the previous downtrend may continue.
🎯 Key Support Zone: 4,000 – 4,020
📍 Key Levels to Monitor
🟢 Immediate Resistance: 4,120
🟢 Major Resistance: 4,164
🔴 Immediate Support: 4,020
🔴 Major Support: 4,000
⚠️ Trading Perspective
Gold is currently attempting to recover after forming a strong base near a key demand area. The reaction from support shows that buyers are becoming more active, but the real confirmation will come from a breakout above the descending trendline.
Until that happens, this remains a recovery setup rather than a fully confirmed trend reversal.
🧠 Professional Insight
This setup is supported by:
Strong reaction from the demand zone.
Buyers defending recent lows.
Bearish trendline approaching a potential breakout point.
Early signs of momentum recovery.
Formation of a possible higher-low structure.
The stronger entries usually come after confirmation and retesting rather than entering during the first impulsive move.
🛡️ Risk Management
Wait for breakout confirmation before entering.
Avoid chasing large bullish candles.
Place risk below the support structure.
Respect invalidation levels and protect capital.
This analysis is for educational purposes only and not financial advice. Long 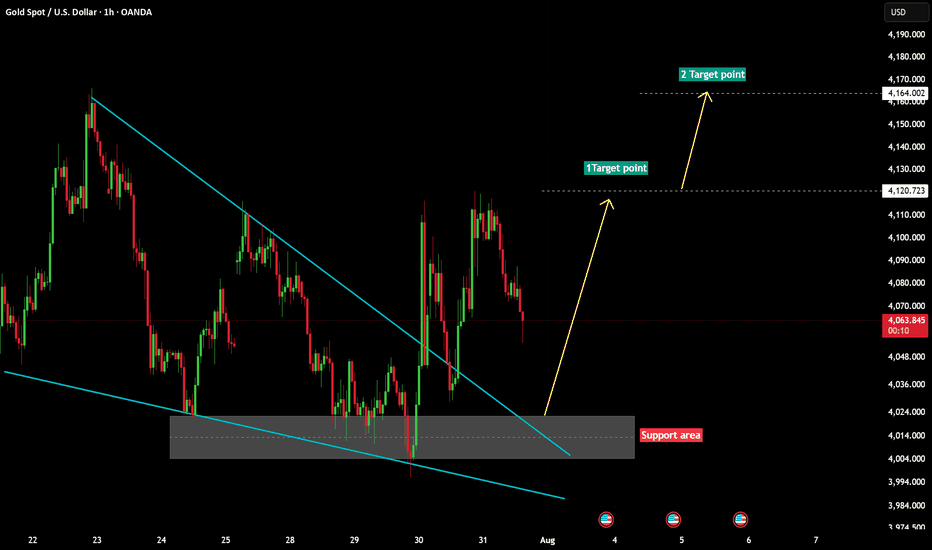
Short 
Short 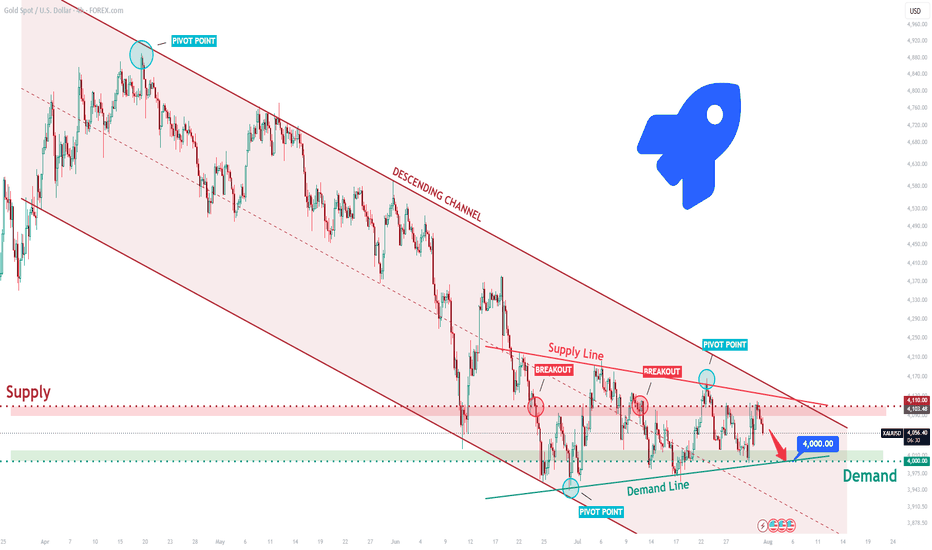
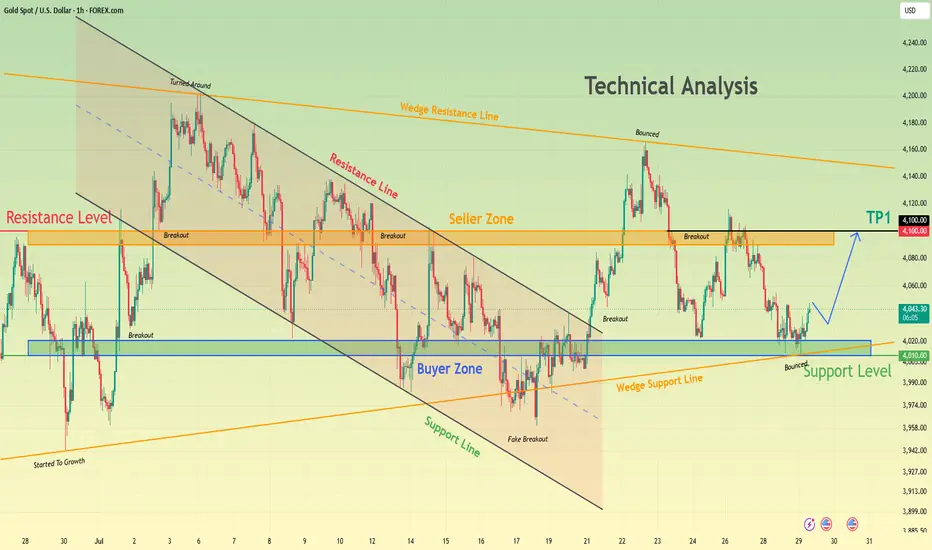
Gold Rebounds From Wedge Support With 4,100 Resistance in FocusHello traders! Here’s my technical outlook based on the current XAUUSD (1H) chart structure. XAUUSD previously traded inside a descending channel before breaking above resistance, signaling a shift in short-term momentum. After the breakout, price entered a broad recovery but is still trading inside a larger rising wedge, where the 4,100 Seller Zone continues to cap upside attempts. Currently, XAUUSD is holding above the 4,010 Buyer Zone and the wedge support line while remaining below the 4,100 Seller Zone. The latest bounce from support suggests buyers are attempting to regain control. As long as XAUUSD stays above the 4,010 Buyer Zone and continues respecting the wedge support, the bullish scenario remains valid. A sustained rebound could push price toward the 4,100 Seller Zone (TP1). However, a breakdown below 4,010 would weaken the bullish outlook and favor another move lower. Please share this idea with your friends and click "Boost" 🚀 Long 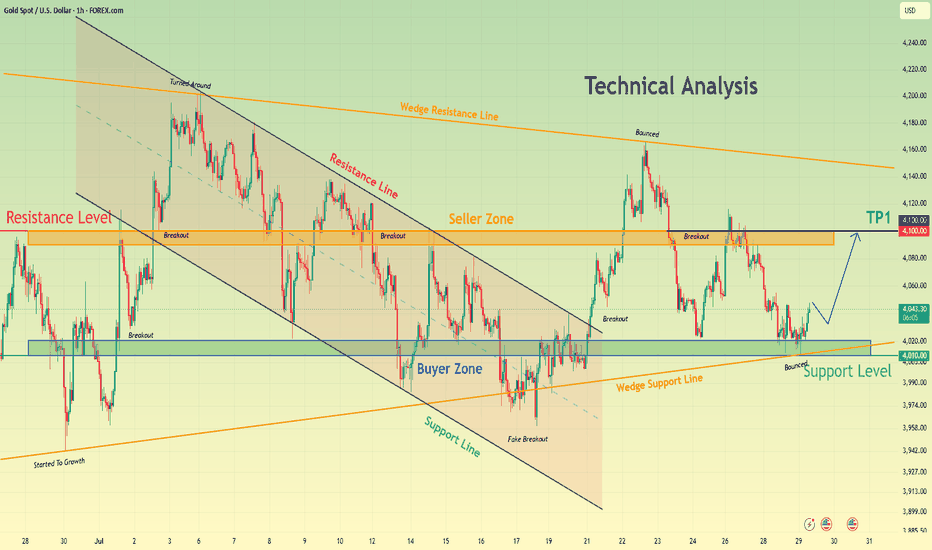
Long 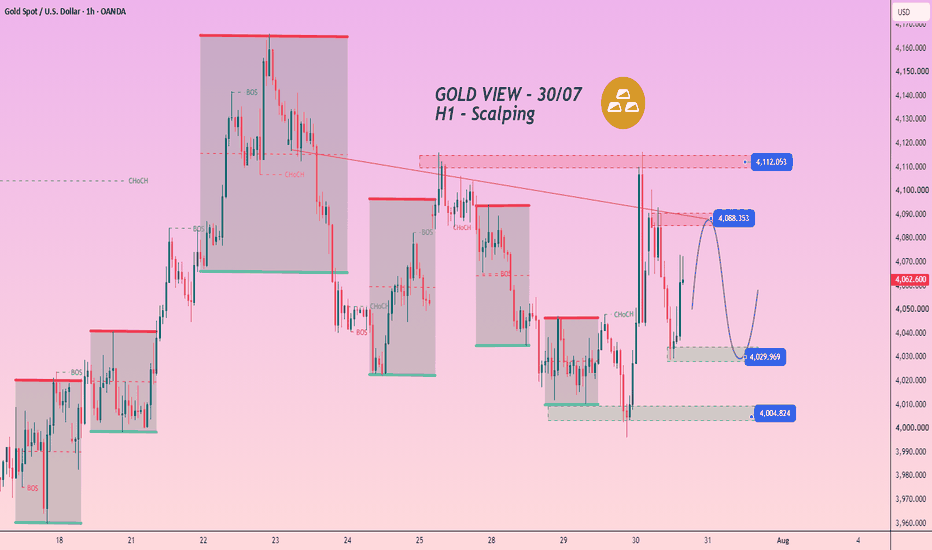
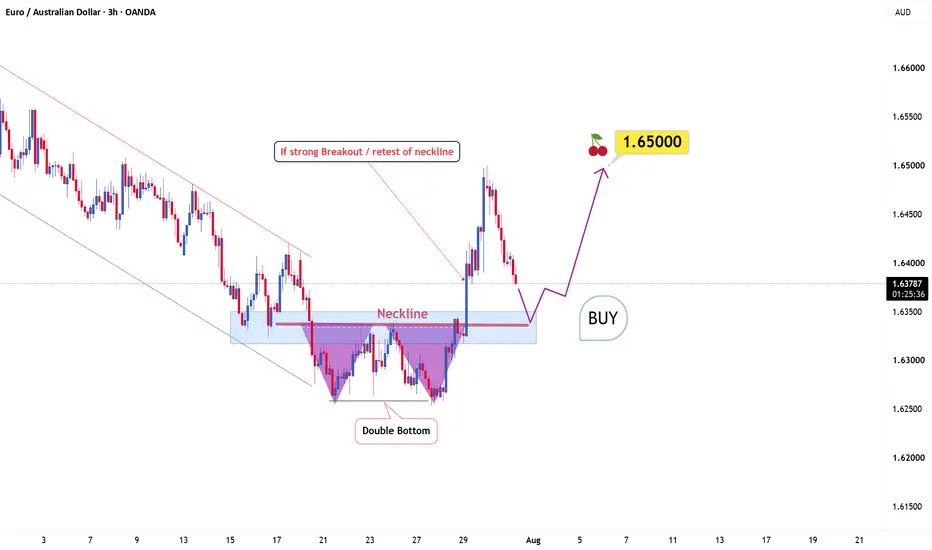
Double Bottom Reversal likely for EURAUDPrice has been moving in a clear downtrend within a descending channel. After the recent decline, notice how EURAUD appears to have formed a double-bottom pattern near the lows. This type of structure often develops after a strong sell-off, when selling pressure begins to weaken and buyers gradually return.
The neckline is the key level to watch now, and price has already started breaking above this area. A strong breakout candle could confirm the pattern, but the safer approach would be to wait for price to return and retest the neckline. If the former resistance holds as support, it could provide an ideal entry for the next bullish move.
The projected target is calculated by measuring the height of the double bottom and adding it above the neckline. In this case, the bullish target is around 1.6500. A stop loss could be placed below the neckline after the retest, or more conservatively below the second bottom.
A double-bottom pattern can provide a reliable signal, although its accuracy still depends on volatility, unexpected events, and broader market conditions. For now, if the neckline holds during the retest and shows a strong rejection of lower prices, the probability of EURAUD continuing higher would increase significantly. BTCUSDT Long: Holds Trendline Support, Buyers Target $65,500Hello traders! Here’s my technical outlook based on the current BTCUSDT (1H) chart structure. BTCUSDT recently broke below a consolidation range and entered a descending channel, confirming short-term bearish pressure. After rebounding from the 63,700 Demand Zone and the rising trendline, buyers pushed price back toward channel resistance.
Currently, BTCUSDT is trading above the 63,700 Demand Zone while remaining below the 65,500 Supply Zone and the descending channel.
As long as BTCUSDT holds above the 63,700 Demand Zone, the bullish recovery remains valid. A breakout above the channel could drive price toward the 65,500 Supply Zone (TP1). However, losing support would weaken the bullish outlook. Manage your risk! Long 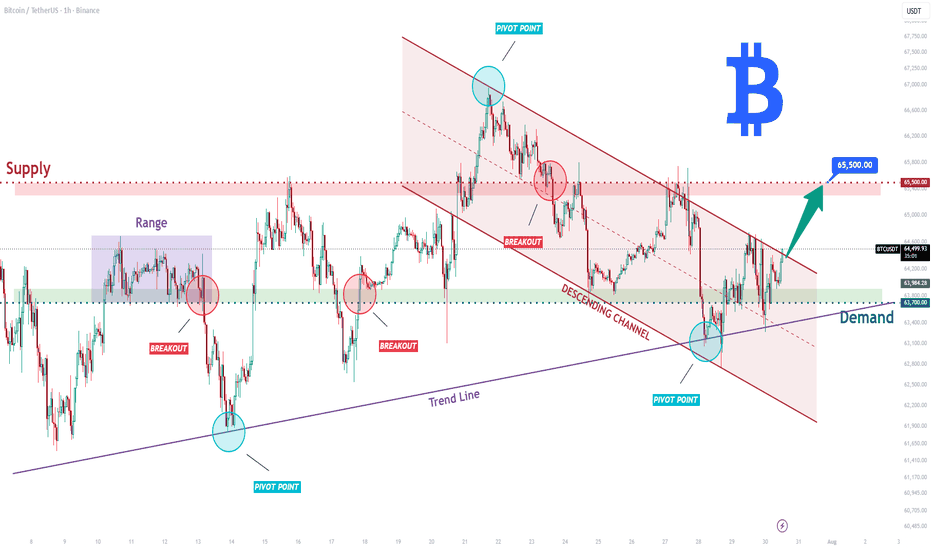
GOLD REBOUNDS AFTER FED PAUSE - IS 4100 THE NEXT TARGET?Gold staged a strong recovery after the Federal Reserve kept interest rates unchanged, a decision that weakened the U.S. dollar and provided fresh support for precious metals. The bullish reaction confirms that buyers remain active, but price is now approaching several important resistance zones where selling pressure could reappear.
Technically, the latest rally has shifted short-term momentum back to the upside, while the 4030–4045 area is acting as the nearest support. As long as this zone continues to hold, buyers maintain the advantage and another attempt toward higher resistance remains the preferred scenario.
The first hurdle is located around 4075–4090. A successful breakout above this area would open the door for a move toward 4110–4125, with the broader resistance zone at 4130–4140 becoming the next upside objective.
For now, the preferred strategy is to buy pullbacks while price remains above the 4030–4045 support zone. Although bullish momentum has improved after the Fed decision, traders should still wait for confirmation around resistance, as profit-taking could trigger temporary pullbacks before the next leg higher.
📍 Key Levels
🔹 4030–4045
Primary support zone and preferred buying area.
🔹 4075–4090
First resistance and breakout confirmation level.
🔹 4110–4125
Next upside target after a confirmed breakout.
🔹 4130–4140
Major H4 resistance and medium-term target.
🔹 Below 4020
A sustained break below this level would weaken the current bullish recovery.
✅ Preferred Scenario
Price holds above 4030–4045 support.
Look for bullish confirmation to enter Buy positions.
Break above 4075–4090 confirms continuation.
Upside targets remain 4110–4125, followed by 4130–4140. Long 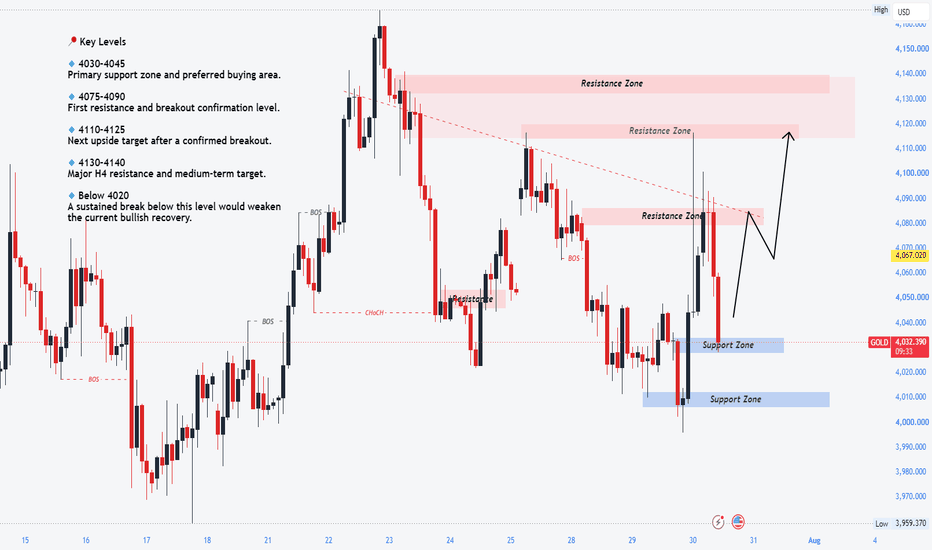
BTCUSDT Holds Trendline Support, Recovery Toward $65K in FocusHello traders! Here’s my technical outlook based on the current BTCUSDT (2H) chart structure. BTCUSDT previously recovered from the 63,000 Buyer Zone and traded inside a broad consolidation range. After breaking above the range, price rallied into the 65,000 Seller Zone, where it met the descending resistance line and was rejected, confirming renewed selling pressure. Currently, BTCUSDT is trading just above the 63,000 Buyer Zone while remaining below the 65,000 Seller Zone and the descending resistance line. The latest pullback is testing a key confluence area where buyers may attempt to defend support. As long as BTCUSDT holds above the 63,000 Buyer Zone and the rising trendline, the bullish scenario remains valid. A successful rebound could push price back toward the 65,000 Seller Zone (TP1). However, a breakdown below 63,000 would weaken the bullish outlook. Please share this idea with your friends and click "Boost" 🚀 Long 
Base Building After Trendline Breakout – Is the Next Leg Higher?Presenting another high-probability chart story.
After spending months trading below a well-defined descending trendline, DXCM finally broke above that resistance, signaling a potential shift in the longer-term trend.
As often happens after a major breakout, price returned to retest the broken trendline, successfully confirming it as new support instead of falling back below it.
But what makes this chart even more interesting is what happened next.
Rather than making an impulsive move immediately, DXCM has entered a healthy post-breakout consolidation, building a base between 67 and 79. This type of sideways price action often represents re-accumulation, where the market digests previous gains before deciding on its next directional move.
Even during this consolidation, buyers continue to defend the structure.
Most recently, price found support at the Daily EMA 200, another level that institutions often monitor. Holding this dynamic support while remaining above the broken trendline keeps the overall bullish structure intact.
Levels I'm watching
🟢 Support: 67 (also near the Daily EMA 200 @ 70)
🔴 Resistance: 79
A decisive breakout above 79 would confirm that the consolidation has resolved to the upside and could trigger the next bullish impulse towards 89, 113 and even 140s.
Until then, this remains a chart of patience rather than prediction. Strong trends often spend time building energy before making their next move.
Bullish Thesis
As long as DXCM continues holding above 67 on a daily closing basis, the post-breakout structure remains healthy and favors another attempt toward higher prices.  Long
Long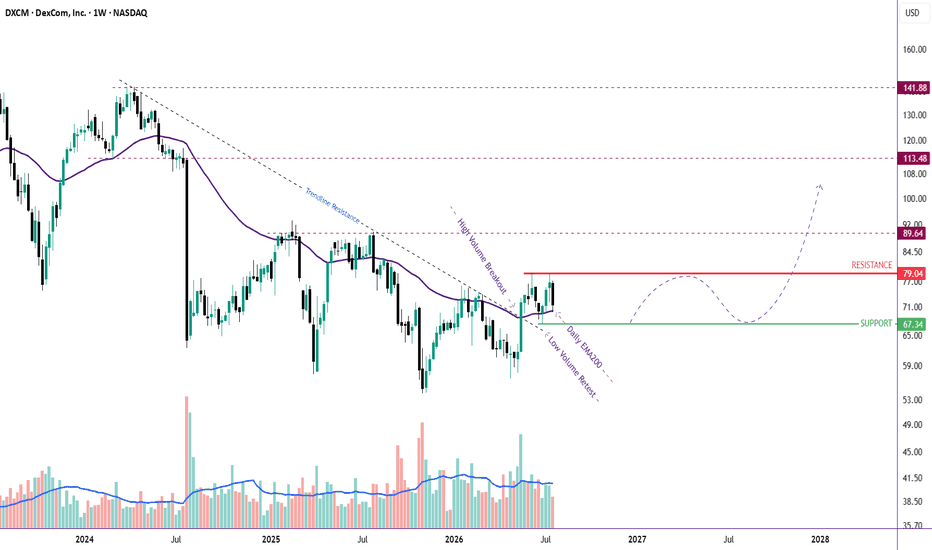
Long 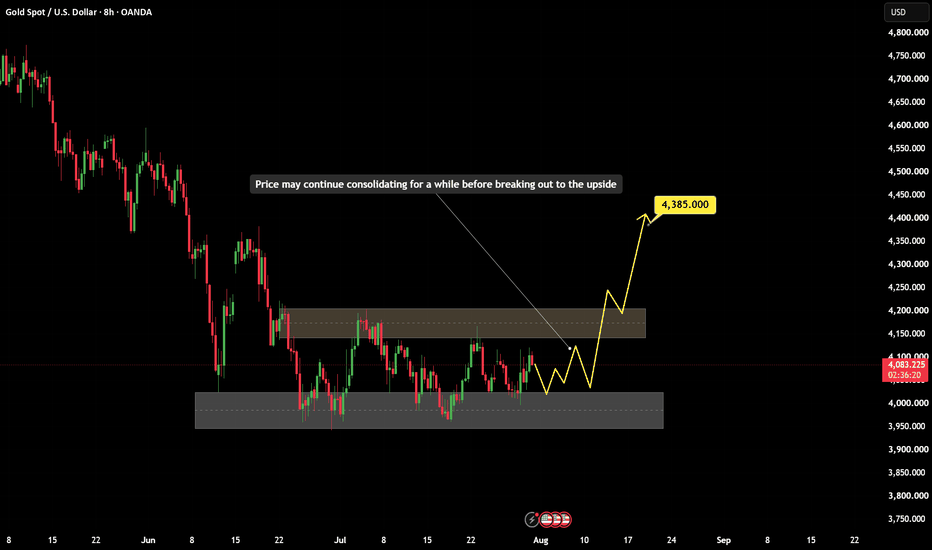
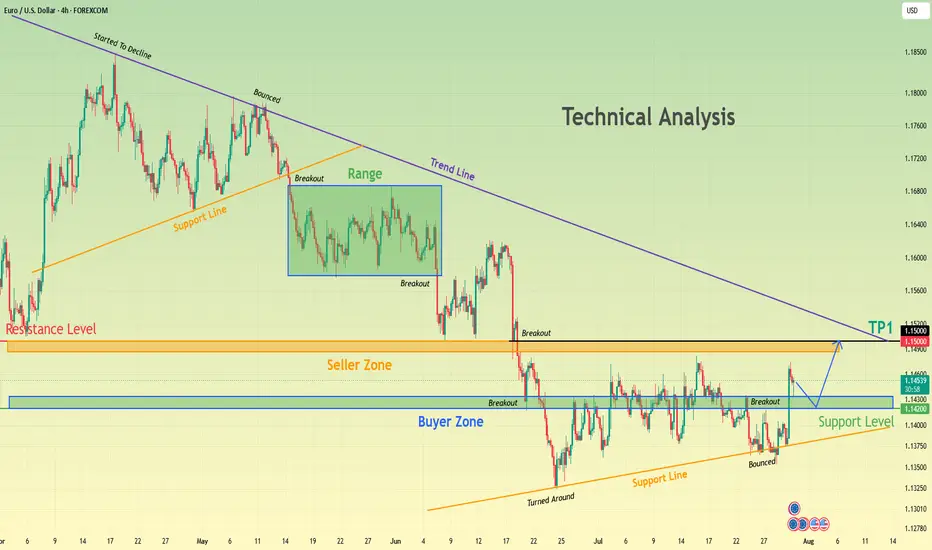
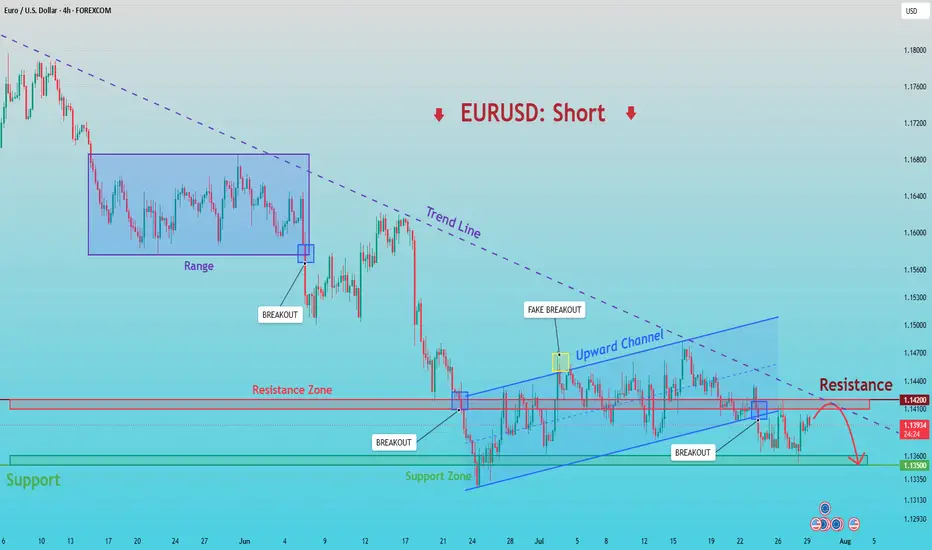
EURUSD: Rejection from Resistance Could Open the Way to 1.1350Hello everyone, here is my breakdown of the current EURUSD setup.
Market Analysis
EURUSD previously traded inside a broad range before breaking below support, confirming a bearish shift in market structure. After the decline, buyers regained some control and pushed price into an ascending channel, but the recovery stalled beneath the long-term descending trendline. The latest rejection from the 1.1420 Resistance Zone suggests sellers are defending this area once again.
Currently, EURUSD is trading above the 1.1350 Support Zone while remaining below the 1.1420 Resistance Zone and the descending trendline. Price continues to trade near the lower boundary of the ascending channel, where the next directional move is likely to develop.
My Scenario & Strategy
As long as EURUSD remains below the 1.1420 Resistance Zone and the long-term descending trendline, the bearish scenario remains valid. A rejection from current levels could push price toward the 1.1350 Support Zone (TP1).
However, if EURUSD breaks above the 1.1420 Resistance Zone and the descending trendline, the bearish outlook would weaken, opening the door for a stronger bullish recovery.
That’s the setup I’m tracking. Thank you for your attention, and always manage your risk. M&M: 1H Descending Channel Breakout & Consolidation Continuation📊 Mahindra & Mahindra Ltd. (M&M) - 1-Hour (1H) Chart Analysis
This post is shared for EDUCATIONAL PURPOSES ONLY to analyze short-term channel breakouts, range consolidations, and moving average momentum alignment. It is not financial or investment advice.
🎯 Educational Swing Setup:
• Entry Zone: 3,160.00 – 3,210.00 (Sizing into position blocks near current levels or accumulating on minor hourly retests toward the 3,175 EMA support band).
• Target 1: 3,320.00 (Near-term key structural supply / resistance target)
• Target 2: 3,450.00 (Extended momentum expansion target zone)
• Invalidation / Stop-Loss: 3,100.00 (A definitive 1H close back below the pink long-term moving average baseline at 3,126.30 completely invalidates this bullish breakout setup).
• Expected Duration: 4 to 10 Trading Days (Short-term 1H swing view)
⚠️ Risk Management:
Since the price is currently extending toward immediate intraday highs, watch for sustained volume continuation to validate further expansion. Keep your position sizing disciplined and manage your risk appropriately!  Long
Long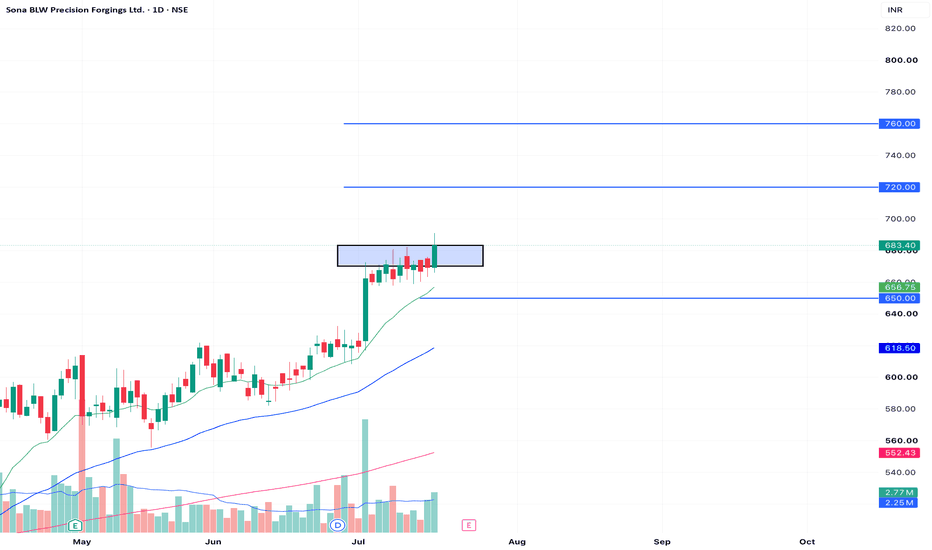
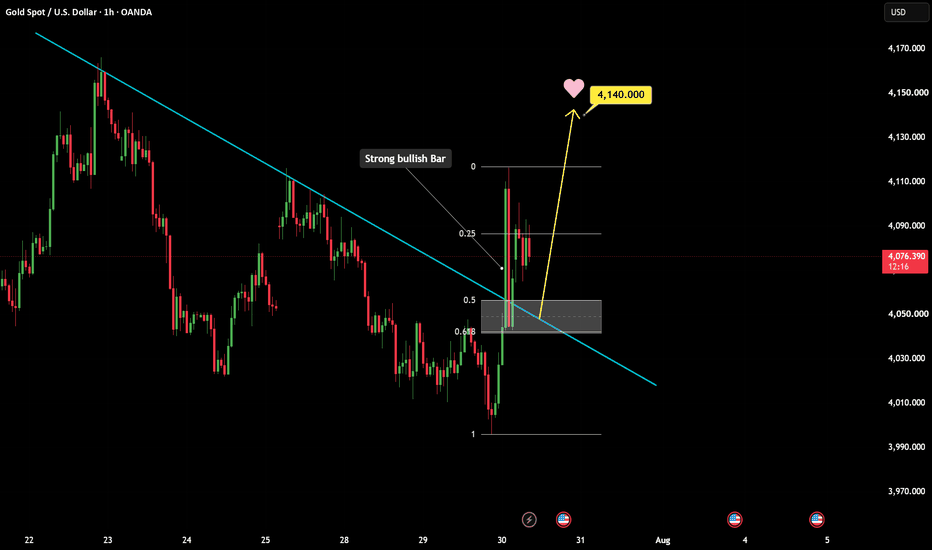
XAUUSD Gains Bullish MomentumOn XAUUSD, buyers have finally shown clear intent. The breakout above the descending trendline was sharp and decisive, suggesting that the previous selling pressure is gradually losing control.
The most important shift came when price moved above the downtrend line and sellers were unable to push it back below immediately. Following the breakout, price is now pulling back toward the 4,040–4,055 confluence zone, where the former trendline aligns with the 0.50–0.618 retracement area.
This is the key decision zone. If buyers continue to defend this retest area, the current pullback may simply be a pause before price moves back toward 4,115 and potentially 4,140.
This structural break is significant. The balance has shifted, and sellers now risk being trapped as long as price continues to hold above the breakout zone. Long