Long
Long
 Short
Short
 Short
Short
 Short
Short
Long 
What is Price Action? All Indicators are a Derivative of PriceThere is no one clear definition of price action. It can be as simple as "Every tick on any given chart, of any given market." However this definition is too broad and does not adequately describe the term. A better definition is "The collective result of buyers and sellers entering the market for any logical reason, which together create reoccurring patterns that can be analyzed and capitalized."
Price action is based on humans behaving rationally, logically, and similarly in similar situations over time, and is the cumulative effect of institutional trading. It has been, and always will remain fundamentally unchanged. If you compare a chart from 100 years ago (such as the crash of 1929) with one of today with the time scales removed, you will not be able to tell the difference between the two. It does not matter if you compare a yearly, monthly, daily, or even 1 minute chart with any other chart of a different time frame. Price action appears the same and works the same in every market, and on every time frame. The institutions cannot hide what they are doing; price action is their foot print.
Price action can be used to invest long term, or day trade any market. It allows a trader or investor to identify opportunities without the use of any indicators. In fact, all indicators are a derivative of price action in one form or another. Interestingly, the patterns which repeat as well as trend tendencies can be observed on different charts, even outside of markets.
Can you tell a difference between these two charts? The first is a daily chart of CSX. The second is a 5 minute chart of the MES (micro s&p). All markets and charts look the same, and behave similarly. Once you understand the information within, you can understand what the institutions are doing at any given time.
What is "Price Action"? What about indicators?There is no one clear definition of price action. It can be as simple as "Every tick on any given chart, of any given market." However this definition is too broad and does not adequately describe the term. A better definition is "The collective result of buyers and sellers entering the market for any logical reason, which together create reoccurring patterns that can be analyzed and capitalized."
Price action is based on humans behaving rationally, logically, and similarly in similar situations over time, and is the cumulative effect of institutional trading. It has been, and always will remain fundamentally unchanged. If you compare a chart from 100 years ago (such as the crash of 1929) with one of today with the time scales removed, you will not be able to tell the difference between the two. It does not matter if you compare a yearly, monthly, daily, or even 1 minute chart with any other chart of a different time frame. Price action appears the same and works the same in every market, and on every time frame. The institutions cannot hide what they are doing; price action is their foot print.
Price action can be used to invest long term, or day trade any market. It allows a trader or investor to identify opportunities without the use of any indicators. In fact, all indicators are a derivative of price action in one form or another. Interestingly, the patterns which repeat as well as trend tendencies can be observed on different charts, even outside of markets.
Can you tell a difference between these two charts? The first is a daily chart of CSX. The second is a 5 minute chart of the MES (micro s&p). All markets and charts look the same, and behave similarly. Once you understand the information within, you can understand what the institutions are doing at any given time.
 Long
Long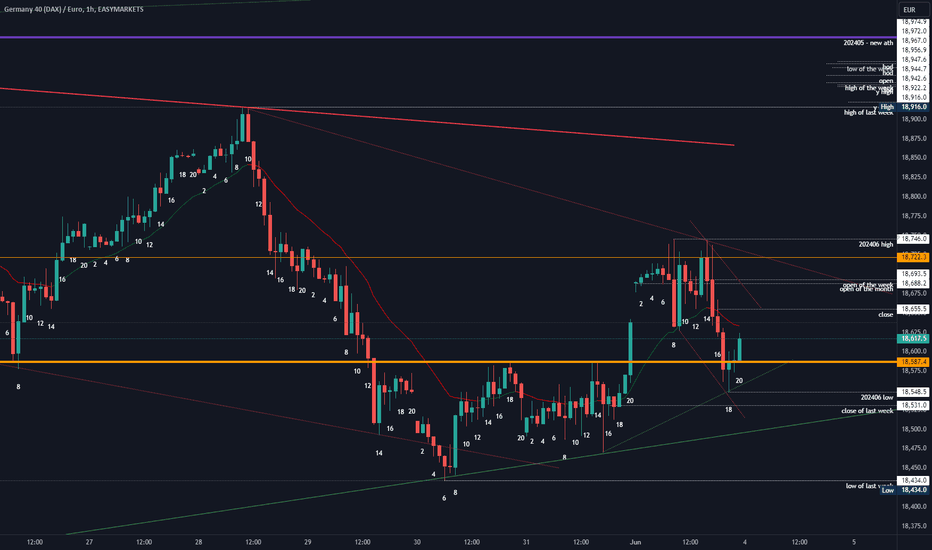
202409 - a weekly price action market recap and outlook - sp500Good evening and i hope you are well.
This week was another very strong one for the bulls. Having these kind of climaxes at the top after such a long ongoing trend is often the exhaustive end of it. But all that is just mumbling until bears show up. Bulls continue to pump this higher and that’s just what’s happening right now. All targets have been met and market keeps going because it keeps working. Bears need to generate more selling pressure and trap bulls who bought too high but right now they still can just every dip and make money.
sp500
Quote from last week:
Last week i drew a two legged (ABC) correction when we traded at 5042 and it was deeper and then higher than anticipated but other than that, a pretty perfect forecast so far. Meaning i still think we are in the second leg down and it will probably hit at least the daily 20ema at around 4970.
Low of the week was 4960. That’s is as perfect of a weekly outlook as it get’s. Was i absolutely flabbergasted by the 160 point gain after that? You bet. Can you say i was wrong in my outlook last week? I also wrote
short term: down then sideways - probably to below 5000 first and then market decides. given lower targets in the bear case
For dax my outlook was completely trash but sp500 i nailed it. Let’s view ahead.
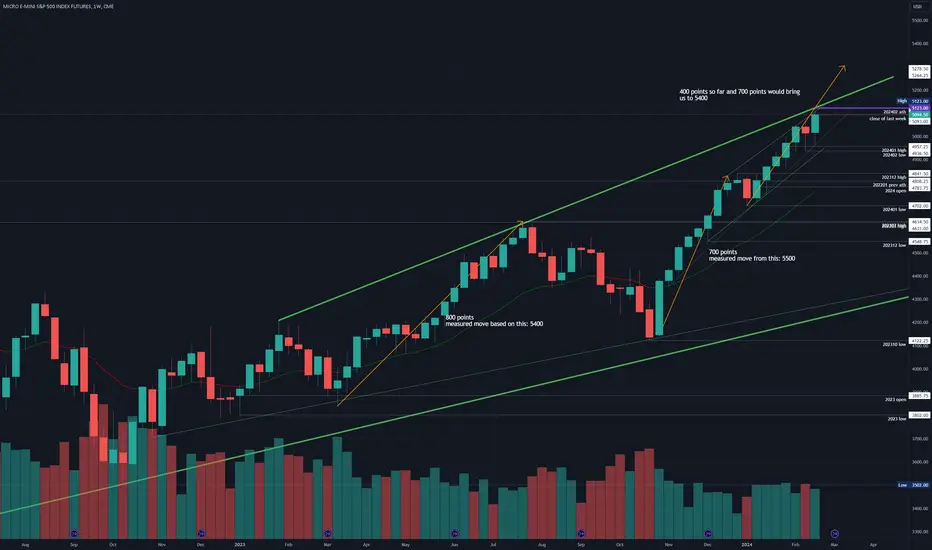
bull case: Same for dax, hard to come up with higher targets. Most reasonable thing here would be to look for pullbacks and if they are bought, hop along. BTFD has not stopped working for a long time, even though they got a bit bigger, it was not enough so far. I draw something into the chart in case of measured moves but given so many trend lines we are at and the extreme of this move, i can’t see it but market has the ability to go way way beyond what’s reasonable (looking at you NVIDIA. couple more up days and that stock might be the first 10 trillion $ company and you be sure, you will find humans who will go in front of a camera and say why this stock is reasonably priced based on fundamentals, just like they did in 2000).
bear case: Bears need way more to stop the BTFD mania. The market is overbought and everyone knows it, that does not help in structuring good short trades, since this buying could continue. Bears need prices below 4931 to make lower lows, that is pretty far away. Best they can probably get is a trading range at the highs. Their first target is the daily 20ema around 5000 and i expect bulls to buy there again.
outlook last week: “down then sideways - probably to below 5000 first and then market decides. given lower targets in the bear case”
→ Last Sunday we traded 5014 and now we are at 5101. Market hit my target +10 points. That was +44 if you will.
short term: sideways is the best bears can hope for. bulls could also just moon this further. if you read this and think: “so this jack is saying it can go up or down?!” yes bro and now come’s the important distinction: i tell you i’m neutral here and wait for the market to show me further price action and evaluate with hopefully a higher certainty the next profitable trade. right now at 5101 is the absolute worst place to enter a trade. tl;dr: wait for more price action. i lean bearish but bears have done nothing late Friday so i wait.
medium-long term: same as dax. my thesis had 5100 as invalidation and now i wait for the monthly close first