XAU/USD | Gold Invalidates The Bearish Scenario & Reclaims $4100By analyzing the #Gold chart on the 2H timeframe, we can see that after the previous update, price started to move higher and the bearish continuation scenario was invalidated.
The market reacted strongly following Kevin Warsh’s hawkish remarks, the decision to keep interest rates unchanged, and today’s U.S. GDP and PCE data. Together, these developments supported Gold and pushed price toward higher levels.
Currently, Gold is trading around $4113. If buying pressure continues and price manages to stabilize above the key $4100 level over the next four hours, the probability of another bullish move will increase. The next short-term upside targets to monitor are $4120, followed by $4130 and then $4140. For now, the reaction around $4100 remains the main confirmation for this bullish scenario. This analysis will be updated as the market evolves.
Please support me with your likes and comments to motivate me to share more analysis with you and share your opinion about the possible trend of this chart with me !
Best Regards , Arman Shaban  Long
Long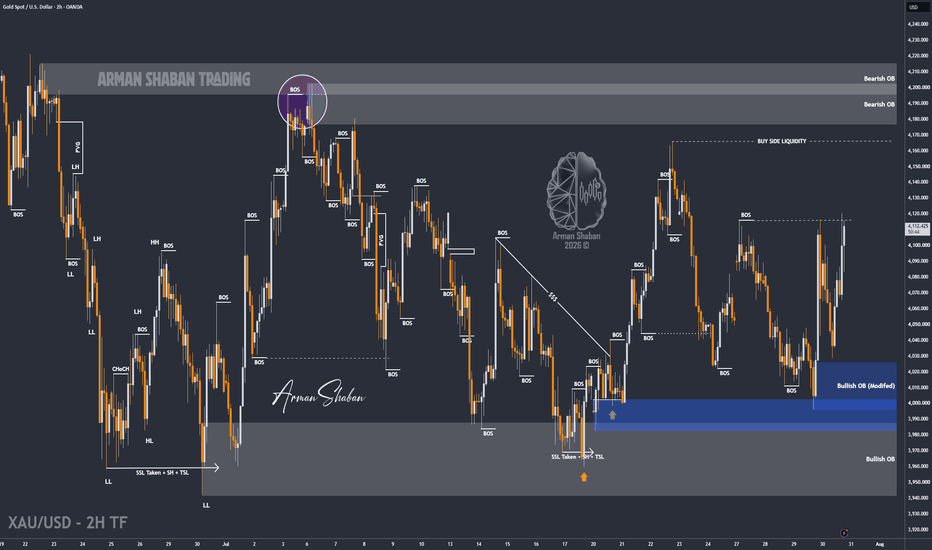
XAUUSD 30M Institutional Market Analysis | Liquidity & SMSGold is currently trading inside a corrective structure after a strong bearish move from the previous high. Price has created a consolidation range and is now approaching the Weak Low / Liquidity Zone, where institutional buyers may look for a liquidity sweep before the next expansion.
From a Smart Money Concepts perspective, the market is showing signs of potential accumulation. The previous downside move collected sell-side liquidity, while the current zone acts as a possible demand area. A valid bullish reaction requires confirmation through CHoCH (Change of Character) and BOS (Break of Structure) before expecting a continuation toward higher liquidity.
Bullish Scenario: If price sweeps the Weak Low area and holds the demand zone, buyers may target:
First resistance: 4,032–4,050
Next liquidity target: Strong High around 4,110–4,120
A break and hold above the resistance zone would confirm stronger bullish momentum.
Bearish Scenario: If sellers maintain control and price breaks below the Weak Low zone, the market may continue searching for deeper liquidity before any reversal.
Key Technical Levels:
Liquidity / Demand Zone: 3,995–4,010
Resistance Zone: 4,032–4,050
Major Target: 4,110–4,120 Strong High
Structure Confirmation: CHoCH + BOS
Fundamental View: Gold is currently influenced by U.S. Dollar strength, Treasury yields, and expectations around Federal Reserve policy. A stronger dollar and higher yields can pressure gold, while geopolitical uncertainty and safe-haven demand can support upside moves. �
Reuters +1
Today’s focus remains on Federal Reserve expectations and upcoming economic data, as traders are watching whether monetary policy signals support the dollar or increase demand for gold as a hedge. �
Reuters
Summary:
Gold is positioned at a critical liquidity area. The market is likely to seek liquidity first, and the next major move depends on whether buyers defend the demand zone or sellers continue the bearish structure. Confirmation is required before execution. Long 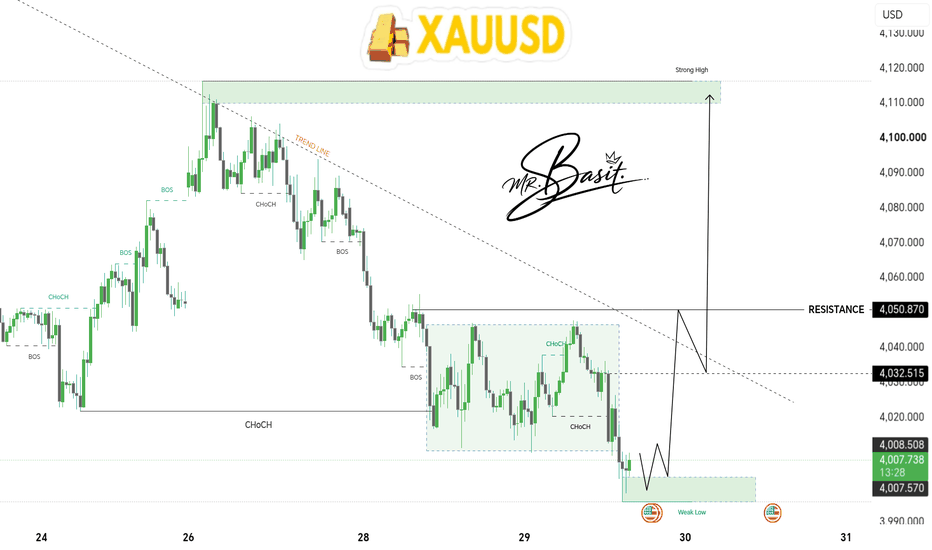
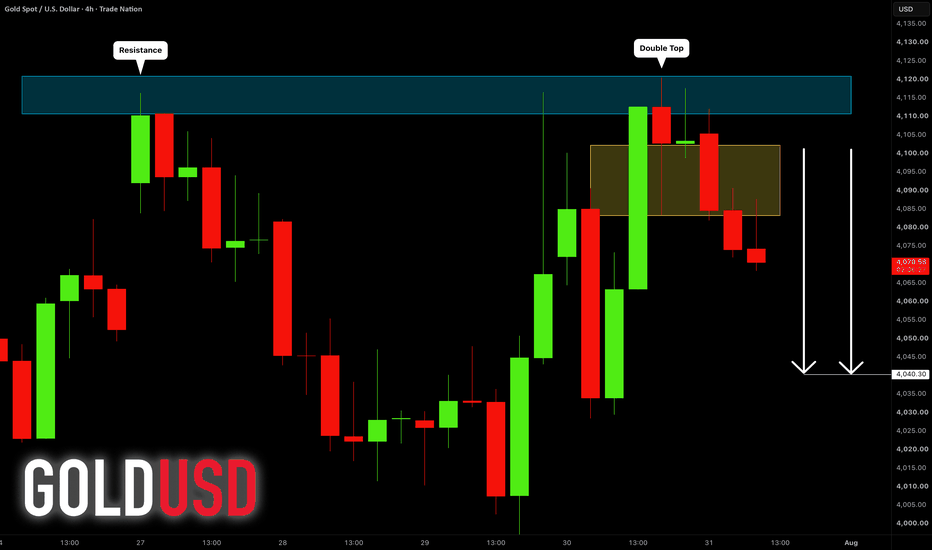
GOLD - The bearish trend continuesICMARKETS:XAUUSD remains in a medium-term bearish trend. The recent attempt to break above 4116 failed, and the market has once again transitioned into a selling phase
Gold is currently caught between geopolitical tensions, which tend to strengthen the U.S. dollar, and expectations surrounding upcoming central bank decisions. The next directional move will largely depend on developments in the Middle East and signals from the Bank of Japan. A continued hawkish stance from the Federal Reserve and a stronger dollar are likely to keep gold under pressure, while a weaker dollar and geopolitical de-escalation could support a recovery.
Bullish drivers: Geopolitical de-escalation, U.S. dollar weakness, A less aggressive Bank of Japan, Weaker-than-expected U.S. economic data
Bearish drivers: Escalation of geopolitical tensions (supporting the U.S. dollar), Renewed strength in oil prices, Strong U.S. macroeconomic data, Hawkish Federal Reserve rhetoric
Resistance levels: 4070, 4083, 4116
Support levels: 4028, 3995
The sharp decline in the U.S. dollar was largely a reaction to the Fed meeting and its mixed communication. However, the broader policy stance remains hawkish, supporting the longer-term bullish trend in the dollar and maintaining bearish pressure on gold.
Bears have successfully defended both 4116 and 4083, while price is now consolidating below 4083. Sustained trading beneath this level could provide the technical catalyst for another leg lower
Best regards,
R. Linda Short 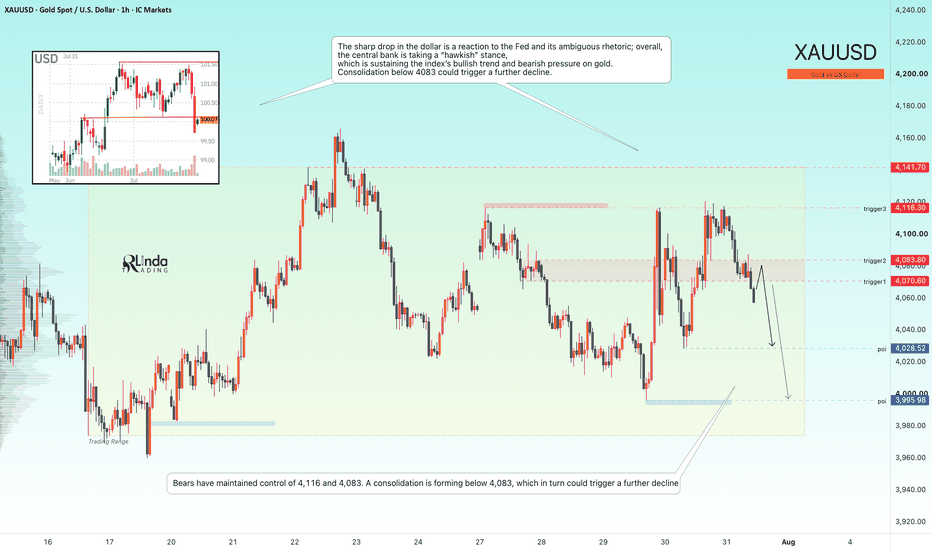
Bitcoin at a Critical Resistance: Bearish Gartley is formingBitcoin ( BINANCE:BTCUSDT ) is once again testing the 50_EMA(Daily), the resistance zone, and the Resistance Lines.
The recent recovery has been supported by the decline in the U.S. Dollar Index(DXY), alongside gains in the S&P 500 and Gold.
Can this macro support push Bitcoin above $66,000, or is another correction about to begin?
Macro Outlook
The decline in DXY and the rally in U.S. stock indices—particularly the S&P 500—have supported Bitcoin’s recent upward move.
Gold has also strengthened, reflecting broader weakness in the U.S. dollar. However, Bitcoin is now approaching an important technical resistance area that could limit further upside.
Technical Analysis
On the 4-hour time frame, Bitcoin appears to be completing a Bearish Gartley Harmonic Pattern near the Resistance Lines, indicating a potential bearish reversal.
💡 Educational Note: A Bearish Gartley Pattern identifies a potential reversal area through specific Fibonacci ratios, but confirmation from resistance and bearish price action remains essential.
I expect Bitcoin to resume its bearish movement over the coming hours and decline at least toward the key trading level of $64,000. If $64,000 is broken, the correction could extend toward the Cumulative Long Liquidation Leverage zone.
Trade Setup
First Target: $64,000
Second Target: Cumulative Long Liquidation Leverage zone($63,400-$62,550)
Stop Loss(SL): $65,803(Worst)
Cumulative Short Liquidation Leverage: $66,100-$65,200
Which level do you think Bitcoin will reach first?
🔴 $63,000
🟢 $66,000
📌 Bitcoin Analysis (BTCUSDT), 4-hour time frame.
🛑 Always use proper risk management and set a Stop Loss(SL) for every position.
🚀 If this analysis helps your trading plan, a BOOST would help more traders discover it.
 Short
Short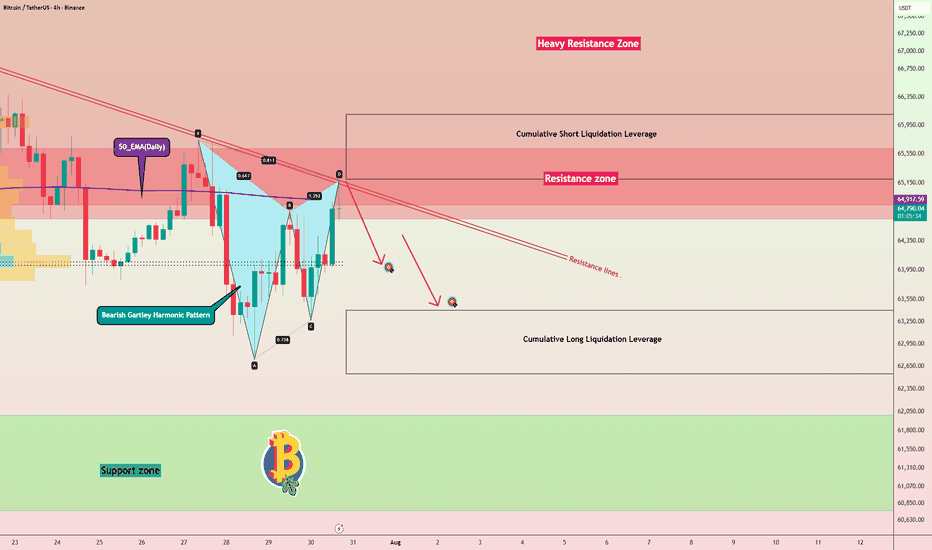
GBPUSD Price Update – Clean & Clear ExplanationGBP/USD is showing signs of exhaustion after a sharp bullish breakout, with price now pulling back into a key resistance-turned-reaction zone around 1.3450–1.3470. This area is likely to determine the next directional move.
Fundamentally, GBP/USD remains highly sensitive to upcoming U.S. economic data, Federal Reserve expectations, Bank of England policy outlook, and overall U.S. Dollar strength. Strong U.S. data or hawkish Fed comments could support the dollar and pressure the pair lower, while weaker U.S. figures or a more optimistic outlook for the UK economy could help sterling recover.
From a technical perspective, the recent rally appears to be a corrective move within the broader trend, and traders will be watching for bearish confirmation before expecting a deeper decline. However, if buyers manage to break and close above 1.3515, bullish momentum could strengthen, opening the door for a continuation toward higher resistance levels.
As long as the pair remains below the major resistance near 1.3515–1.3550, sellers could regain control and trigger another bearish leg. A rejection from this zone may push price back toward 1.3370, with further downside potential to 1.3300–1.3270 if selling pressure accelerates.
This analysis is shared for educational purposes only and should not be considered financial advice. GOLD Price Update – Clean & Clear ExplanationGold is currently trading inside a highly volatile range after failing to sustain momentum above the recent resistance zone. The latest rejection from the 4,075–4,105 supply area suggests that sellers are still defending higher prices, while buyers continue to protect the psychological support around 4,000.
Technically, the chart shows a strong bearish rejection after a sharp upward spike, indicating that liquidity above recent highs may have been swept before sellers regained control. As long as price remains below the 4,100–4,145 resistance zone, bearish pressure could continue. A failure to reclaim this area may trigger another decline toward 4,000, followed by 3,980 and potentially 3,970 if selling momentum accelerates.
On the bullish side, buyers need a strong breakout and sustained close above 4,105–4,145 to invalidate the current bearish outlook. Such a move could attract fresh buying interest and open the door for a rally toward higher resistance levels.
Overall Bias: Short-term bearish below 4,105, with sellers targeting the 4,000–3,970 region. A confirmed breakout above 4,145 would shift momentum back in favor of the bulls. Short 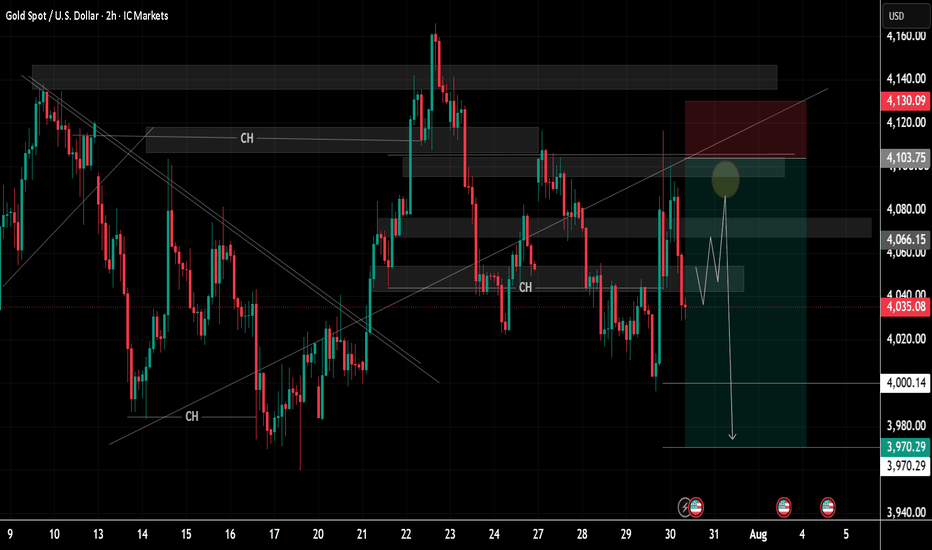
Xauusd Market Structure Update | Pullback Before Continuation?The market remains within a broader bearish trend despite the recent impulsive recovery from the 4,000 demand zone. After establishing a Change of Character (CHoCH) from the lows, price rallied aggressively into a key liquidity area, sweeping the Equal Highs (EQH) around 4,115–4,120 before encountering significant selling pressure.
The rejection from this resistance zone was followed by a Bearish Break of Structure (BOS) on the lower timeframe, suggesting that bullish momentum has weakened and the market is currently undergoing a corrective phase.
Price is now trading around the equilibrium (50%) of the recent bullish range, an area that often serves as a decision point between continuation and deeper retracement. A sustained hold above this region could attract buyers and support another attempt toward the resistance zone. Conversely, a decisive break below equilibrium may expose the discount area (4,035–4,045), with the higher-timeframe bullish order block near 4,000 remaining the next significant area of interest.
Key Levels
Resistance: 4,115–4,120 (Liquidity / Supply Zone)
Equilibrium: ~4,055 (50% of the recent impulse)
Buying Zone: 4,035–4,045 (Discount Area)
Major Order Block: 4,000–4,010 (Higher-Timeframe Demand)
Outlook
The current price action suggests a short-term correction within the recent bullish impulse. While the higher-timeframe demand remains intact, confirmation of renewed bullish strength would require a bullish market structure shift from the discount area. Failure to hold above the buying zone may increase the probability of a retest of the 4,000 order block before any meaningful continuation develops.
Disclaimer: This analysis is provided for educational purposes only and reflects a technical interpretation based on Smart Money Concepts (SMC). Financial markets involve risk, and no analysis can guarantee future price movements. Always wait for confirmation and apply appropriate risk management before making trading decisions. Long 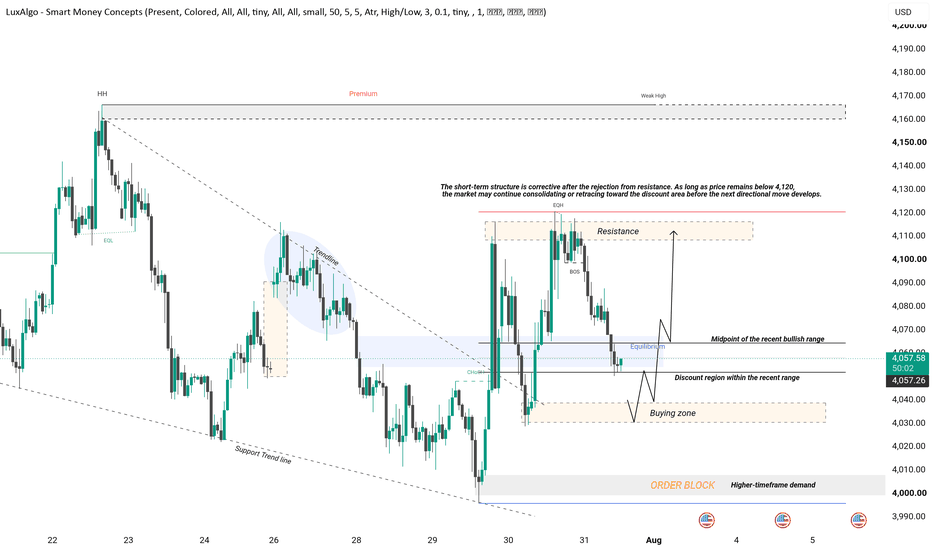
XAUUSD – Bears Regain Control as Gold Faces Strong ResistanceGold continues to trade with a bearish market structure, as sellers remain in control after another rejection from the 4,080–4,090 resistance zone. Despite several recovery attempts, buyers have failed to generate enough momentum to break above this key supply area, allowing bearish pressure to strengthen once again.
From a technical perspective, price is forming lower highs, a classic sign that the downtrend remains intact. As long as gold continues trading below the major resistance zone, the probability favors another move lower toward the next support levels. A confirmed break below 4,021 could accelerate selling pressure and expose the 3,985 area as the next significant downside target.
Fundamentally, gold remains sensitive to the strength of the U.S. Dollar, expectations surrounding future Federal Reserve policy, and global geopolitical developments. A stronger dollar, resilient U.S. economic data, or hawkish comments from Federal Reserve officials could continue weighing on gold prices. On the other hand, any signs of weaker U.S. data, falling Treasury yields, or increased demand for safe-haven assets could temporarily support a recovery.
Resistance: 4,080 – 4,090 | 4,115
Support: 40 35 / 4,021 | 3,985
At the moment, however, the technical picture continues to favor the bears. Unless buyers reclaim and hold above the resistance zone, rallies are likely to be viewed as selling opportunities rather than the beginning of a sustained bullish reversal.
Hope you found this analysis helpful. 👍
Like, Comment & Follow for more updates. Trade safe. Short 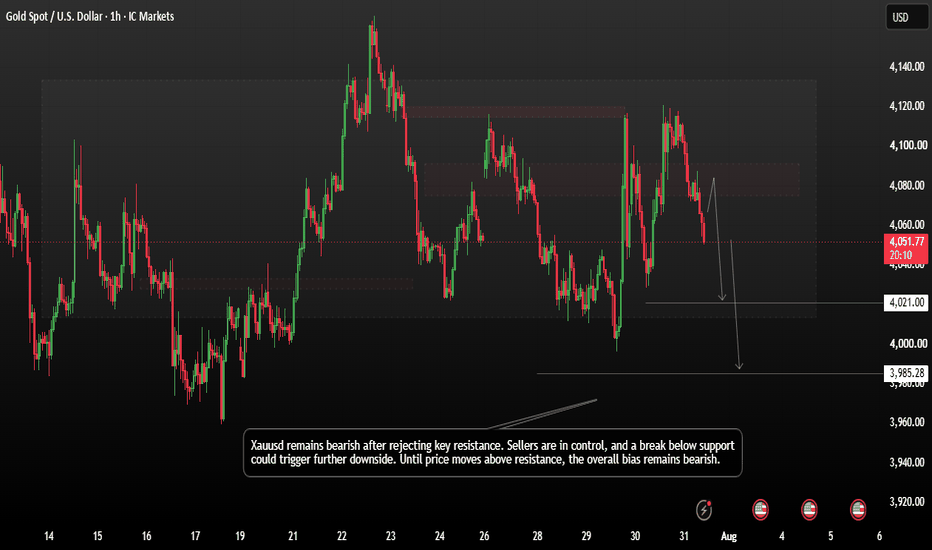
XAUUSD: Bullish Continuation in Focus After CHoCH and OB Market Context
The market recently transitioned out of a sustained downtrend following a structural shift marked by a Character Change (Choch) and a primary trendline breakout. Following an initial expansion toward higher price levels, price has retraced into a key demand zone, setting up a potential bullish continuation within the developing market structure.
Technical Reasoning
Price action shows a completed pullback into a defined OrderBlock positioned just above Key Support at 4,004.730, aligning near Minor Support at 4,033.556. A secondary inner trendline breakout reinforces a shift in short-term momentum back to the upside. The sequential targets above include the 50% Fibonacci level at 4,062.552, Minor Resistance at 4,111.907, and Key Resistance at 4,167.448.
Note: The explicit asset ticker symbol and chart timeframe are omitted on the source visual layout, though structural levels and price targets remain defined.
Bullish/Bearish Scenario
Bullish Expansion: Sustaining price acceptance above Minor Support (4,033.556) and the underlying OrderBlock favors a primary push toward 4,062.552 (Fib 50%), with extended potential toward 4,111.907 and 4,167.448.
Bearish Alternative: A breakdown below the local demand zone shifts price back down to test the lower Major Support & PML zone between 3,960.000 and 3,985.000.
Invalidation
The bullish setup is invalidated if price closes decisively below Key Support at 4,004.730, as this breaks the structural integrity of the local OrderBlock.
Risk Management Note
Risk should be strictly defined below Key Support. Waiting for lower-timeframe confirmation around the 4,033.556 support region helps optimize entry pricing and manage downside risk.
Educational Takeaway
Structural shifts (Choch) and trendline breakouts signal potential macro trend reversals, but waiting for price to retest valid demand zones (OrderBlocks) provides a higher-probability entry with defined risk compared to chasing initial impulse moves. Long 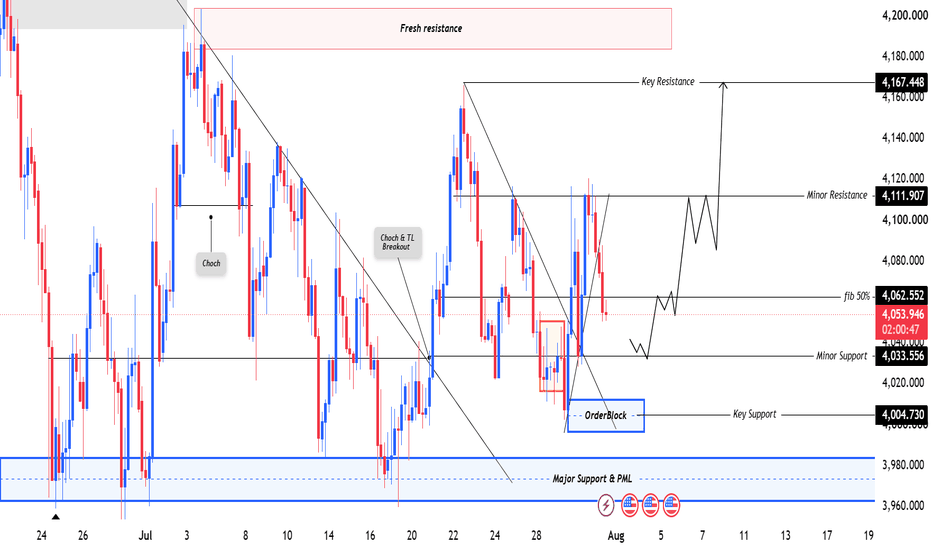
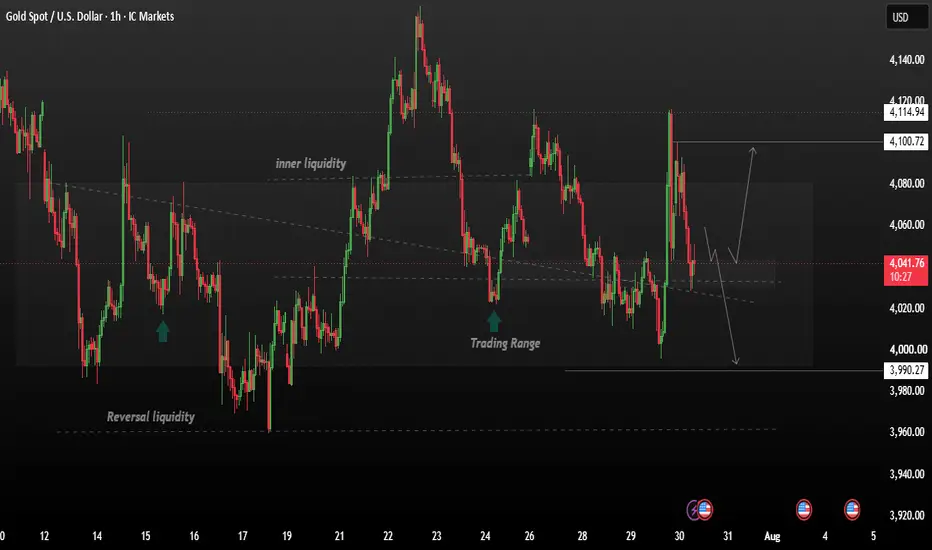
Market Indecision – Watch the Breakout LevelsGold price moved above recent highs to trigger buy-stop orders before institutional selling pushed the market back down. This type of price action is common when the market is waiting for major economic data or important central bank guidance.
From a fundamental perspective, this sharp reaction may be driven by profit-taking after the recent rally, stronger U.S. dollar movements, changing expectations for Federal Reserve interest rates, or traders repositioning ahead of high-impact U.S. economic data such as inflation, GDP, employment reports, or Fed-related comments. During these periods, institutional traders often create sharp moves in both directions before the market chooses its next trend.
Technically, price is now hovering around the middle of the trading range near 4040, which is a neutral zone. Buyers need to defend this area to keep the bullish structure intact. If gold holds above support and buyers regain momentum, the next upside targets are around 4100–4115, where previous resistance is located. A confirmed breakout above that zone could attract fresh buying pressure.
Key Levels:
Resistance: 4100 – 4115
Support: 4000 – 3990
On the downside, if sellers continue to dominate and price closes below the current support, gold could extend its decline toward 4000–3990, where stronger demand may appear. A break below that level would increase bearish momentum and could trigger a deeper correction.
Hope you found this analysis helpful. 👍
Like, Comment & Follow for more updates. Trade safe. XAUUSD: Inverse Head & Shoulders Testing Key Neckline ResistanceHi!
Gold is displaying a potential bullish reversal structure, printing a clear Inverse Head and Shoulders (iH&S) pattern right off an established Support & Demand (S&D) zone.
Key Technical Dynamics
Base Formation at Strong S&D Zone: The entire structure has developed directly above a major support region ($4,005 – $4,020 area). The strong buyer presence at this level created the foundation for both shoulders and the head spike lower, signaling robust demand underlying current prices.
Neckline Aligned with Supply Zone: The neckline of this Inverse Head & Shoulders pattern coincides directly with an active Supply & Demand zone spanning approximately $4,110 to $4,140. Price is currently pressing directly into the lower boundary of this resistance block.
Trade Setup & Execution Strategy
Because the neckline sits within a defined supply area, entering prematurely carries elevated risk until the zone is clearly invalidated.
Trigger: Wait for a decisive breakout and candle close above the supply zone ($4,140 level).
Confirmation: A healthy breakout followed by a successful retest of the broken supply zone (turning it into support) would provide the ideal confirmation for a long position.
Upside Target: Should the breakout confirm, the pattern projects a bullish continuation target toward the $4,195 – $4,200 key resistance level.
Long 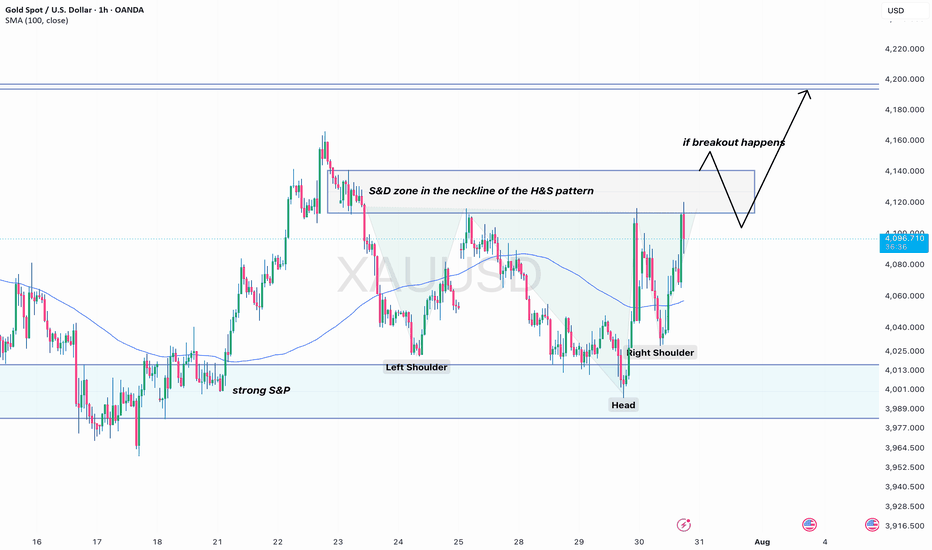
US100 – Relief Rally Into Resistance, Downside Pressure RemainsUS100 has been trading inside a corrective phase after failing to reclaim the upper boundary of the consolidation zone and price toward the 27,200–27,500 support area, where buyers stepped in and created a short-term rebound.
Tecnically is currently caught between two forces: a short-term relief rally after the recent decline, and the continuation of the broader bearish structure. The market still needs a strong catalyst to shift momentum decisively. Recent Nasdaq weakness has been linked to pressure around key technical levels and changing rate expectations.
Resistance levels: 28,400 / 28,700 / 29,200
Support levels ; 27,500 / 27,200 / 26,600
The market is now approaching a key decision zone around 28,400–28,700 resistance, which aligns with the previous trading range boundary. A rejection from this area could confirm another bearish continuation, while a strong breakout and acceptance above resistance would weaken the downside scenario.
Hope you found this analysis helpful. 👍
Like, Comment & Follow for more updates. Trade safe.  Short
Short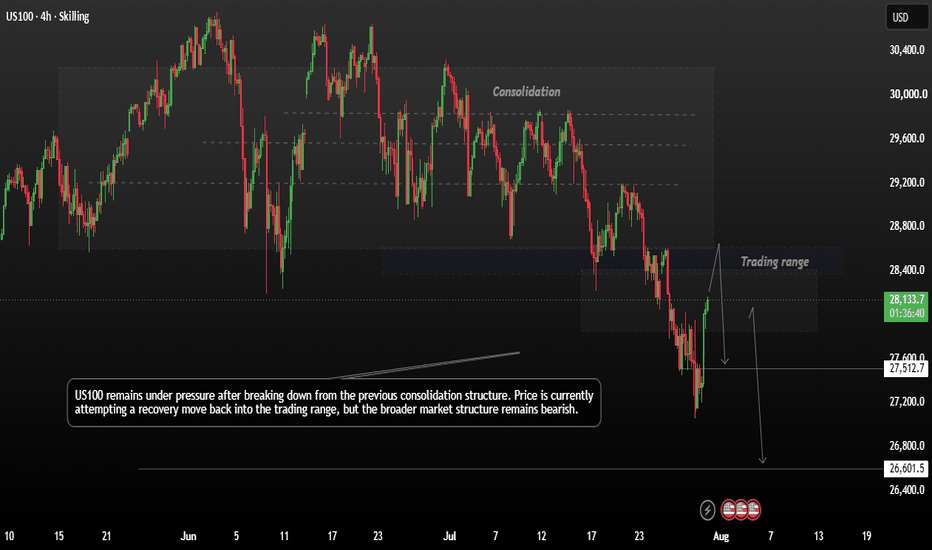
 Long
Long
Short 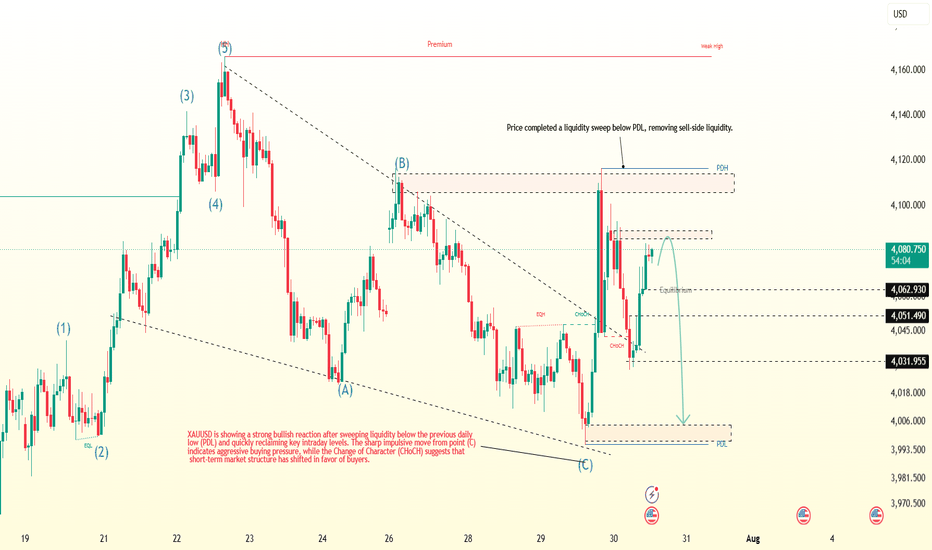
 Long
Long
XAUUSD — 4,106 Rejection or Breakout?Gold is trying to recover, but the chart is still facing an important test.
Price reacted from the 4,072 Fibo buy zone and is now moving around 4,080 - 4,090.
This short-term bounce looks positive, but gold is still trading below the main downtrend line.
That means buyers have not fully taken control yet.
The simple read
The key resistance today is 4,106.
This is the order sell / downtrend test zone.
If gold pushes into 4,106 and rejects, sellers may try to bring price back toward 4,072.
If 4,072 fails, the next support is 4,035.
A deeper bearish move can bring gold back toward the 4,005 order buy zone.
But if gold breaks and holds above 4,106, the recovery structure becomes stronger.
That would show buyers are starting to challenge the downtrend pressure.
Key price zones
Current price area: 4,080 - 4,090
Order sell / downtrend test zone: 4,106
Fibo buy reaction zone: 4,072
Short-term support: 4,035
Main order buy support: 4,005
Bullish recovery improves above: 4,106
Recovery weakens below: 4,072
Trading plan
📈 Bullish breakout scenario
If gold breaks and holds above 4,106:
The downtrend pressure becomes weaker.
Buyers may try to build a stronger recovery structure.
A clean breakout or retest above 4,106 would be the best confirmation.
No clean hold = no strong bullish confirmation.
📉 Rejection scenario
If gold rejects from 4,106:
The downtrend line remains active.
Price may pull back toward 4,072 first.
If 4,072 breaks clearly, sellers may continue toward 4,035.
Below 4,035, the deeper support zone is 4,005.
📈 Support reaction scenario
If gold returns to 4,072 or 4,035:
I will watch buyer reaction carefully.
A clean bullish reaction from these zones may create another recovery attempt.
But without confirmation, I do not want to guess the bottom. Short 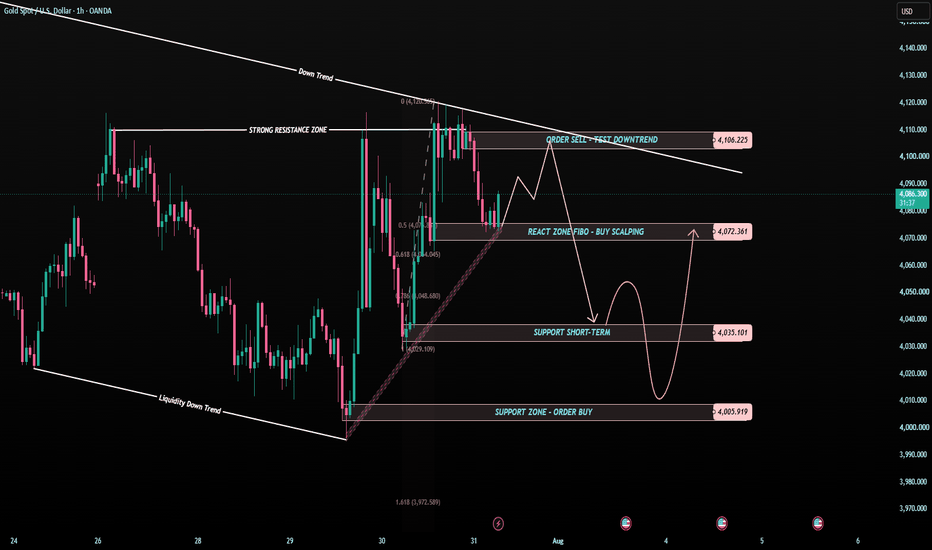
XAUUSD — FOMC Spike or Bear Trap?Gold moved aggressively after the FOMC release, but the chart is now asking a very important question:
Was that move a real bullish breakout?
Or only a liquidity spike into resistance?
After the fast push from the lower trendline area, price reached the 4,109 resistance / OB sell zone and quickly lost momentum.
That reaction is important.
Because 4,109 is not just a random level.
It sits near the descending trendline pressure, where sellers may still try to defend the larger bearish channel.
The simple read
Gold is currently trading around 4,040 - 4,050.
The first key reaction zone is 4,048.
If buyers can hold this area and build structure, gold may attempt another recovery toward 4,109.
But if 4,048 fails, price may return to the 4,008 support / OB buy zone.
That 4,008 area is the real support test after the FOMC volatility.
If buyers defend 4,008, gold may create a stronger bounce.
If 4,008 breaks clearly, the post-FOMC recovery becomes much weaker.
Key price zones
Current price area: 4,040 - 4,050
Fibo / OB reaction zone: 4,048
Main support / OB buy zone: 4,008
Trendline resistance / OB sell zone: 4,109
Major resistance / OB sell zone: 4,151
Bullish recovery improves above: 4,109
Recovery weakens below: 4,008
Trading plan
📈 Bullish recovery scenario
If gold holds above 4,048:
Buyers may try to rebuild momentum.
A clean break and hold above 4,048 can open another move toward 4,109.
If gold breaks above 4,109 with confirmation, the next major resistance becomes 4,151.
But I do not want to chase one fast candle.
A real continuation needs structure, not only volatility.
📉 Pullback scenario
If gold fails to hold 4,048:
Price may continue pulling back toward 4,008.
This would not be surprising after the FOMC spike.
News candles often need a retest before the market chooses the next direction.
If 4,008 holds with a clean reaction, buyers may try another recovery.
If 4,008 fails, the bullish recovery becomes weaker.
📉 Resistance rejection scenario
If gold recovers toward 4,109 and rejects again:
The trendline resistance remains active.
Sellers may defend the OB sell zone and push price back into the 4,048 - 4,008 range.
This is why 4,109 is the real breakout test today. Long 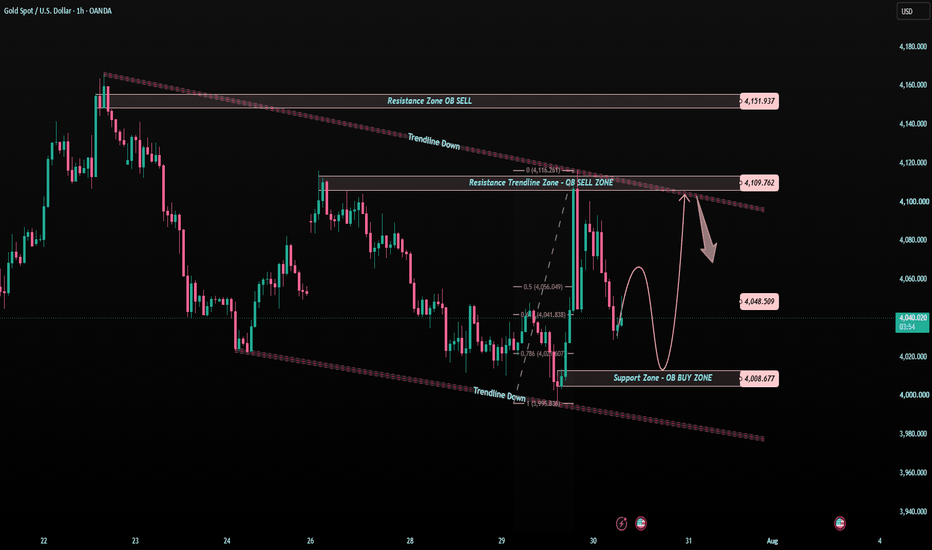
Short