Education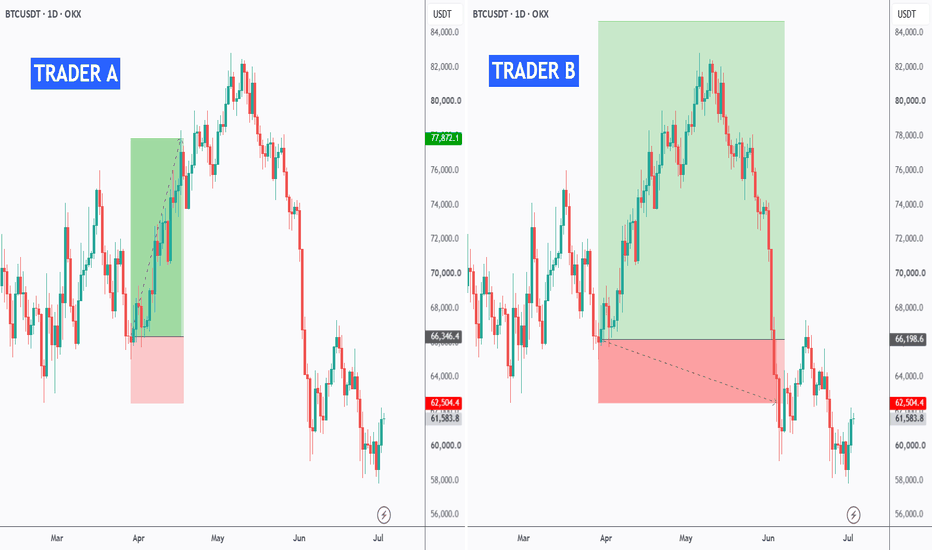
 Long
Long
Stop-Loss Blueprint: How to Quit Getting Wicked Out Early🔵 Stop-Loss Blueprint: How to Quit Getting Wicked Out Early
Difficulty: 🐳🐳🐋🐋🐋 (Beginner-Friendly)
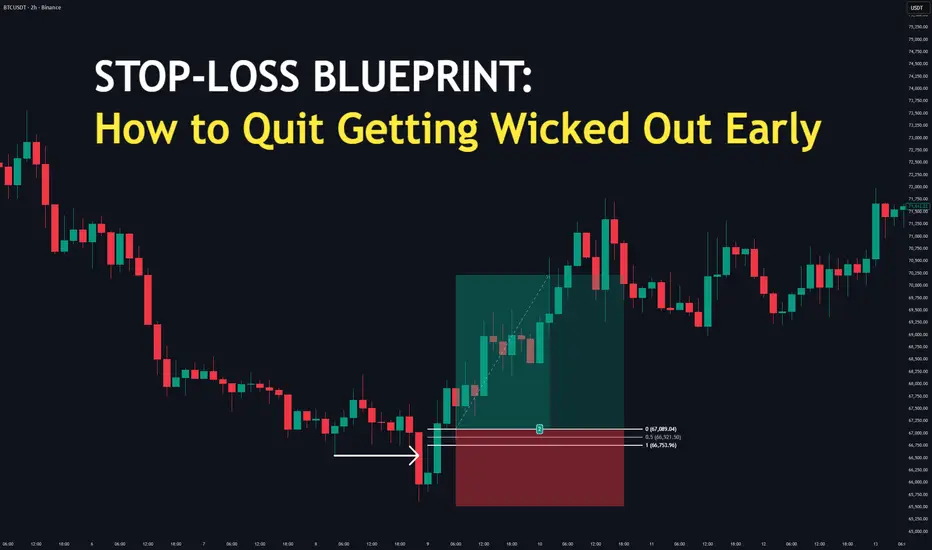
It is the most frustrating feeling in trading: you entry a trade, price moves directly to your stop-loss, "wicks" you out by a single pip, and then immediately runs toward your take-profit target. In this blueprint, you will learn how to hide your stops behind institutional walls so you can stay in the move.
🔵 THE RETAIL MISTAKE: THE "RANDOM NUMBER" STOP
Most beginners place their stop-losses based on a random number of pips (e.g., "I always use a 10-pip stop") or right at an obvious support line.
The problem? The interbank algorithms are designed to hunt these exact areas to collect liquidity before expanding. If your stop-loss is resting right where everyone else's is, it becomes a target.
The Institutional Rule: Your stop-loss should never be placed where you hope price won't go. It must be placed where the setup is completely invalidated .
🔵 HIDING BEHIND CONFLUENCE WALLS
Think of your stop-loss like a shield. You don't want to leave it out in the open; you want to hide it behind solid walls.
When analyzing market structure, you have three major structural walls to protect your trade:
Wall 1: The Manipulation Wick (The Floor): Look at the horizontal white arrow at the bottom left. This wick hunted the weak retail stops. Your ultimate structural invalidation point lives safely below the low of this wick.
Wall 2: The Order Block Anchor (The Blue Box): The blue shaded rectangle highlights the institutional order block candle at the absolute bottom. The opening price of this block acts as the heavy defensive floor.
Wall 3: The Equilibrium Level (0.5): Look at the Fibonacci grid on the right. The 0.5 level (66,462.45) marks the middle of the pullback range. Notice how price pulls back through equilibrium to mitigate the order block below it before violently exploding into profit.
Professional Takeaway: When multiple walls overlap, you have a high-confluence zone. You can place a tight, highly secure stop-loss just underneath and catch massive 4+ Risk-to-Reward moves easily.
🔵 HOW TO PLACE YOUR STOP LIKE A PRO
1. The "Protected Low" Strategy (Long Setups)
When buying after a Market Structure Shift (MSS) or CISD, do not place your stop right at the entry trigger candle. Place it 2–3 pips below the swing low that swept the liquidity.
If price returns to break that low, it means the manipulation wasn't a fakeout—it means the trend is actually broken. Your setup is dead, and you want to be out.
2. The "Breaker" Shield
If you are entering on a Breaker Block or a mitigation play, hide your stop-loss just behind the invalidation level of that specific block. If the algorithm respects the zone, price should not cross into the invalidation area.
🔵 THE RISK-TO-REWARD (R:R) SOLUTION
Traders often use tight, dangerous stops because they want a huge Risk-to-Reward ratio (like 1:10). But a 1:10 trade is useless if you get stopped out 90% of the time.
The Fix: Give your trade room to breathe. A wider, structurally safe stop-loss combined with a target at a major Liquidity Void will give you a higher win rate and a cleaner, stress-free execution.
🔵 EXAMPLE TRADING CHECKLIST
The "Safe Shield" Framework
Identify your entry trigger (FVG, CISD, or Order Block).
Locate the nearest institutional manipulation wick or structural anchor.
Place the stop-loss 2–5 pips past that structural anchor.
Ensure the distance to your Take Profit target provides at least a 1:2 or 1:3 R:R.
If the R:R is too low, skip the trade and wait for a deeper discount entry.
🔵 CONCLUSION
Stop letting the algorithm use your account as fuel. By placing your stop-loss behind valid structural invalidation levels instead of random pip counts, you transform your stop from an easy target into a highly protected fortress.
Do you use a fixed pip count for your stops, or do you hide them behind structural wicks? Let us know your approach below! Education 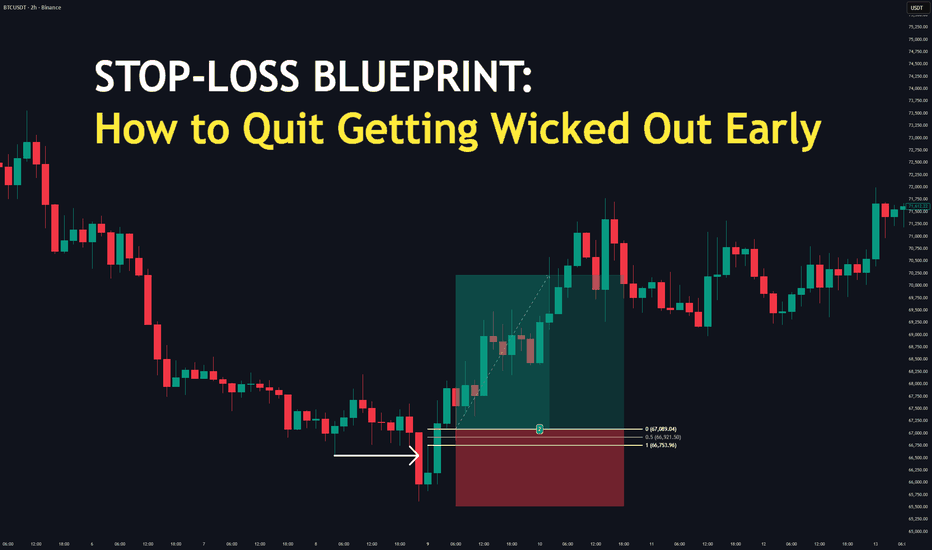
Slanted Head and Shoulder Pattern Take Profit (SECURED)Good day guys,
Just moments ago we were able to reach out take profit level of 4519.21. If you were able to take advantage of this setup, we hope that it was as much as rewarding to you as it was to us. Today, is also FED day and we are waiting for the announcement from Fed Chair Jerome Powell. It is actually his last one, before the new Fed Chair takes over. Based on Polymarket, the rates are looking at being left unchanged. Therefore, this is bearish for Gold.
In conclusion, we could see price action move lower to the next target zone at 4450. Either way, we have secured our bag for this setup. We would like to hear from you below. If you appreciate charts like this, be sure to like and share it. Well we appreciate all you do. And we will see you on the other side.
Best Regards,
Third Eye Traders | Rodrick Short 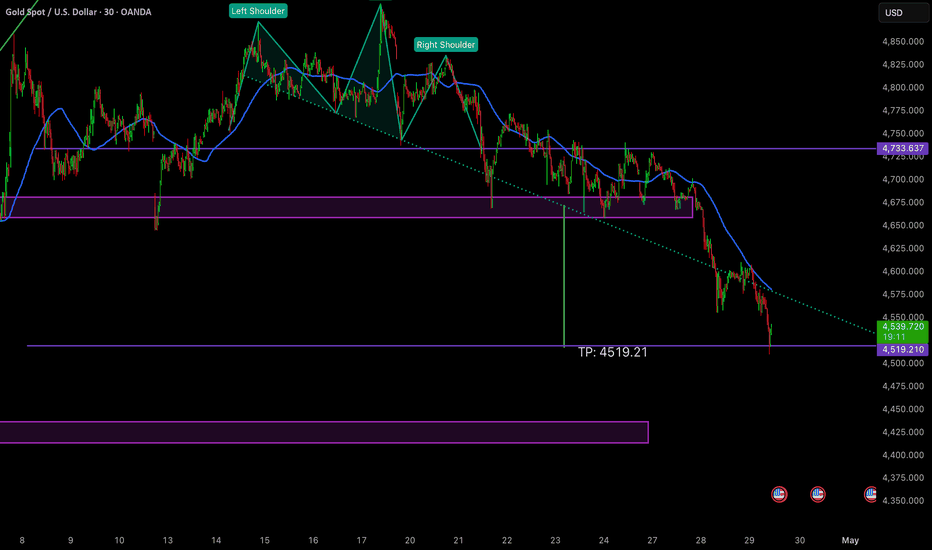
Education 
Long 
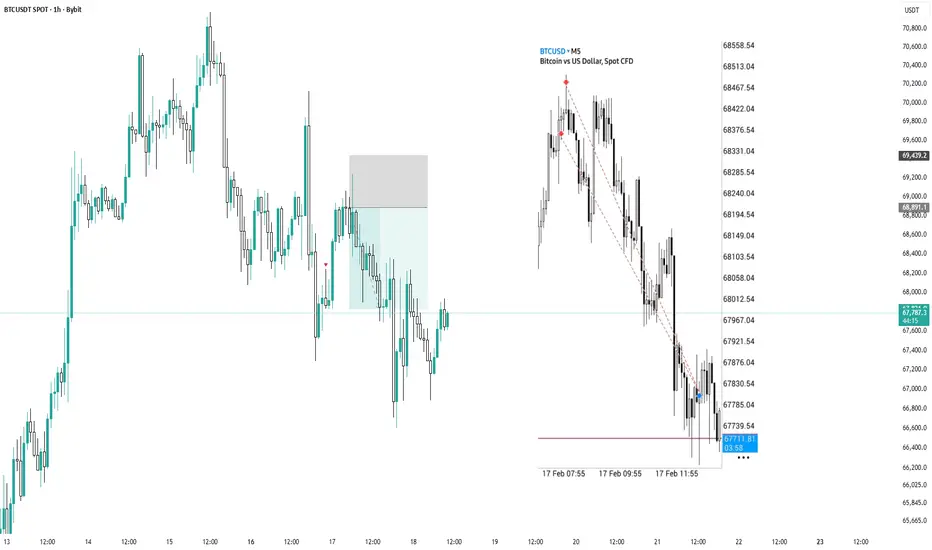
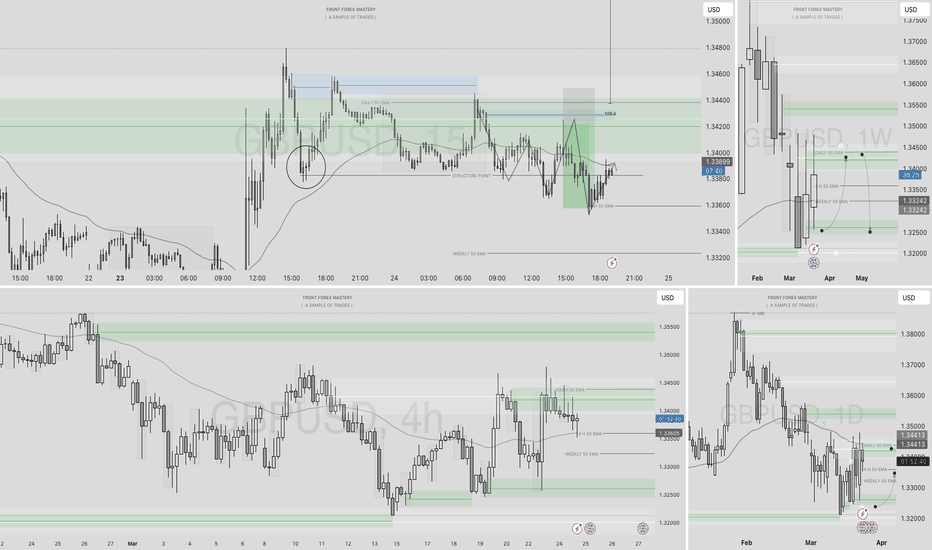
FULL END OF DAY ANALYSIS +4%| GBPUSD SHORT. EURGBP LONG |📅 Q1 | W13 | D24 | Y26
📊 FULL END OF DAY ANALYSIS +4%| GBPUSD SHORT. EURGBP LONG |
🔍 Analysis Framework
This forecast is built using an advanced adaptation of Smart Money Concepts, with a structured and disciplined approach:
• Marking Key Points of Interest (POIs) on Higher Time Frames (HTFs) 🕰️
• Defining a clear, controlled trading range from those zones 📐
• Refining entries on Lower Time Frames (LTFs) 🔎
• Waiting for confirmed Break of Structure (BoS) before execution ✅
This process ensures precision, removes emotional decision-making, and keeps me aligned with the overall market narrative.
💡 Core Philosophy
“Capital management, discipline, and consistency create longevity.”
A strong risk-to-reward model, paired with high-probability execution, is the foundation of sustainable trading 📈🔐
⚠️ Understanding Losses
"Losses are part of the game" — a mathematical certainty 🎲
They don’t define performance. Nor do they define you as a Trader.
They are managed, reviewed, and used as evidence for growth 📊
🙏 Final Note
Appreciate you taking the time to review today’s forecast.
Stay disciplined 🎯
Protect your capital 🔐
— FRGNT 🚀📈
📌 Disclaimer
This content is for educational purposes only and does not constitute financial advice.
It reflects my personal approach to the markets — a tested framework that has supported my own journey to consistent profitability in trading currencies.
This is not a signal service, and all trading decisions remain your own responsibility.
Additionally, this post is not intended to breach ANY TradingView House Rules.
Price TP vs. Equity TP: What’s the Real Difference?In the world of Pine Script, most retail traders stay glued to the candles. But pros? They watch the equity curve. Here is the ultimate challenge: is it better to exit when the price hits a specific level, or when your account has banked enough profit?
1. Price-Based Take Profit
The standard approach. This is the mindset of a trader who views price as an isolated entity. It's based on the premise that the market moves toward "natural targets" that exist independently of your account balance. Such as key resistance levels, indicator based condition or a simple price percentage move calculated on the entry price.
Logic: "Exit the position when the price increases by percentage value from the entry price."
Pros: Honors technical analysis, market structures (support/resistance), and price action.
Cons: Ignores total portfolio exposure and account volatility.
// PRICE BASED
long_condition = close > open
var float entry_price = 0
percentage_value = 5
if (strategy.opentrades==0 and long_condition)
entry_price := close
strategy.entry("Buy", strategy.long, limit = entry_price)
take_profit = entry_price + ((entry_price * percentage_value)/100)
strategy.exit(id = "Sell", from_entry = "Buy", limit = take_profit)
2. Equity-Based Take Profit
This approach shifts the focus from the chart to the portfolio. The exit is triggered when the trade’s profit reaches a specific percentage of your total capital.
Logic: "Exit the position when this specific trade increases my total equity by 2%."
Pros: Direct capital protection; allows for precise mathematical compounding of gains.
Cons: Risk of "premature exit". You might get knocked out of a strong trend that still has technical momentum.
// EQUITY BASED
long_condition = close > open
var float equity_level = 0
percentage_value = 5
if (strategy.opentrades==0 and long_condition)
equity_level := strategy.equity
strategy.entry("Buy", strategy.long, limit = close)
take_profit = equity_level + ((equity_level * percentage_value)/100)
if (ta.crossover(strategy.equity, take_profit))
strategy.exit(id = "Sell", from_entry = "Buy", limit = close)
Which One is the Better Choice?
There is no single "right" answer, but there is a strategic choice based on your trading style:
Price-Based TP: The Sniper’s Approach
Price-based Take Profit is the tool of choice for those who "read" the tape. In this mode, the target is intrinsically linked to the asset: you are betting that the price will hit a specific mathematical level or key resistance.
Focus on Technical Analysis: This is the natural choice if you trade using chart patterns, Fibonacci levels, or momentum indicators. The trade closes because the asset has completed its expected move, regardless of its weight in your portfolio.
Surgical Precision: It allows for the use of pre-placed Limit Orders. This ensures clean execution and reduces slippage, as the broker knows exactly at which cent to exit.
Ideal for Scalping and Intraday: In fast-paced environments, the market doesn't give you time to calculate equity fluctuations. You need fixed, rapid targets.
Equity-Based TP: The Manager’s Approach
Equity-based Take Profit shifts the focus from "what the asset is doing" to "what is happening to my capital." This is a macroscopic, prudent vision typical of those managing complex portfolios or multi-asset strategies.
Focus on Risk Management: Here, the ultimate goal is the Equity Curve. The exit triggers when the monetary gain reaches a psychological or mathematical threshold that satisfies the risk-reward ratio of the overall portfolio.
Real-time Control: Since equity fluctuates based on all open positions (or specific position sizing), execution requires constant monitoring. This often results in market orders or dynamic calculations that flatten the position as soon as the account value hits the target.
Ideal for Swing Trading and Portfolio Management: Perfect for those looking to protect cumulative gains and prevent a single "runaway" asset from exposing the account to painful drawdowns.
If you are developing on TradingView:
Use Price-Based TP if your strategy relies on chart patterns or technical indicators (e.g., RSI, Support/Resistance).
Use Equity-Based TP if you are managing a fund or if your primary goal is steady equity curve growth with minimal drawdown.
Math always beats emotions. If your script only watches the candles and ignores your portfolio, you’re only trading half the picture.
What’s your preference? Let us know in the comments! 👇
Education 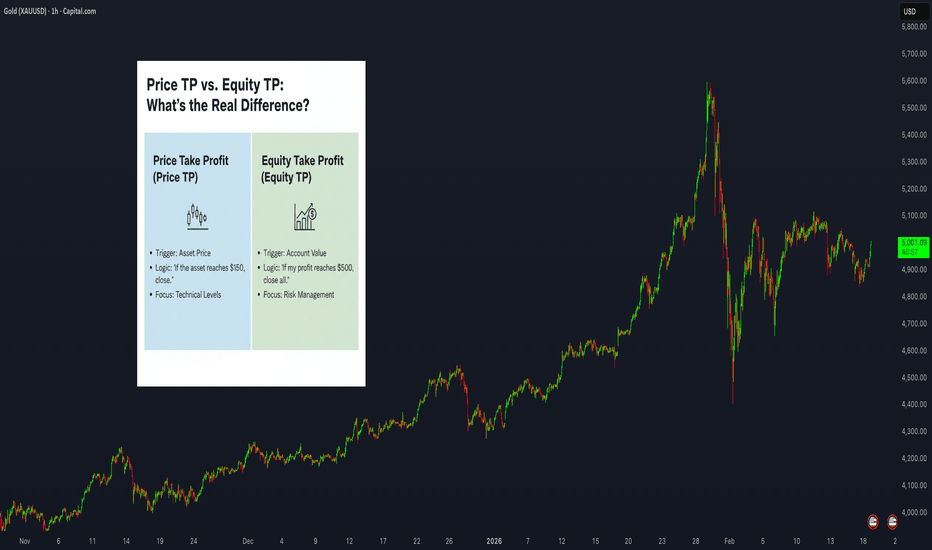
 Long
Long
 Long
Long
Long 
Exit Strategies: Entries Get Attention, Exits Make the MoneyEveryone Obsesses Over Entries. Professionals Obsess Over Exits.
Here's a trading truth that took me years to learn:
You can have a mediocre entry and still make money with a great exit.
You can have a perfect entry and lose money with a poor exit.
Exits determine your actual profit or loss. Entries just get you in the game.
Why Exits Matter More
The Entry Illusion:
Traders spend 90% of their time on entries:
Finding the perfect setup
Waiting for confirmation
Timing the exact moment
The Exit Reality:
But exits determine:
Whether a winning trade stays winning
How much you actually capture
Whether a losing trade stays small
Your overall expectancy
The Math:
A 60% win rate with poor exits can lose money.
A 40% win rate with excellent exits can make money.
It's not about being right. It's about how much you make when right and how little you lose when wrong.
Types of Exits
1. Stop Loss Exit
Predetermined price where you exit to limit loss.
Purpose: Capital preservation
Placement: Where your trade thesis is invalidated
2. Take Profit Exit
Predetermined price where you exit to capture profit.
Purpose: Lock in gains
Placement: At logical targets (resistance, measured moves)
3. Trailing Stop Exit
Stop that moves with price to lock in profits.
Purpose: Let winners run while protecting gains
Types: Fixed distance, ATR-based, percentage-based
4. Time-Based Exit
Exit after a certain time regardless of price.
Purpose: Avoid dead money, force decisions
Example: Exit if trade hasn't moved in 5 days
5. Indicator-Based Exit
Exit when indicator gives signal.
Purpose: Systematic exit based on market conditions
Example: Exit when RSI crosses below 70
6. Discretionary Exit
Exit based on judgment and market conditions.
Purpose: Adapt to changing conditions
Risk: Emotional interference
Stop Loss Strategies
Strategy 1: Technical Stop
Place stop where the trade idea is invalidated.
Examples:
Below support level
Below swing low
Below trendline
Advantage: Logical placement based on market structure
Disadvantage: Can be obvious to other traders
Strategy 2: ATR-Based Stop
Place stop at multiple of Average True Range.
Formula:
Stop = Entry - (ATR × Multiplier)
Example:
Entry: $100
ATR: $2
Multiplier: 2
Stop: $100 - ($2 × 2) = $96
Advantage: Adapts to volatility
Disadvantage: May not align with structure
Strategy 3: Percentage Stop
Place stop at fixed percentage from entry.
Example:
Entry: $100
Stop: 5% below = $95
Advantage: Simple, consistent
Disadvantage: Ignores market structure and volatility
Strategy 4: Time Stop
Exit if trade doesn't move within timeframe.
Example:
"If not profitable within 3 days, exit at market."
Advantage: Avoids dead money
Disadvantage: May exit before move happens
Take Profit Strategies
Strategy 1: Fixed Target
Predetermined price target.
Methods:
Risk multiple (2R, 3R)
Resistance level
Round number
Advantage: Clear, removes emotion
Disadvantage: May leave money on table
Strategy 2: Scaled Exit
Exit in portions at different levels.
Example:
1/3 at 1R
1/3 at 2R
1/3 trailing
Advantage: Locks in some profit, lets rest run
Disadvantage: More complex management
Strategy 3: Trailing Stop
Let profits run with moving stop.
Types:
Fixed distance trailing
ATR trailing
Moving average trailing
Swing point trailing
Advantage: Captures extended moves
Disadvantage: Gives back some profit on reversals
Strategy 4: Indicator Exit
Exit when indicator signals.
Examples:
RSI overbought
MACD crossover
Moving average cross
Advantage: Systematic, removes emotion
Disadvantage: May lag price action
AI-Enhanced Exit Strategies
1. Dynamic Stop Optimization
AI adjusts stops based on:
Current volatility
Time in trade
Profit accumulated
Market regime
2. Optimal Target Calculation
AI analyzes:
Historical move distributions
Current momentum
Resistance levels
Probability of reaching targets
3. Exit Signal Ensemble
AI combines multiple exit signals:
Technical indicators
Price action
Volume patterns
Time factors
4. Regime-Adaptive Exits
AI adjusts exit strategy based on market regime:
Trending: Wider trailing stops
Ranging: Tighter fixed targets
Volatile: Faster exits
Exit Mistakes
Moving Stop Loss Away — "I'll give it more room" = hoping, not trading. Set stop before entry, never move it further away.
Taking Profits Too Early — Fear of giving back gains leads to cutting winners short. Use trailing stops to let winners run.
No Exit Plan — Entering without knowing where you'll exit. Define all exits BEFORE entering.
Emotional Exits — Exiting based on fear or greed, not plan. Automate exits or use strict rules.
Same Exit for All Trades — Using identical exit regardless of setup or conditions. Match exit strategy to trade type and market conditions.
Exit Planning Framework
Before Every Trade, Define:
1. Initial Stop Loss
Where is the trade idea wrong?
What's the maximum acceptable loss?
2. Primary Target
Where is the logical profit target?
What's the risk:reward ratio?
3. Trailing Strategy
How will you protect profits?
When does trailing begin?
4. Time Limit
How long will you hold?
When do you exit regardless of price?
5. Invalidation Conditions
What would change your thesis?
When do you exit early?
Exit Scenarios
Scenario 1: Trade Goes Your Way
Move stop to breakeven after 1R
Trail stop as price advances
Take partial profits at targets
Let remainder run with trail
Scenario 2: Trade Goes Against You
Stop loss hits = exit immediately
No hoping, no averaging down
Accept the loss, move on
Scenario 3: Trade Goes Nowhere
Time stop triggers
Exit to free up capital
Reassess if setup is still valid
Scenario 4: Conditions Change
Original thesis no longer valid
Exit regardless of profit/loss
Don't hold for wrong reasons
Key Takeaways
Exits determine actual profit/loss — entries just get you in the game
Define all exits BEFORE entering any trade
Never move stop loss further away — only closer
Use trailing stops to let winners run while protecting gains
Match exit strategy to trade type and market conditions
Your Turn
What's your biggest challenge with exits?
Do you tend to exit too early or hold too long?
Share your exit strategies below 👇
 Education
 Short
Short
 Long
Long