• Products
  • Community
  • Markets
  • Brokers
  • More
Get started
  • Markets
  • /Romania
  • /Stocks
  • /Ideas
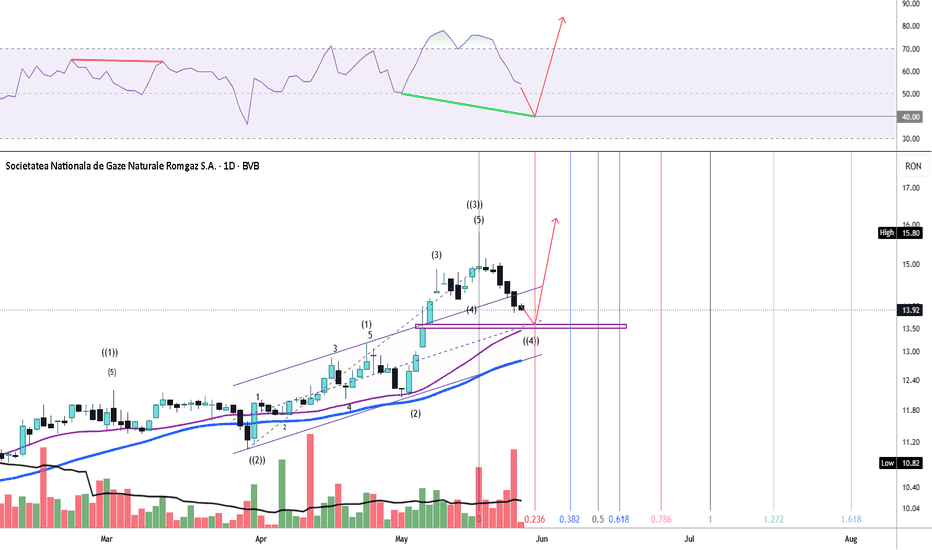
SNG: Wave ((4)) Correction Within a Bullish StructureSNG: Wave ((4)) Correction Within a Bullish Structure After completing a strong impulsive advance into ((3)), SNG appears to be developing a controlled Elliott wave ((4)) pullback toward a major confluence support zone near 13.45. The correction is currently aligned with: channel axis support MA30 dynamic support prior breakout area RSI continues to cool from overbought territory and may retest the 40 area, supporting the scenario of a momentum reset rather than a trend reversal. Volume behavior remains constructive: declining participation during the pullback no clear capitulation or aggressive distribution yet As long as support holds, the preferred scenario remains: → wave ((4)) completion near current levels → resumption of the uptrend toward the 15.8–16 resistance zone in wave (5). A high-volume breakdown below support would invalidate the short-term bullish structure and increase the probability of a deeper retracement toward MA50.
BVB:SNGLong
by zylvyu66
Updated
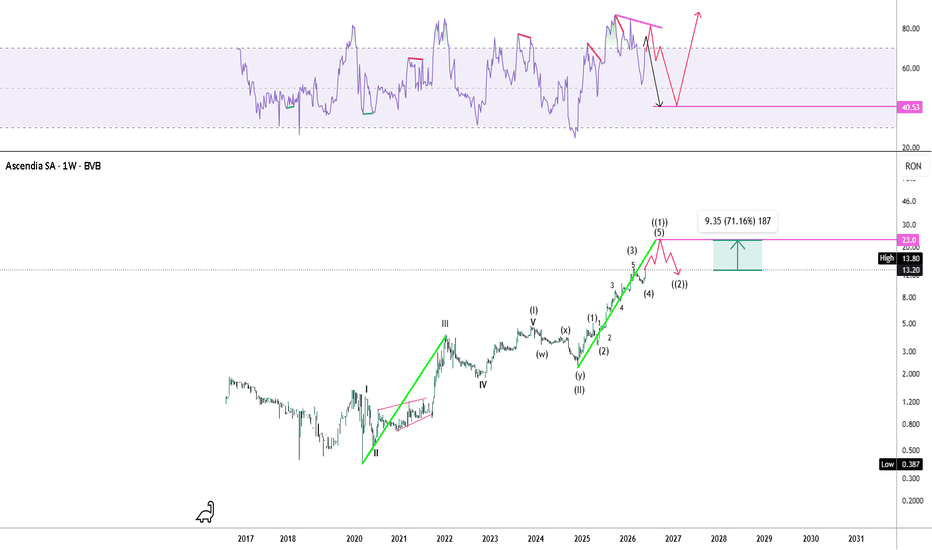
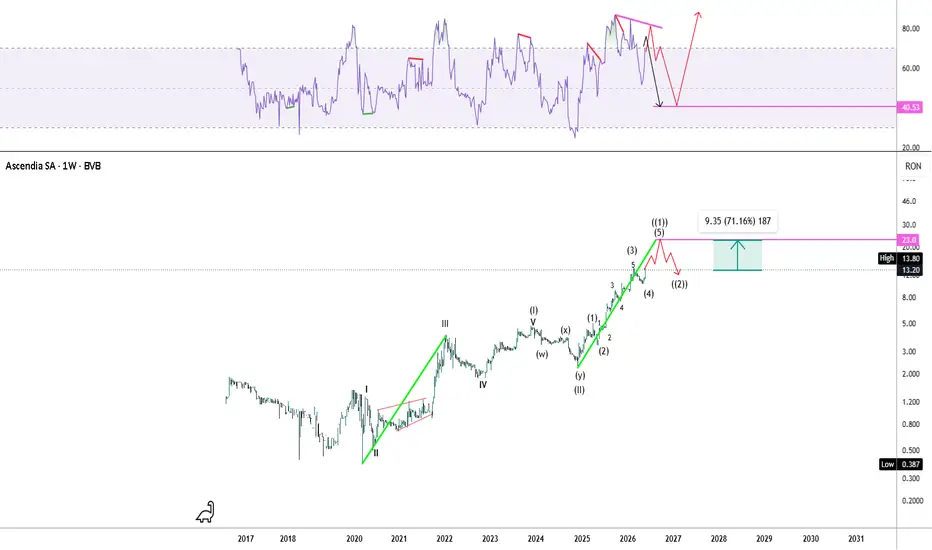
"How much higher can ASC go?"A friend asked me yesterday: "How much higher can ASC go?" ASC is one of those charts that Elliott Wave practitioners love: clean structure, clear wave relationships, and relatively easy labeling. My current interpretation is that price is still developing wave (5) of ((1)) within Primary Wave III. Using one of Elliott's common guidelines, where Wave 5 can sometimes equal Wave 1 in length, a potential target emerges around 23 RON. Of course, 5 = 1 is not a rule, only a guideline. To strengthen this projection, I looked for additional confluences. Applying the principle of similarity, the two neon-green segments show comparable price expansions. This gives us a second confluence near the same target area. A third possible confluence comes from time symmetry, where the duration of Wave III could be similar to the duration of wave ((1)). I consider this a weaker signal, but if price reaches 23 RON around October 2026, I'll gladly revisit this forecast. The chart history is still limited, so I have not yet identified stronger clusters. Important: 23 RON should not be viewed as a fixed destination. It is an optimistic projection based on the current wave structure and must always be evaluated in the context of market conditions and company fundamentals. RSI adds another piece to the puzzle. The indicator is already overbought and showing bearish divergence, a common characteristic near the end of a cycle. I will consider wave (5) of ((1)) complete when RSI fails to reclaim the 70 level. Until then, I expect wave (5) to continue building and potentially generate one or two additional divergences. As for moving averages (MA30, MA50, MA100 and MA200), if wave (5) extends and completes ((1)), price will continue moving away from its averages. Eventually, those averages tend to act as a magnet, increasing the probability of a corrective phase once the impulse is exhausted. This remains a working Elliott Wave scenario, not a prediction.
BVB:ASCLong
by zylvyu66
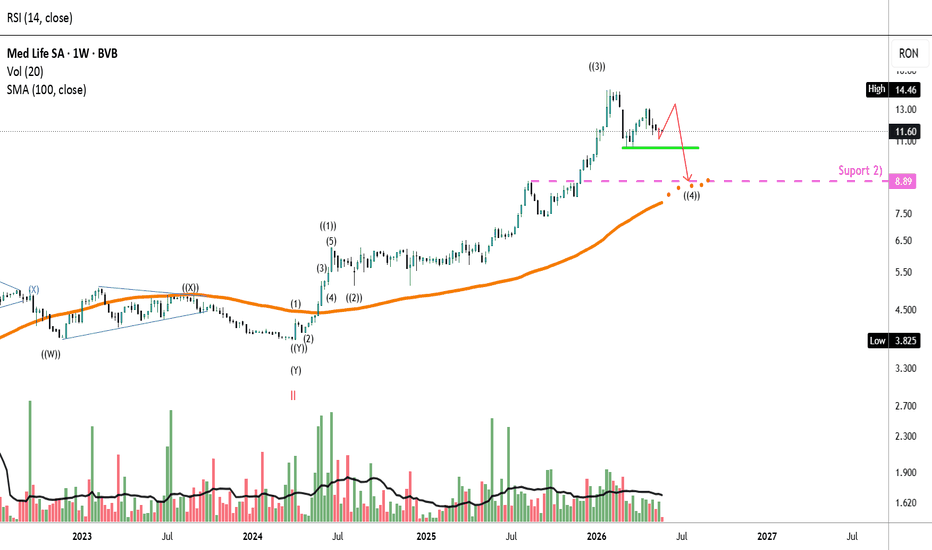
Medlife SA , Volume vs MA20 — Key ReadVolume vs MA20 — Key Read Volume has dropped below the 20-period average after the peak, with weak participation on rebounds. → No real demand → Buyers are not stepping in → Rallies lack conviction Conclusion: Current structure suggests distribution, not accumulation, supporting a corrective phase (wave 4) rather than trend continuation.
BVB:MShort
by zylvyu66
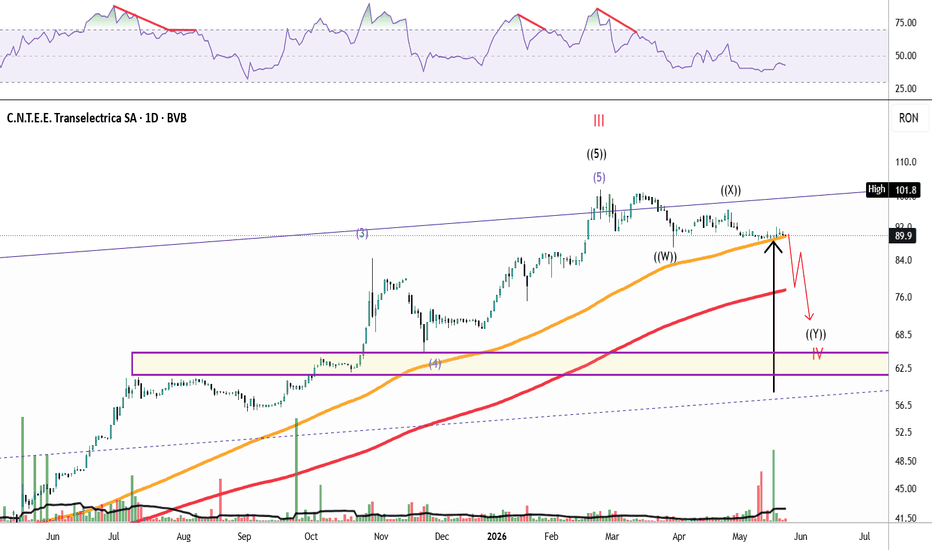
TEL (BVB) – Key signal at resistanceTEL (BVB) – Key signal at resistance At the area marked by the black arrow (~89–90), we see: High volume spike Very small candle (doji / indecision) This combination is not neutral in context. After a completed impulsive move ((5)) and a sequence of lower highs, price tests former support turned resistance — but fails to advance despite strong participation. 👉 Interpretation: Absorption on the rebound = likely distribution Large players are using liquidity to exit, not accumulate. What matters next: Failure to break above 90 → bearish continuation Break below 88 → confirms downside leg (C) Only a strong reclaim above 92 invalidates this view Conclusion: High volume + doji at resistance suggests inefficient buying pressure → bearish bias in the short term.
BVB:TELShort
by zylvyu66
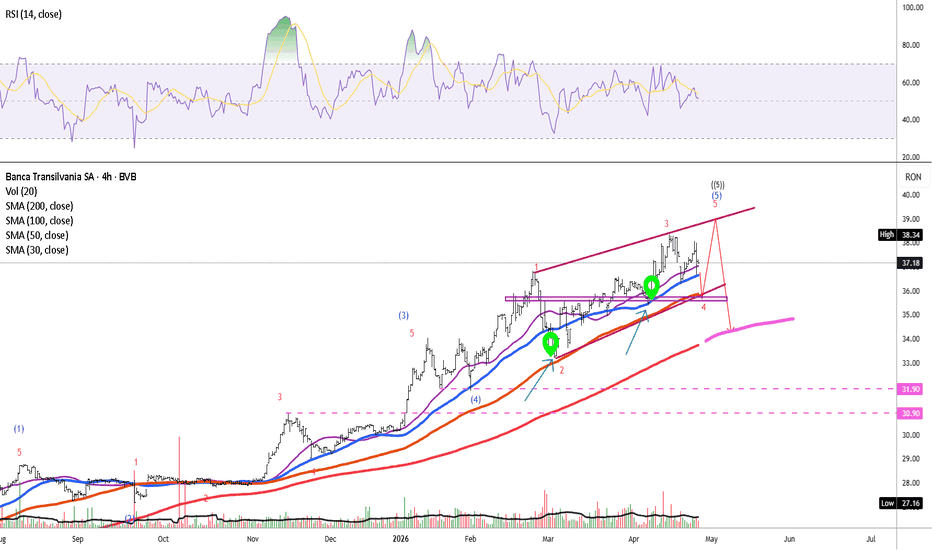
TLV – technical signals of trend exhaustion and likely correctioTLV – technical signals of trend exhaustion and likely correction The current structure suggests a mature trend entering a terminal phase: • RSI shows persistent bearish divergence → clear momentum loss • Price is forming an ending diagonal in wave 5 → typical end-of-trend pattern • Repeated reactions at key moving averages (MA30, MA50, MA100) → dynamic support still active, but weakening • Significant distance from MA200 → room for mean reversion Interpretation: The long-term trend remains bullish, but short-term correction risk is elevated. Key levels to watch: • ~36 → first reaction zone (support + MA cluster) • ~31–32 → major equilibrium area (prior structure / potential accumulation) • MA200 → secondary target if selling pressure accelerates Conclusion: This is not an optimal area for initiating new long positions. Rather, it favors: – profit-taking – or waiting for lower re-entry levels Typical context: strong trend + RSI divergence + terminal structure = increased probability of correction #TLV #BVB #TechnicalAnalysis #RSI #ElliottWave
BVB:TLVShort
by zylvyu66
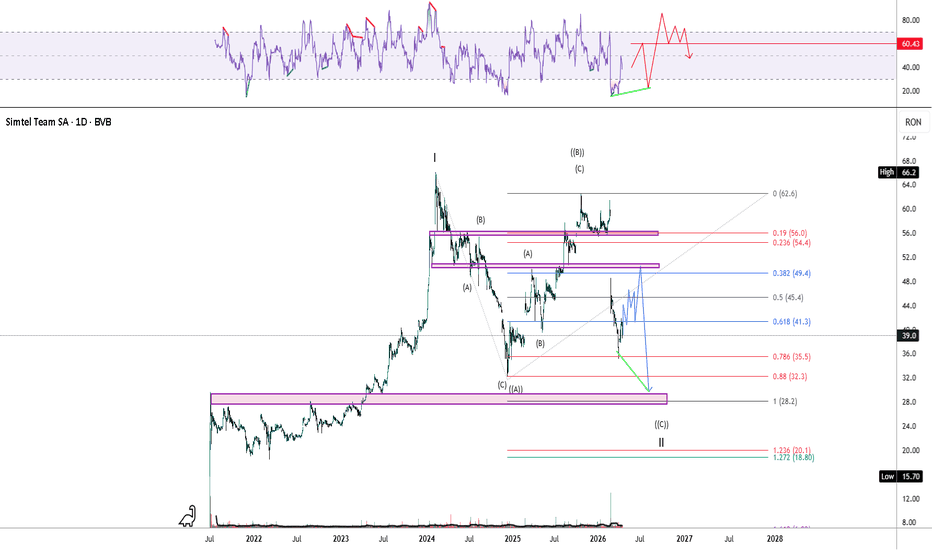
SMTL correction, but to what level?Strong impulse up to the ~60–66 zone After that: wide range + high volatility Strong impulse up to the ~60–66 zone After that: wide range + high volatility Repeated reactions at: 55–60 (resistance) 49–50 (pivot) 41–35 (intermediate support) Internal structure: heavy overlapping (not a clean impulse) 👉 Raw technical conclusion: we are in a correction, not a new impulse Logical targets (aligned with your levels): 41 → first serious test 35 → critical support holds 30–28 → probable final zone
BVB:SMTLShort
by zylvyu66
11
I wouldn't think to go long on SNPI wouldn't think to go long on SNP at this time. If already in, watch and see what happens. But I, personally, would not enter long at this price. If perhaps price was to pullback to the grey zone, depending on how it falls, how fast, what happens in that area, etc. you may rethink and possibly look for longs. But it's quite possible that if/when price begins the downtrend, it may push through this zone. Price will definitely react, but don't think just because price is in this zone, it's now a long. No, at that point think the downtrend is likely to continue, unless of course, the day to day price action says otherwise. TLDR: don't go long here. If you wish to long, wait for pullback to grey area, then look to see if price is more likely to continue lower or if it has good odds of attacking the all time high.
BVB:SNPShort
by imGifted
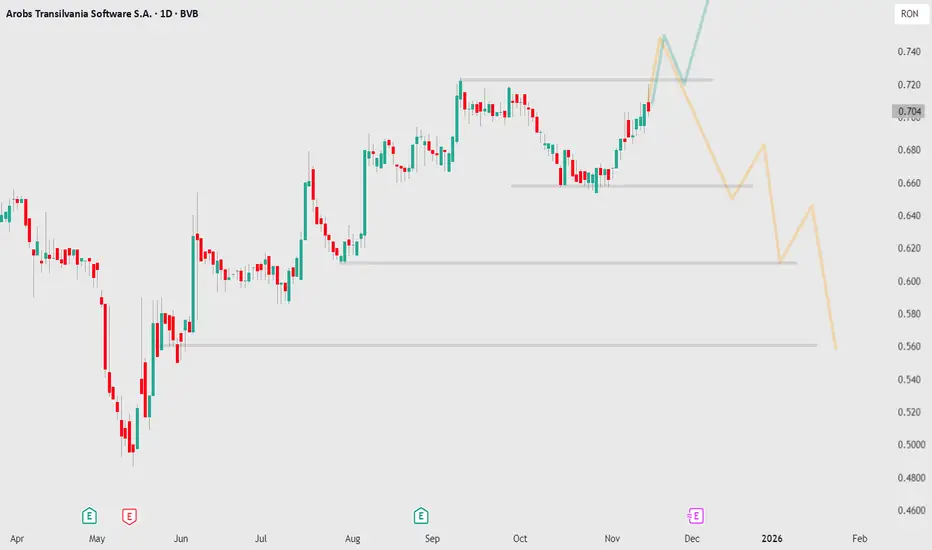
AROBS Long/Short Depending on Short-Term MoveIf price breaks above prior high and stays above = look to long. If price breaks above then snaps back down = look to short. If short, look to grey lines for support (slowing down price or potentially reversing price). Need to watch price closely at these levels to see if price wants to simply pullback, then continue lower. Or continue the higher timeframe uptrend higher. Would be a decent short. But needs to be watched as there are plenty of levels where price may encounter buyers.
BVB:AROBS
by imGifted
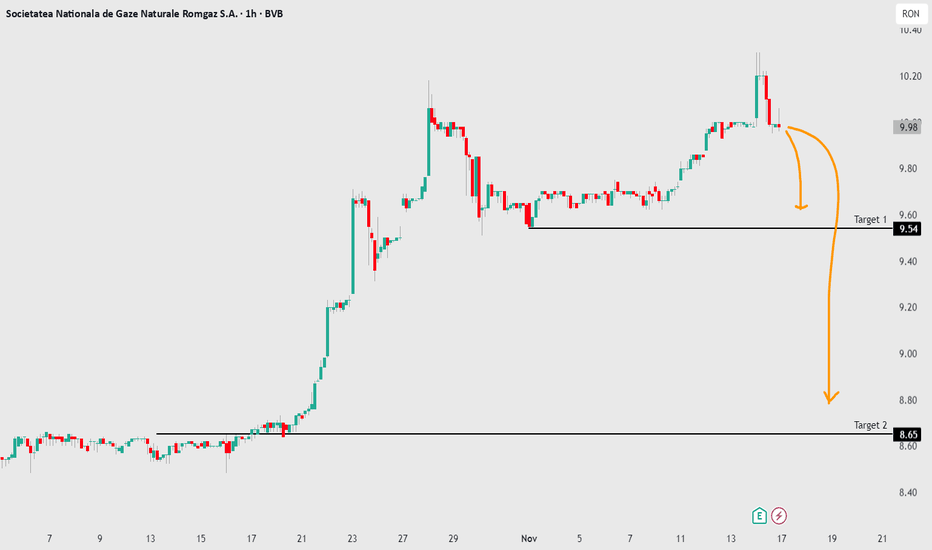
SNG down to 9.50 then 8.65Looks like a good short-term short, worth trying out and seeing how long one can hold. First target 9.50. See how price reacts here. If price breaks 9.50, possible short term pullback, or depending on how price develops, cut short, and look to long. Depending on how bearish this can stay (assuming price stays below 9.50) a target of 8.65 looks reasonable in the short-term. Worth a short, closely watched.
BVB:SNGShort
by imGifted
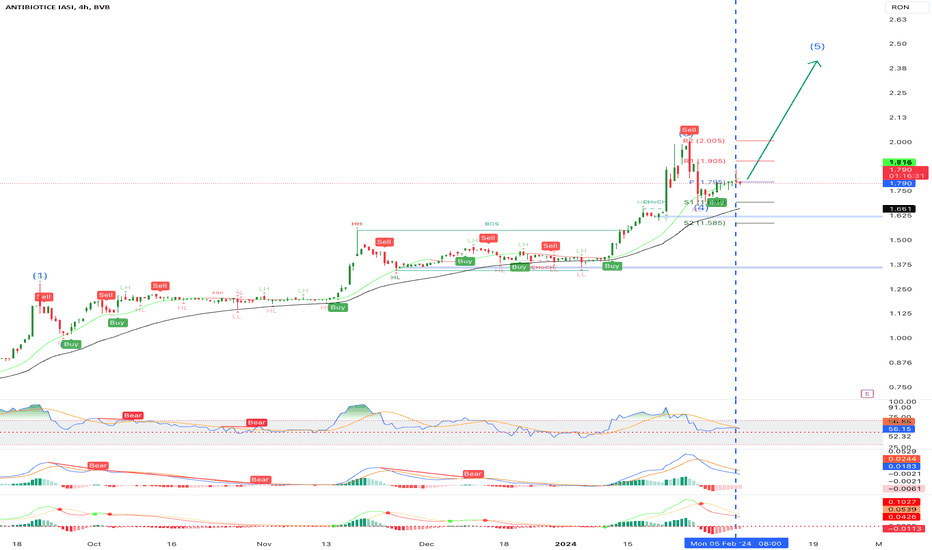
ATBBullish Momentum based on a multimple technical indicators
BVB:ATBLong
by DuoB
Electrica after a bearish divergence Major bearish divergence on the daily, expecting 9.05 soon.
BVB:ELShort
by anghelcontiu
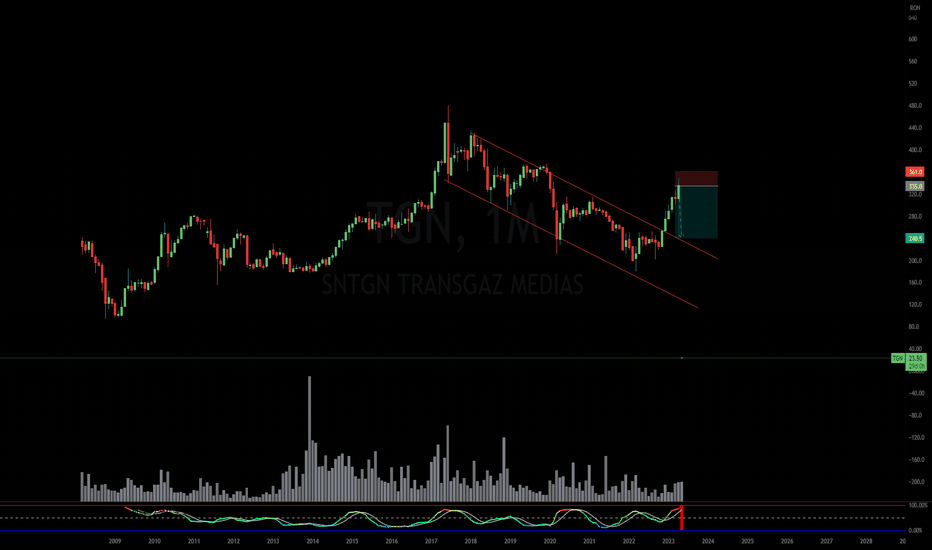
SNTGN Medias / RO / Q4 ForecastExpecting a retracement towards the upper boundary of the descending channel.
BVB:TGNShort
by dicetrade
11

Made by humans

Select market data provided by ICE Data Services. Select reference data provided by FactSet. Copyright © 2026 FactSet Research Systems Inc.Copyright © 2026, American Bankers Association. CUSIP Database provided by FactSet Research Systems Inc. All rights reserved. SEC filings and other documents provided by Quartr.© 2026 TradingView, Inc.

More than a product
  • Supercharts
Screeners
  • Stocks
  • ETFs
  • Bonds
  • Crypto coins
  • CEX pairs
  • DEX pairs
  • Pine
Heatmaps
  • Stocks
  • ETFs
  • Crypto coins
Calendars
  • Economic
  • Earnings
  • Dividends
  • IPOs
More products
  • News Flow
  • Portfolios
  • Fundamental Graphs
  • Yield Curves
  • Options
  • Macro Maps
  • Pine Script®
Apps
  • Mobile
  • Desktop
Community
  • Social network
  • Wall of Love
  • Refer a friend
  • House Rules
  • Moderators
Ideas
  • Trading
  • Education
  • Editors' picks
Pine Script
  • Indicators & strategies
  • Wizards
  • Freelancers
  • Paid Spaces
Tools & subscriptions
  • Features
  • Pricing
  • Market data
  • Gift plans
Trading
  • Overview
  • Brokers
  • Brokers comparison
  • The Leap
Special offers
  • CME Group futures
  • Eurex futures
  • US stocks bundle
About company
  • Who we are
  • Space mission
  • Blog
  • Help Center
  • Careers
  • Media kit
Merch
  • TradingView store
  • Tarot cards for traders
  • The C63 TradeTime
Policies & security
  • Terms of Use
  • Disclaimer
  • Privacy Policy
  • Cookies Policy
  • Accessibility Statement
  • Security tips
  • Bug Bounty program
  • Status page
Business solutions
  • Widgets
  • Charting libraries
  • Lightweight Charts™
  • Advanced Charts
  • Trading Platform
Growth opportunities
  • Advertising
  • Brokerage integration
  • Partner program
  • Education program
Community
  • Social network
  • Wall of Love
  • Refer a friend
  • House Rules
  • Moderators
Ideas
  • Trading
  • Education
  • Editors' picks
Pine Script
  • Indicators & strategies
  • Wizards
  • Freelancers
  • Paid Spaces
Business solutions
  • Widgets
  • Charting libraries
  • Lightweight Charts™
  • Advanced Charts
  • Trading Platform
Growth opportunities
  • Advertising
  • Brokerage integration
  • Partner program
  • Education program
Look FirstLook First