


SSI bounced back back from AvwapHOSE:SSI bounced back back from A-VWAP
There are 2 scenario:
- Go up and re-test upper band or higher
- Pullback to lower band
We have 2 on-going trades. Ready to sell with a little loss in sideways market.


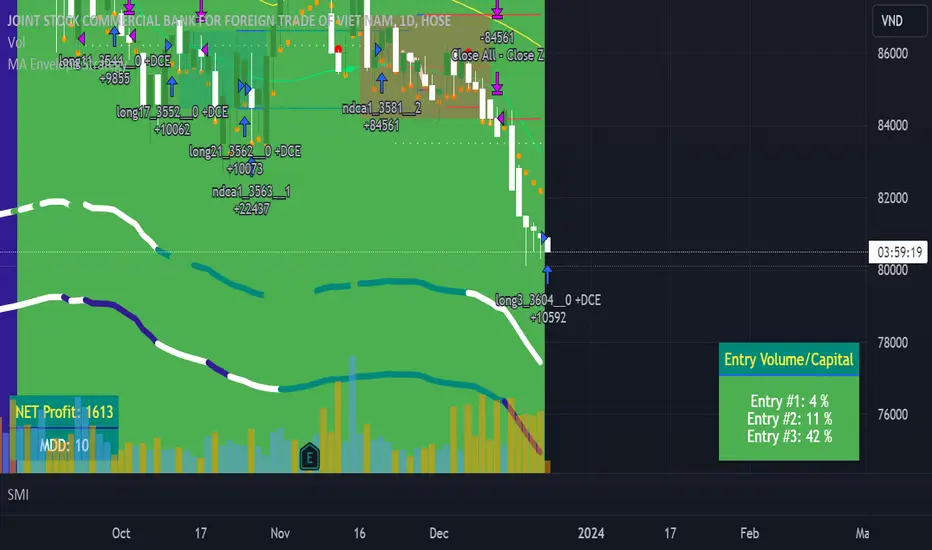
VCB LongWe can start to open a long position (buy) here for HOSE:VCB
Super risk position, size ~ 5-10%
 Long
LDG - short-possibly 3 times divided from this priceElliott said in this case, the lowest point is the point that we do not see in the chart but at some point much much lower, so this is really not a good moment to grasp the stock for the long time holding.
We should wait for it to finish the C in M chart, which is likely at much lower from this point. Be careful.
 Short

HAG-LONG-First motive waveThe beginning of M frame introduced a triangular wave indicating that there is only one wave with the same direction with the main trend. It's finishing an inpulse wave downward indicates that the big downtrend ended totally and the market has beginning a new up-trend in M frame, which is moving in 5th (Daily) in 1st (Weekly) in 1st (Monthly).
 Long


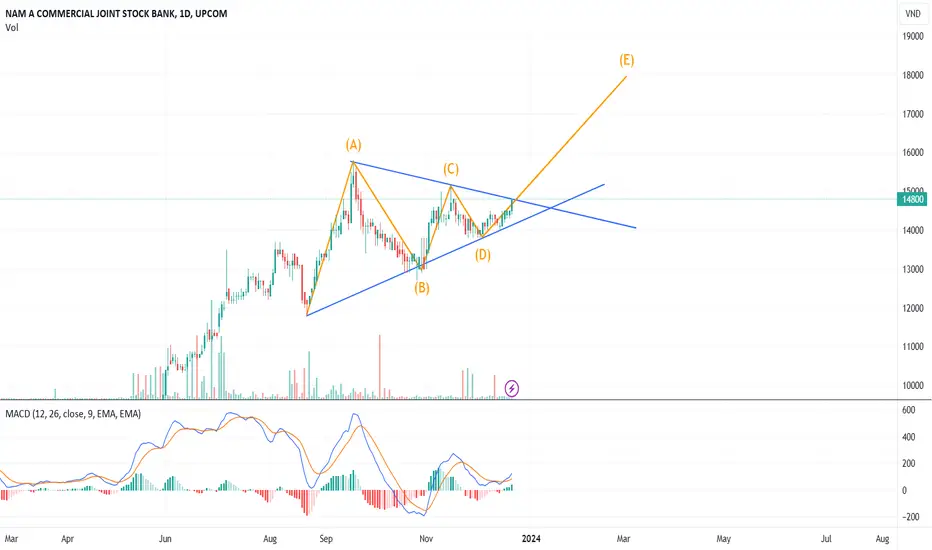
NAB UPTRENDThis is the first time I published my idea for the Vietnam stock market. And I hope this is helpful for you guys in trading.
NLong
MBBwww.tradingview.com
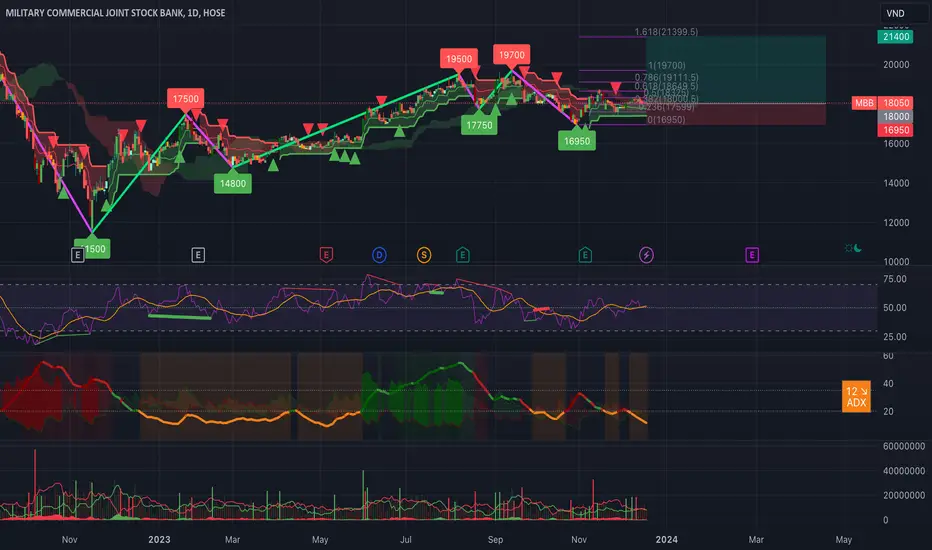
MBB shares are shares of Military Commercial Joint Stock Bank, one of the largest banks in Vietnam. MBB has a good operating history, high reliability and is considered one of the banks with good growth potential in the future.
However, it should also be noted that the stock market always has potential risks. Investing in stocks needs to be considered carefully, based on the following factors:
General situation of the stock market: The stock market is in a period of strong
 Long
SSI pullbackSSI currently has a continuing pullback, We can wait for a reversal sign at 30-31.5 range.
In the worst case, we will have a solid pullback to Fibonacci level 0.5 or 0.618. We cannot tell where the market will go but we can wait for the reversal sign and enter at a solid breakout as a confirmation signal.
Long
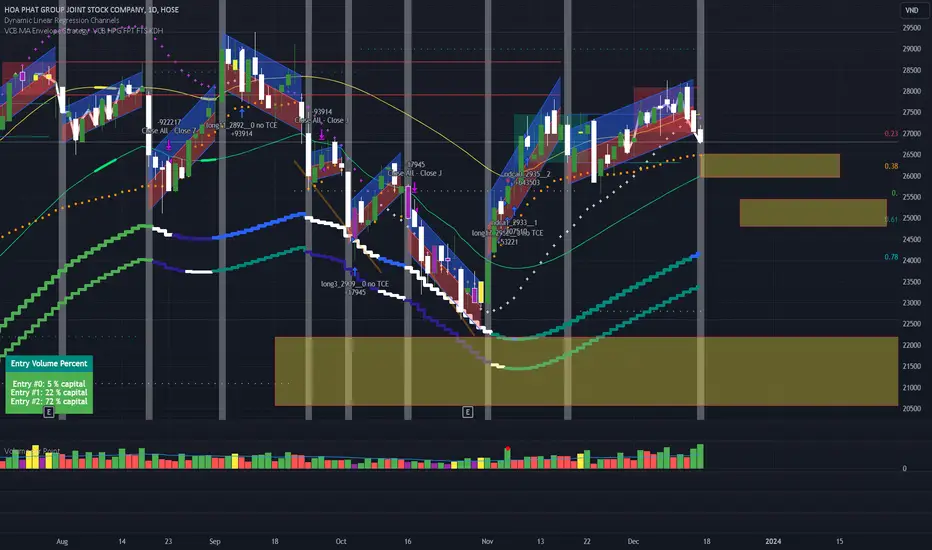
#HPG A pullback expectedWith HPG, I expect price range 25-26x will be a good support area. With current strong up side movement, a shallow pullback is expected then price will breakout from A-vwap and lower MA band.
We are locking for a reversal signal to revert current down side movement.
With sideways strategy activated, I will wait and buy MA lower band breakout.

FPT LongVery solid upside movement for FPT, buy high sell higher is the only choice maybe.
The worst case scenario is 93.3 - 94 range as support level.
Support area at 90 and 91 range as bullish 0.5 Fibonacci Retracement level.
 Long

VCB 0.5 or 0.618 Fibonacci Retracement ?With VCB 0.5 or 0.618 Fibonacci retracement is forming, I expect price has a good recover to lower band (green line) above from current price (0.5 level) or a little bit lower (0.618 level). We can wait for a lower band breakout then buy and sell at upper band as long as sideways strategy bias still active.
Beware both of market-risk sentiment lines are in purple (bearish) signs.
Long
ACB-B Corrective wave in Monthly chartACB is in its B corrective wave when we look at the monthly chart. It's Elliott principle that there is a possibility for a B expanded flat where the end point of B might be over the peak 5th wave, then it will move down following a C with 5 waves downward in smaller wave level (W frame)
 Short

VCB-leading bank, is moving to an end of 1st monthly waveThis is what I found out using Elliott waves principles, it is moving to a position for a big short in monthly frame, which brings no good to anyone

CMS is going to Cup & Handle patternCMS is going to Cup & Handle pattern, let see will it be finished ;)
 Long

HAG ready for correctionCurrently, we see that HAG is at the over bough zone. Beside that, RSI & MFI indicator let us know that it 's divergence.
I expected, price could be reach to 13.350 then correct. Let see!
Short


VIC flies high in late 2023 and 2024 and will develop stronglyVIC flies high in late 2023 and 2024 and will develop strongly VIC flying high at the end of 2023 and 2024 will develop strongly, according to the accumulated price line and with the actual situation, the group is on the right path to long-term development.
 Long

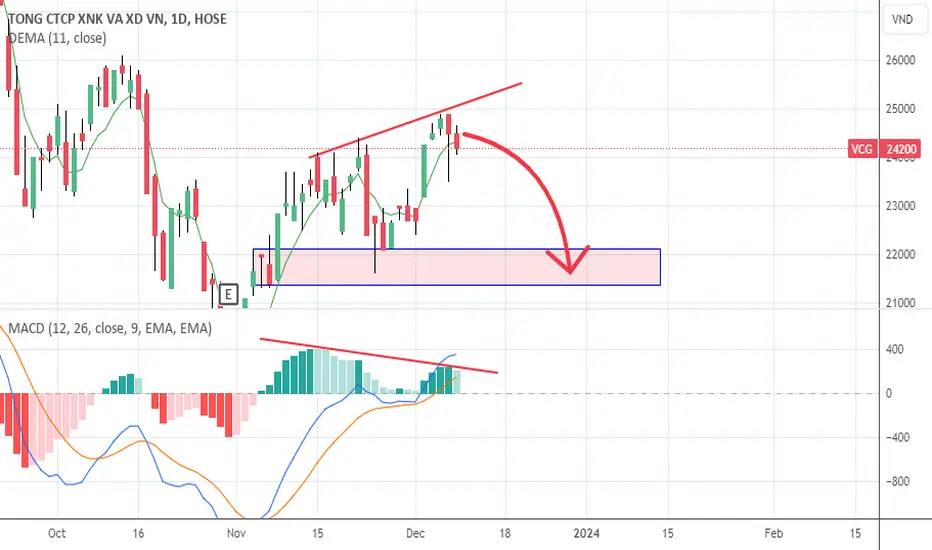
short VCGThere is a bearish divergence on this stock, making the immediate support zone a likely next target.
 Short
CAP-Yen Bai is in an ending diagonal, potential for M correctionCAP-Yen Bai with a high divident proportion, but it's in an ending diagonal and potential in a big correction


VPB - Entry Position From Dec23 to Jan24HOSE:VPB
This position base on entry signal of MACD - RSI - ADX with support from personal custom strategy
Entry: 19k
TP: 23k (~21%)
SL: 17k (~10%)
Est on Week 2 ~3 of Jan 2024
 Long
