Introduction to line break charts
A line break chart is a Japanese chart type that disregards time intervals and only focuses on price movements. It is similar to the Kagi and Renko charts by the calculation method but differs in its appearance.
What are line break charts?
Line break charts form a series of up and down bars (referred to as lines). Up lines represent rising prices, and down lines represent falling prices. New, confirmed lines only form on the chart when closing prices break the range covered by previous lines.
You can control the number of past lines used in the calculation via the "Number of lines" input in the chart settings. The typical "Number of lines" setting is 3, which means that the chart forms a new up line only when the closing price is above the high prices of the last three lines, and forms a new down line when the closing price is below the past three lines' low prices.
If the current price is higher, it is an up line and if it is lower, it is a down line. If the current closing price is the same or the move in the opposite direction is not large enough to warn about a potential reversal, then no new line is drawn.
Line calculation method
Each new closing price has three possible outcomes
- New line, same color: When price extends in the same direction.
- New line, different color: When the price change is large enough to warrant a reversal.
- No new line: When price does not change or the reversal is not large enough to warrant a new line.
The user defines the "Number of lines" value. The chart compares the current close to the high and low values from the "Number of lines" previous lines. If the input's value is 3, the calculation compares the current close to the highs and lows of the latest three confirmed lines, forming a new up or down line only when the close is above the highs or below the lows. The appropriate line is then drawn (or not drawn) based on the above guidelines.
Uses of line break charts
Like Kagi and Renko charts, line break charts help filter out noise and make price movements easy to understand.
Support and resistance: Line break charts reveal areas of support and resistance.
Breakouts: Occur when bars begin to generate in a defined direction after a period of trading within a support and resistance bound trading range.
Classic chart patterns: Allows to spot classic chart patterns.
Line break charts settings
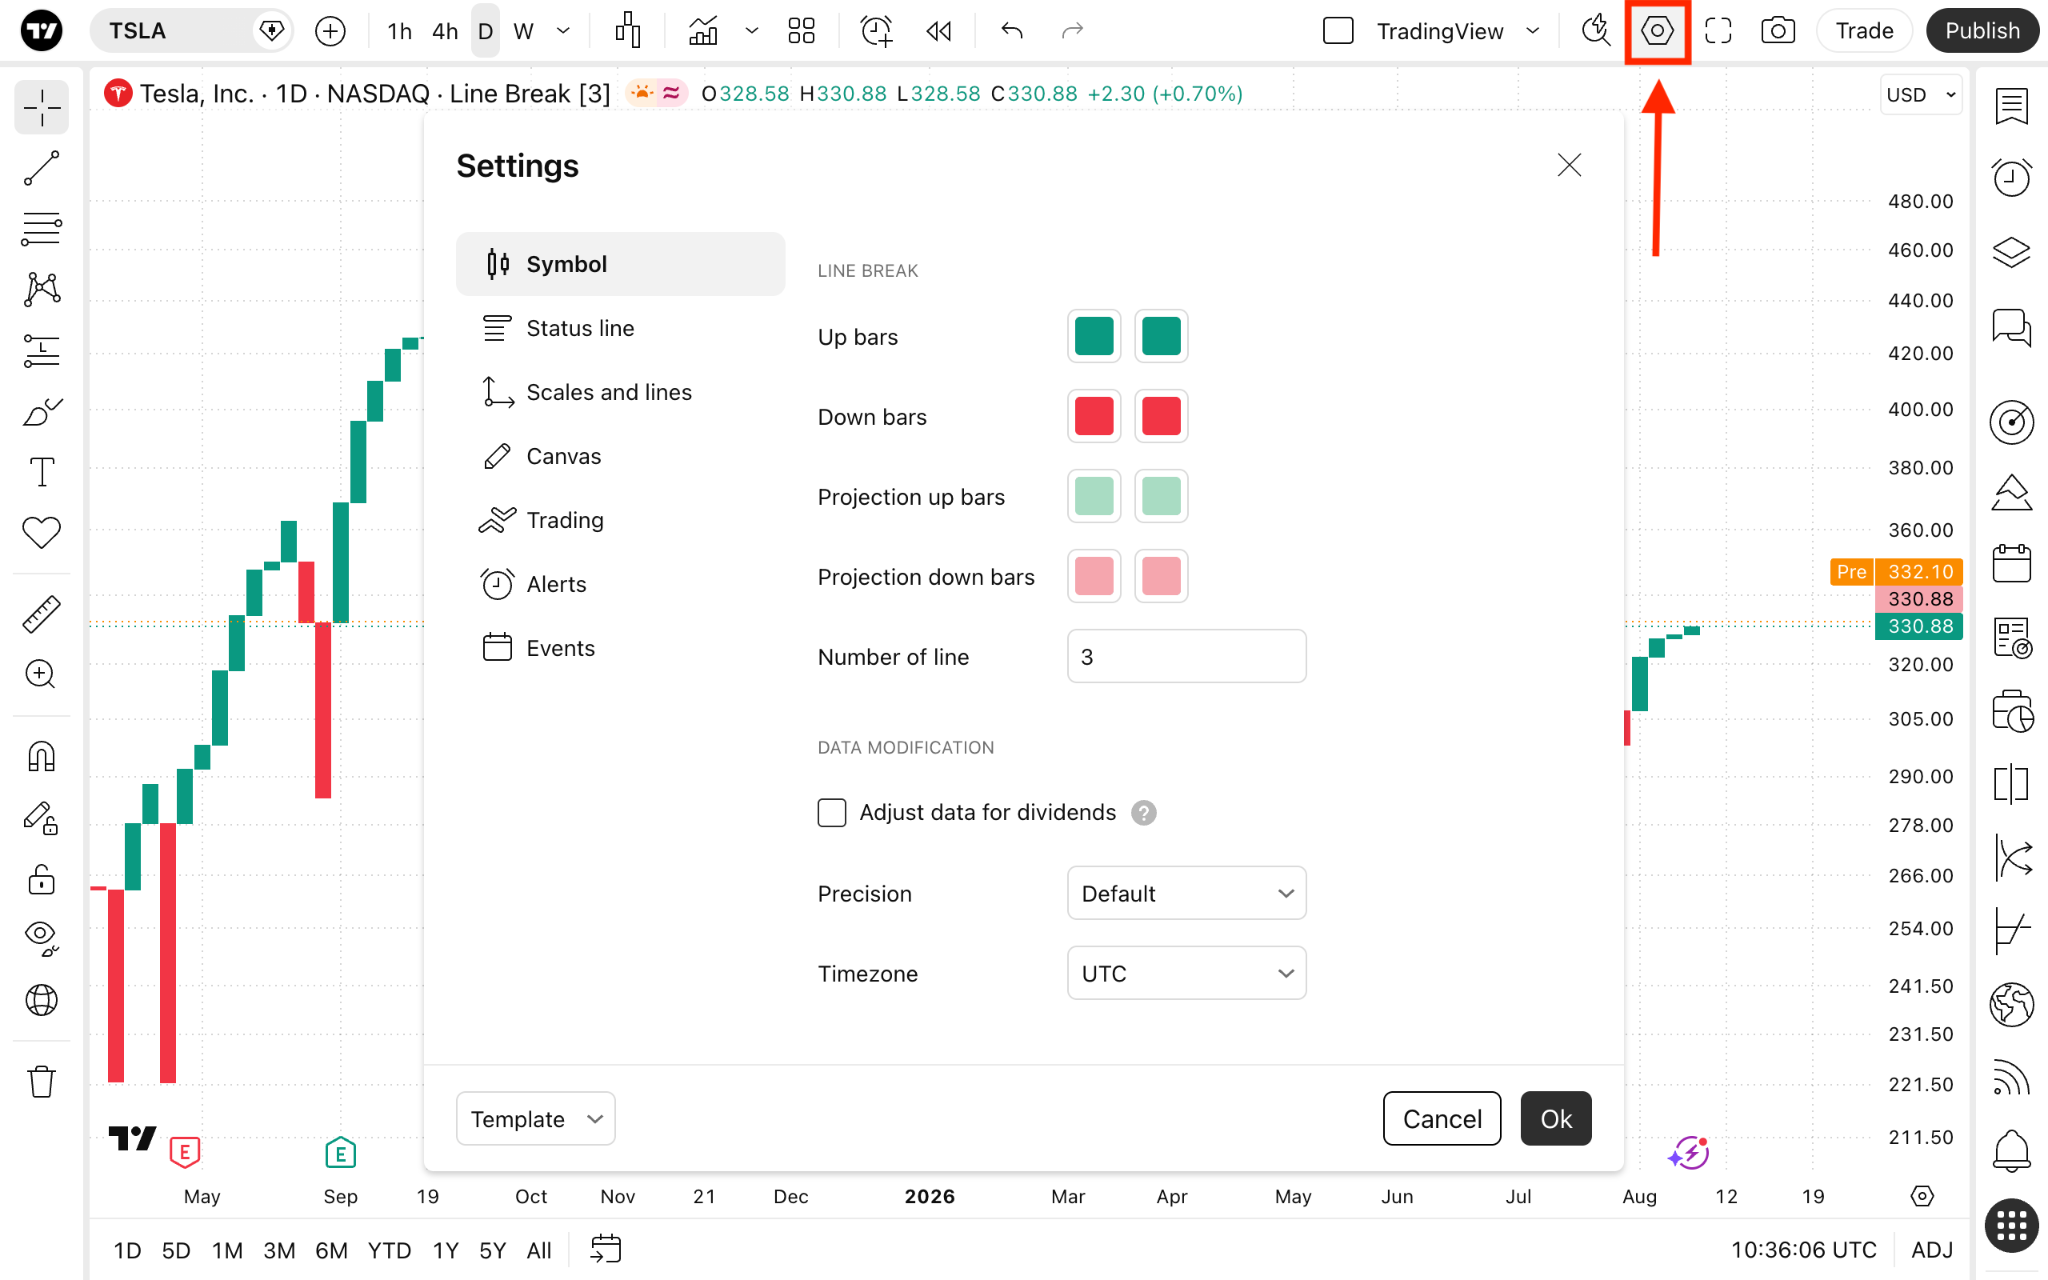
- Up bars: Changes the color and outline of up bars.
- Down bars: Changes the color and outline of down bars.
- Projection up bars: Changes the color and outline of projected up bars.
- Projection down bars: Changes the color and outline of projected down bars.
Also read: