Bullish Dragonfly Doji: recognizing lower price rejection in a downtrend
The Dragonfly Doji is a single-candle pattern with a long lower shadow and an open and close at or near the high of the session. After a downtrend, it shows that sellers pushed the price down sharply but buyers brought it all the way back by the close. Traders read it as a possible sign that the decline is losing strength.
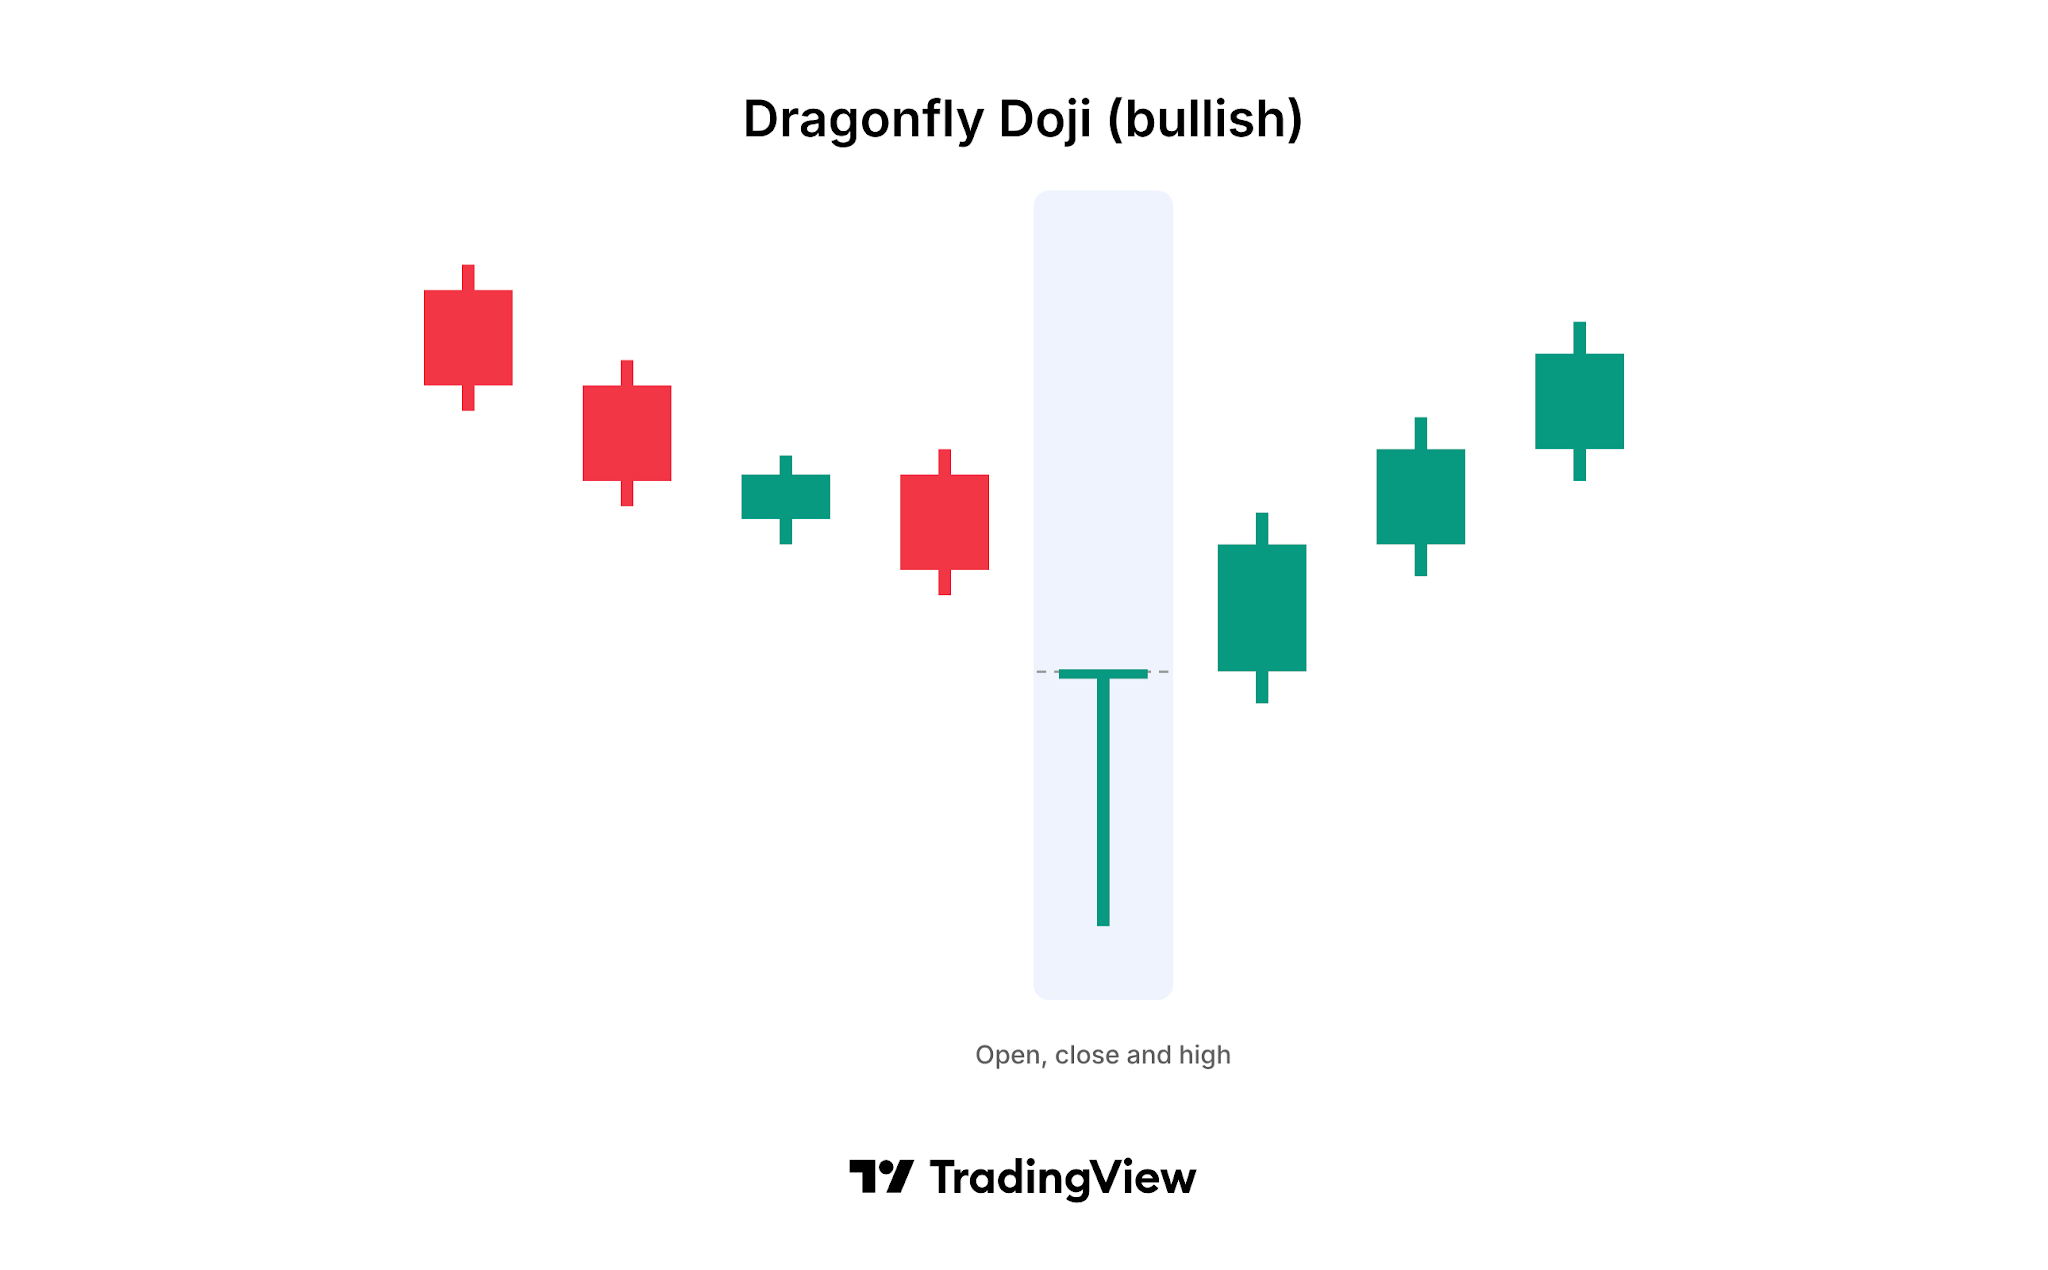
What does a Dragonfly Doji look like?
The candle has a distinctive "T" shape:
- Body: Very small or nonexistent, because the open and close are at almost the same price. The body can be bullish or bearish; the color does not matter.
- Upper shadow: Little or none, because the open and close are at or very near the high of the session.
- Lower shadow: Long, showing how far the price fell during the session before it recovered.
The longer the lower shadow compared with the rest of the candle, the clearer the pattern.
What does the pattern tell you?
The session opens and sellers push the price well below the open, continuing the downtrend. Before the close, buyers step in and drive the price back up to where it started. The session ends with nothing to show for the selling.
This full recovery shows that lower prices attracted buyers. After a series of falling candles, the Dragonfly Doji suggests that demand has caught up with supply, and the downtrend may be about to pause or reverse.
How reliable is the Dragonfly Doji?
A single candle carries limited information, so the Dragonfly Doji is usually treated as a warning rather than a complete signal. Traders look for extra evidence before acting on it:
- Prior trend: The pattern only has bullish meaning after a clear downtrend.
- Confirmation: A bullish candle that closes above the Dragonfly Doji's high on the next session adds weight to the reversal.
- Length of the lower shadow: A longer shadow shows a deeper rejection of lower prices.
- Volume: Higher volume on the Dragonfly Doji suggests that many buyers took part in the recovery.
- Context: A pattern that forms near a support level or in oversold conditions, for example on the RSI, carries more weight.
How does the Dragonfly Doji differ from a Hammer and a Gravestone Doji?
The Hammer also has a long lower shadow and little or no upper shadow, and it also appears after a decline. The difference is the body: a Hammer has a small but visible body, while the Dragonfly Doji has almost none because the open and close are nearly equal. The Gravestone Doji is the inverted form, with a long upper shadow and the open and close near the low. It is treated as a bearish signal after an uptrend.
What are the limitations of the pattern?
Like any candlestick pattern, the Dragonfly Doji describes what has happened, not what will happen. One strong recovery inside a session does not change the trend, and the decline often continues after the pattern. The same shape can also appear after an uptrend, where many traders read it as a warning of weakness rather than a bullish signal, so the prior trend matters. Traders often place a stop-loss below the low of the lower shadow to limit losses if the reversal fails.
How to find the Dragonfly Doji on TradingView
TradingView can detect this pattern for you on any chart:
- Built-in indicator: Open Indicators and search for Dragonfly Doji (bullish). The indicator marks each occurrence on the chart.
- All candlestick patterns at once: Add the All candlestick patterns indicator to see every supported pattern on one chart and choose which ones to display in its settings.
- Trend filter: In the indicator settings, choose how the prior trend is detected (based on SMA 50, or SMA 50 and SMA 200), or turn trend detection off.
- Alerts: Create an alert on the indicator to get notified when a new pattern forms.
Understanding the Dragonfly Doji
The Dragonfly Doji is a single candle with almost no body, little or no upper shadow, and a long lower shadow. After a downtrend, it shows that sellers pushed the price down but buyers recovered all of the loss by the close, which may signal that the decline is ending. Traders usually confirm it with the next candle, volume, and other indicators before acting on it.