Introduction to candlestick charts and patterns
Candlestick charts are one of the oldest charting methods, developed in 18th-century Japan to analyze price movements in the rice market. This chart type has many patterns, each helping you to understand market sentiment through their visualization of price dynamics.
CONTENTS:
- What are candlestick charts?
- Candles vs bars
- Enabling the chart type
- Settings
- What are candlestick patterns?
- Candlestick patterns indicators
- Candlesticks in a nutshell
What are candlestick charts?
Today, candlestick charts are widely used in technical analysis along with line and bar charts — they are considered one of the most informative tools in the financial industry. They come in different variations and can give you many insights into an asset's performance. However, because of the many candlestick patterns available, learning this charting method may take time. But as with everything in trading, your patience will be rewarded.
In the following picture, you can see what each part of a candle type means.
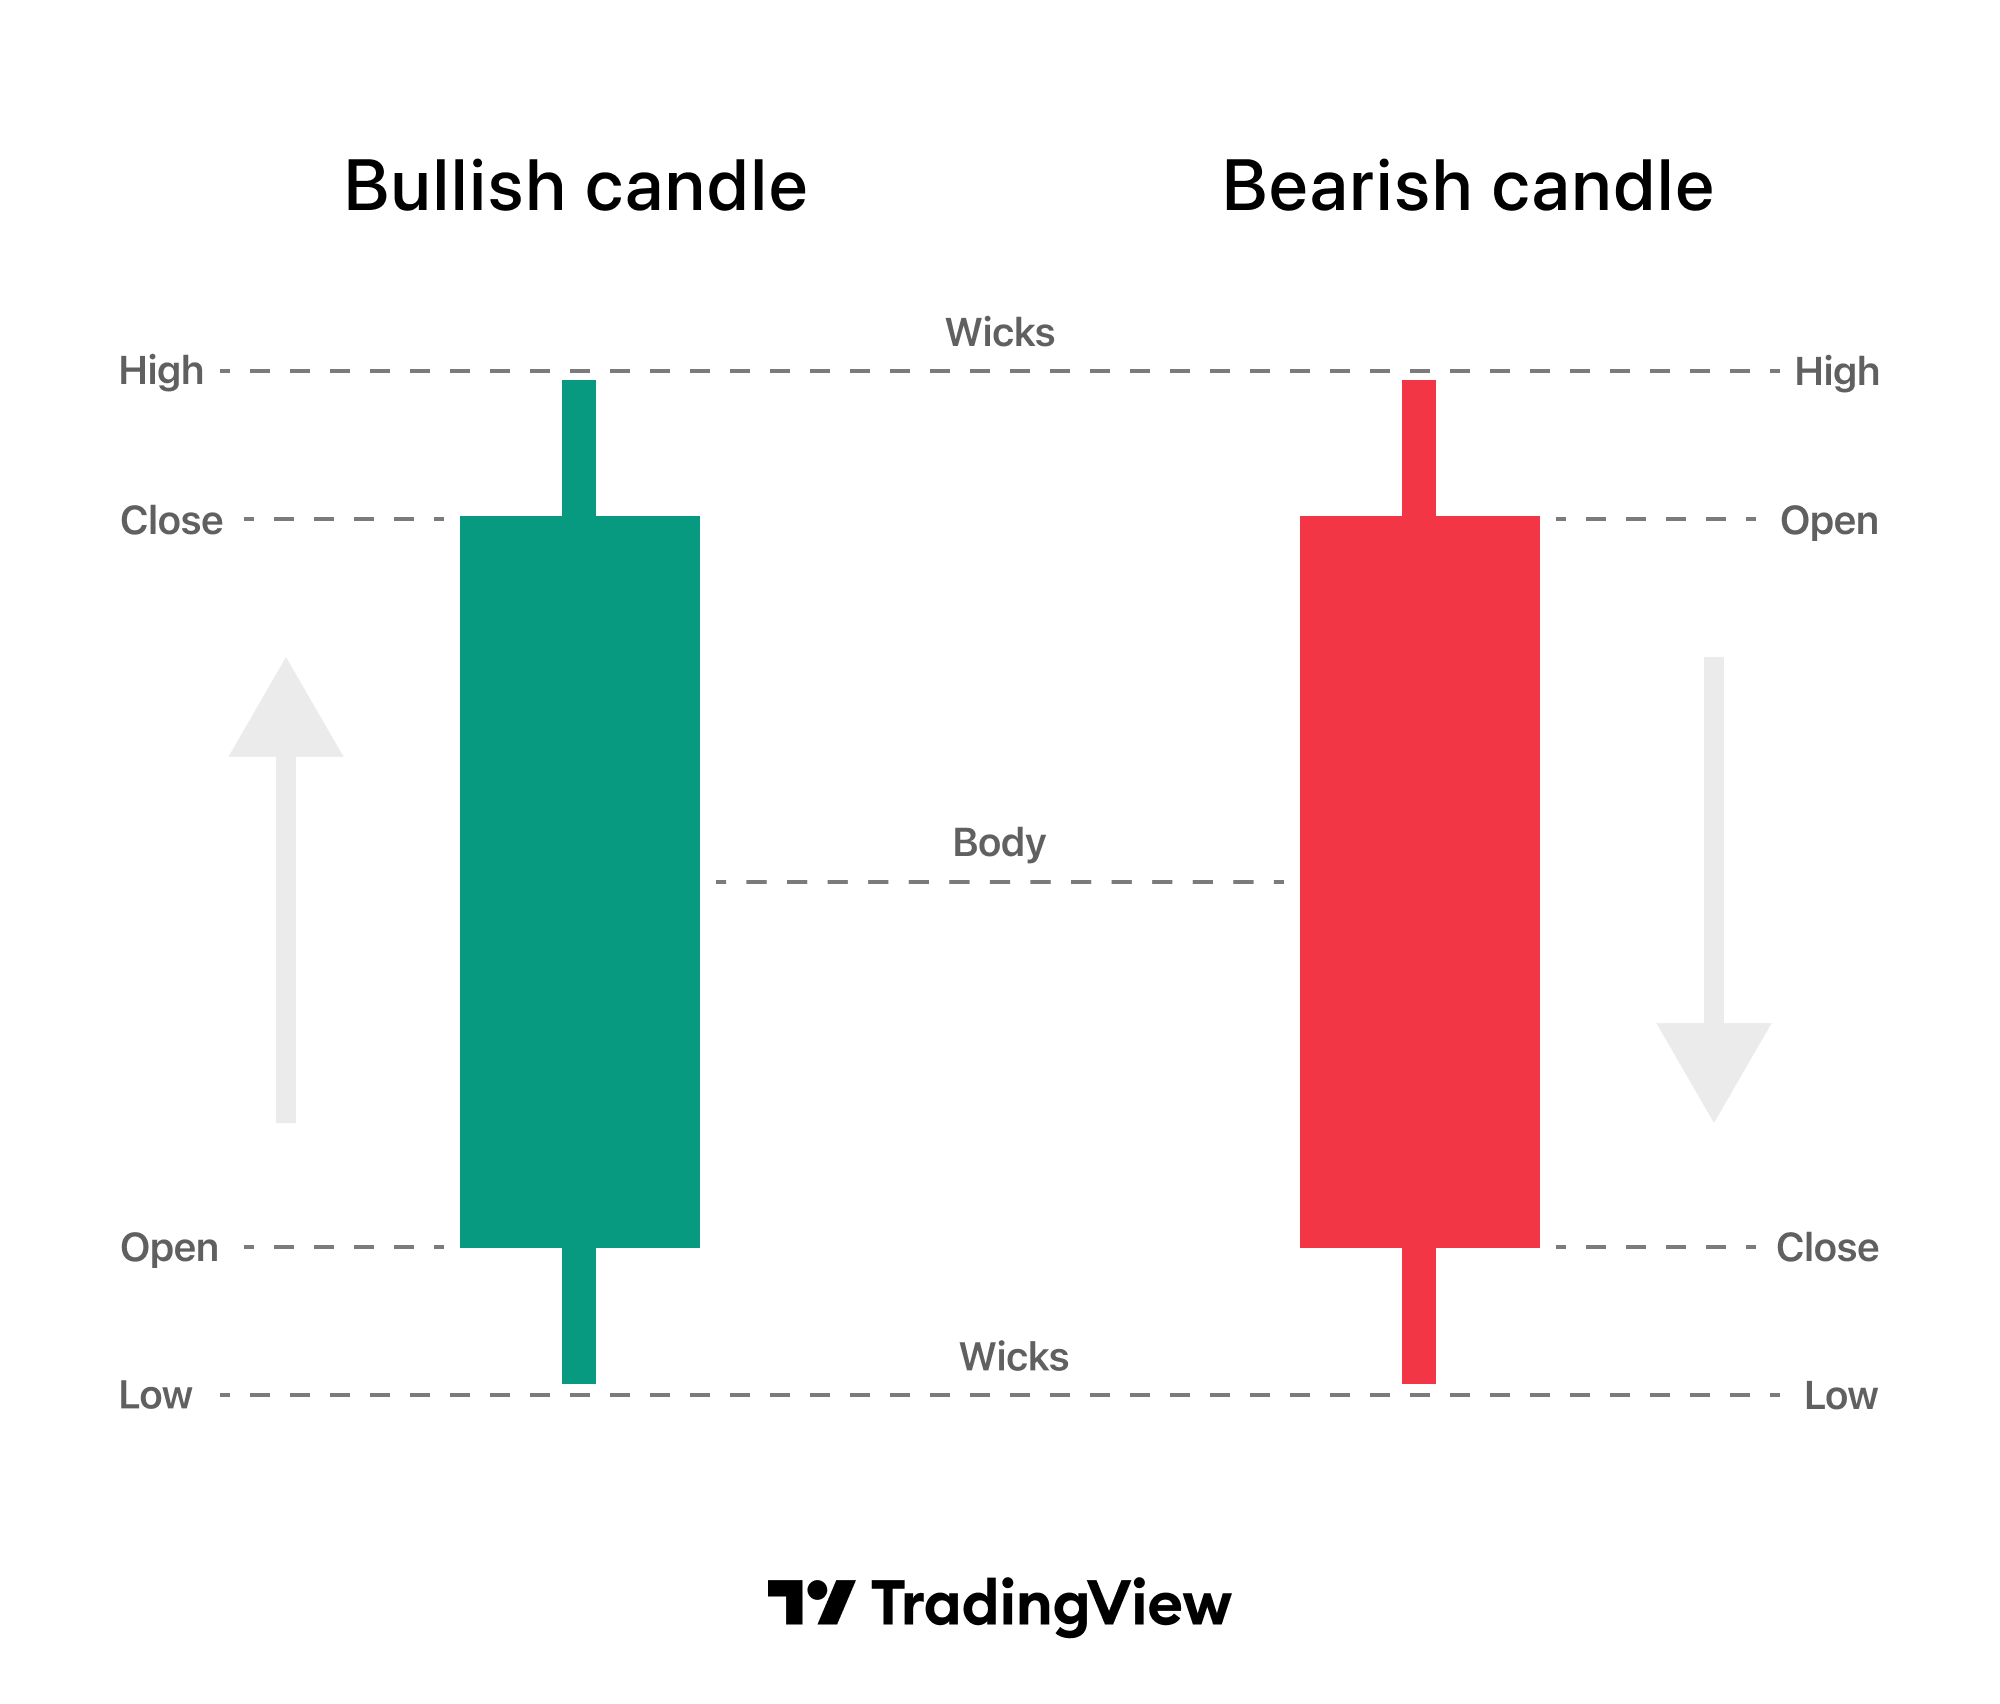
Each candle consists of two components:
- Body: Represents the range between the open and close prices.
- Shadows/wicks: Extend from the top and bottom of the body. They indicate the highest and lowest prices during the specified timeframe.
The color of a candle conveys the price movement within the time interval:
- Green candles: The open price is at the lower edge of the body and the close price is at the upper edge.
- Red candles: The open price is at the upper edge of the body and the close price is at the lower edge.
Candles vs bars
Along with bars, candles are one of the most fundamental chart types almost every trader uses. While both chart types display similar information, each has its own strengths and weaknesses.
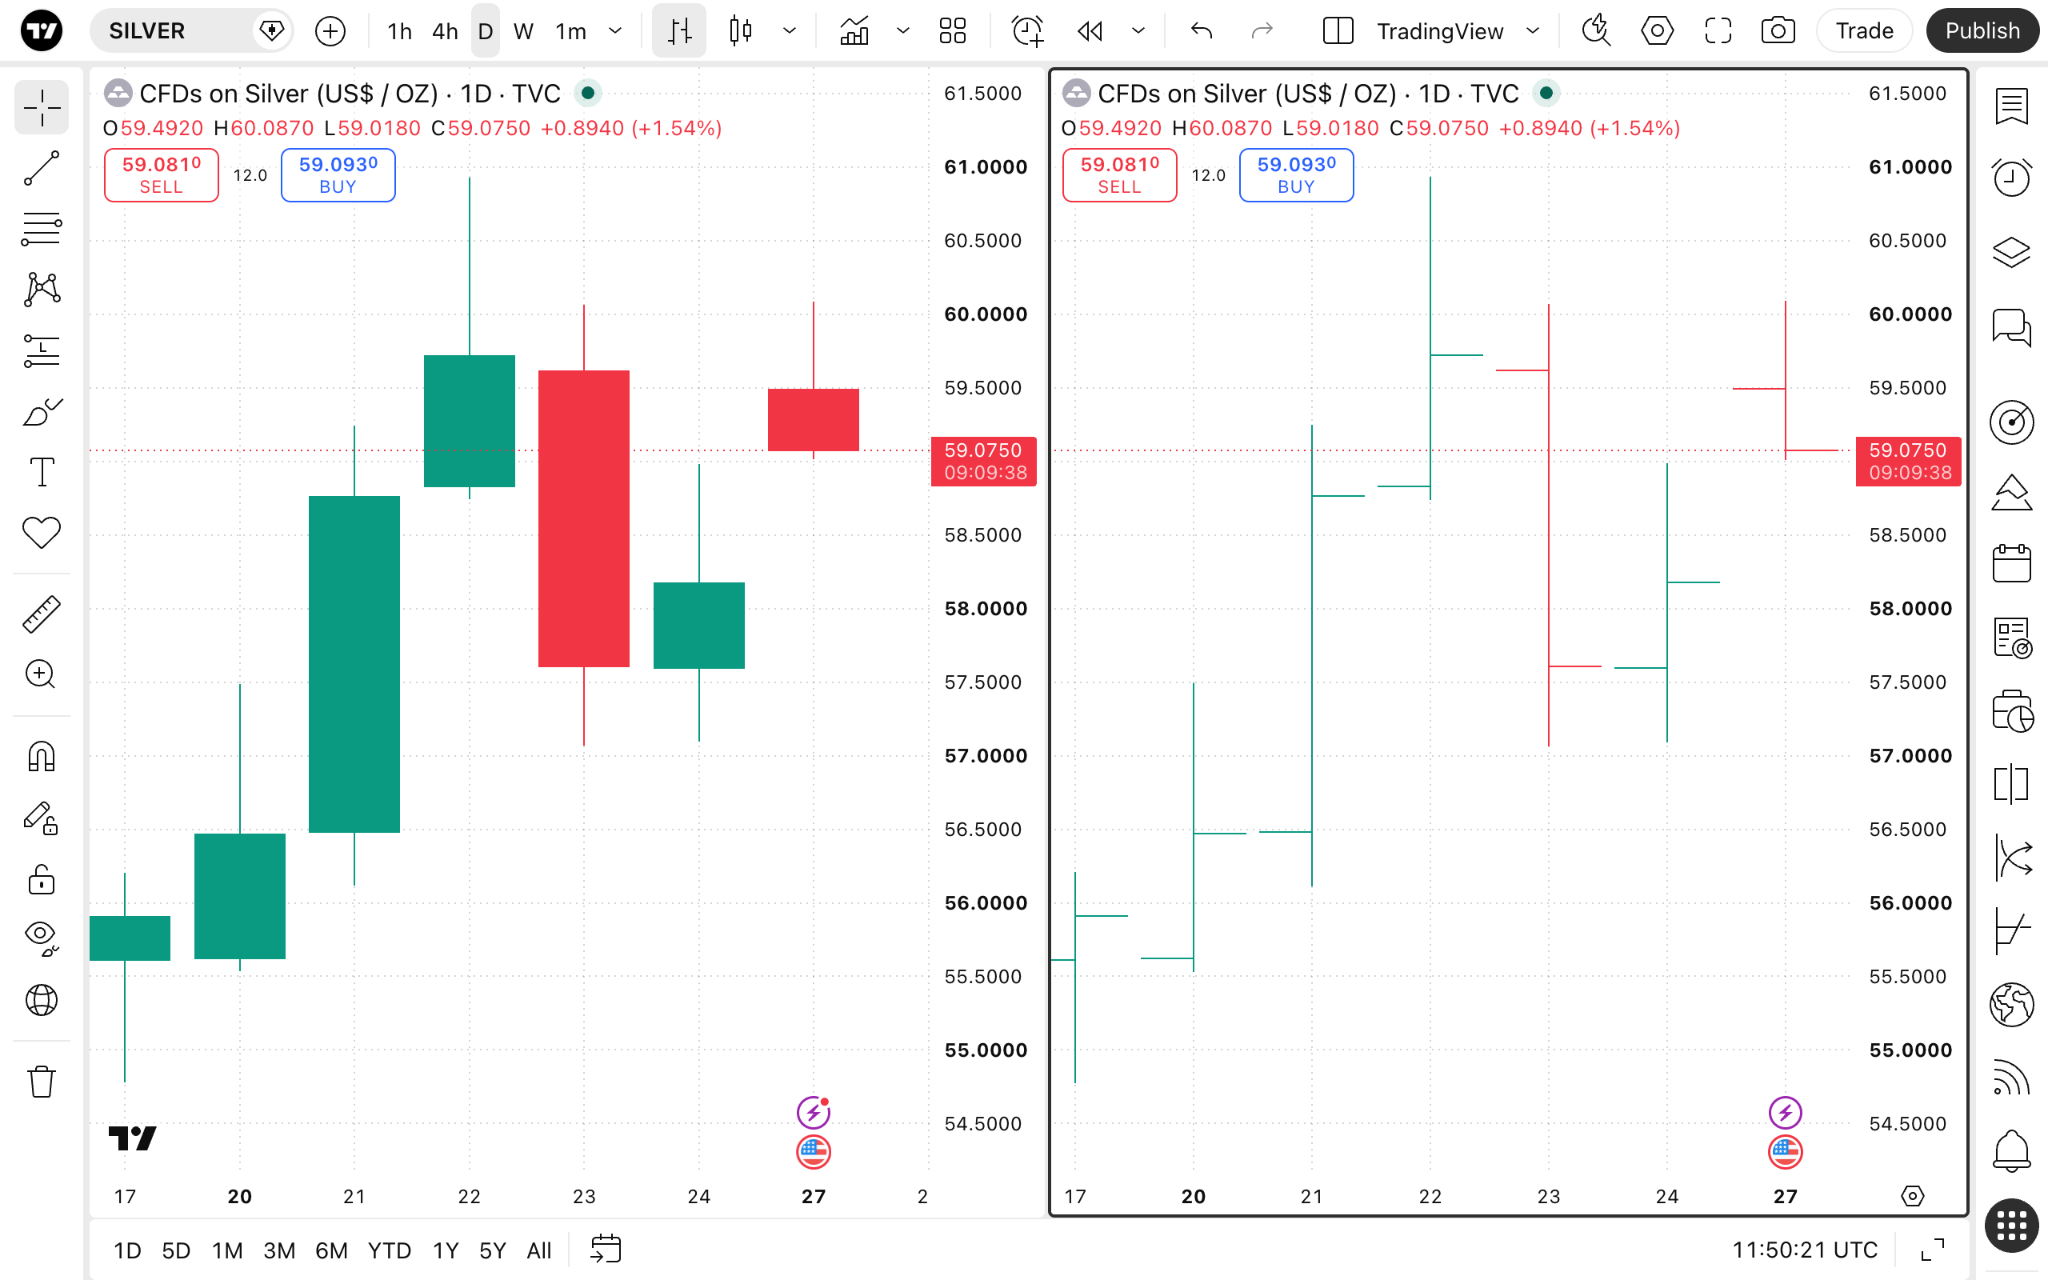
Candles
- Very intuitive and visually engaging in displaying open, high, low, and close prices.
- May be more suitable for more conservative traders focused on open and close prices.
- Various candlestick patterns may provide extensive information about market sentiment even before you apply drawing tools and start reading indicators.
Bars
- Close prices are considered a standard to understand an asset's true price. With bars, it may be harder to quickly grasp multiple close prices on many bars.
- Bars display similar price data as candles, so candlestick patterns may also be applied to bars, but they are harder to interpret, which can make bars less intuitive.
Enabling the chart type
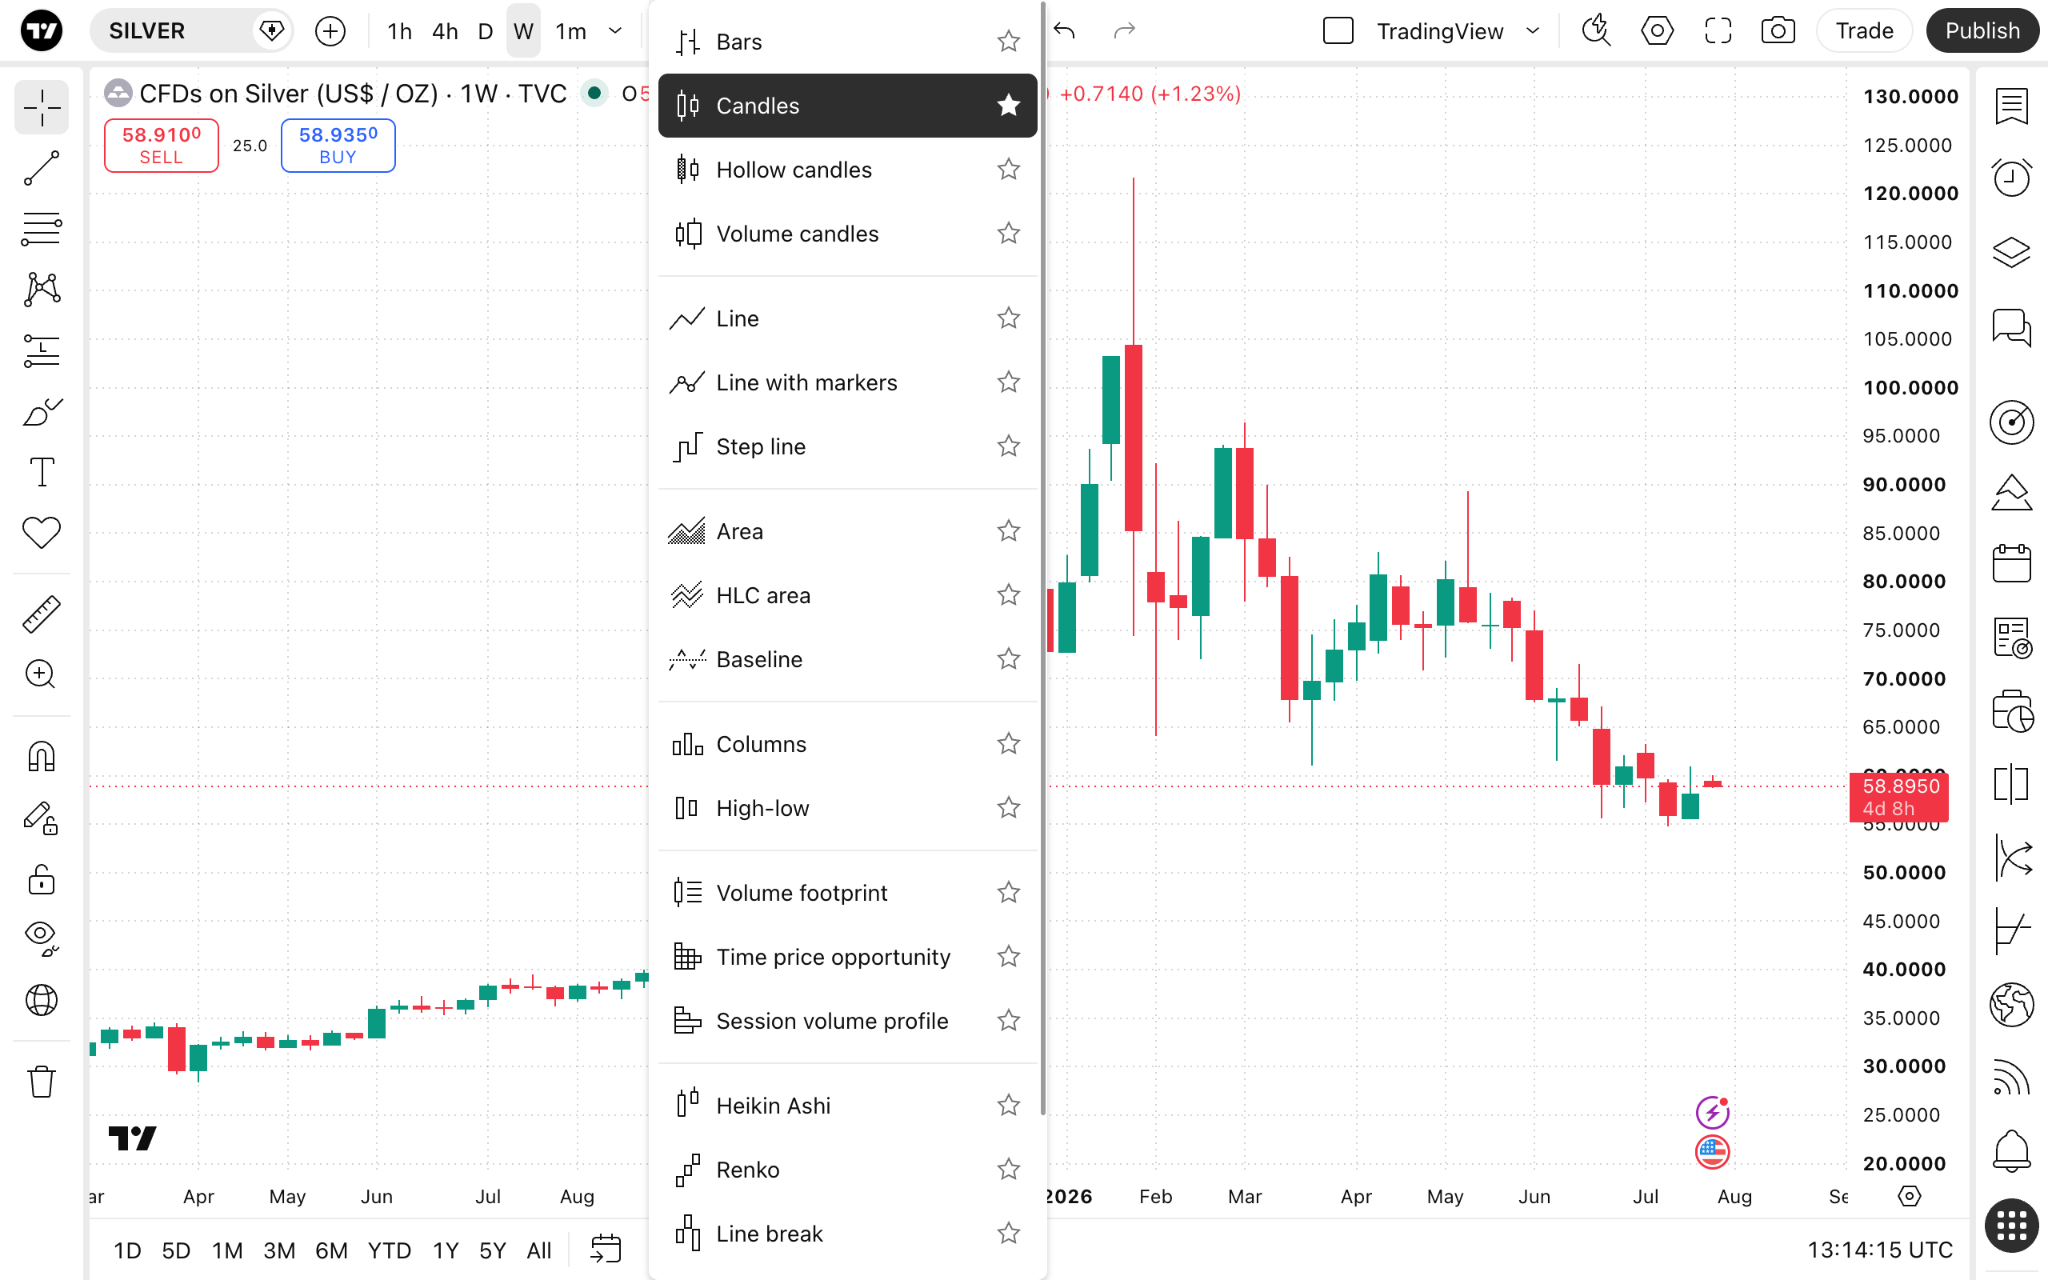
On Supercharts, open the chart type menu on the upper toolbar, and select "Candles."
Settings
You can customize candlesticks by adjusting their colors and assignment type to bullish and bearish.
To do this, find the gear button on the top toolbar, and open the "Symbol" tab.
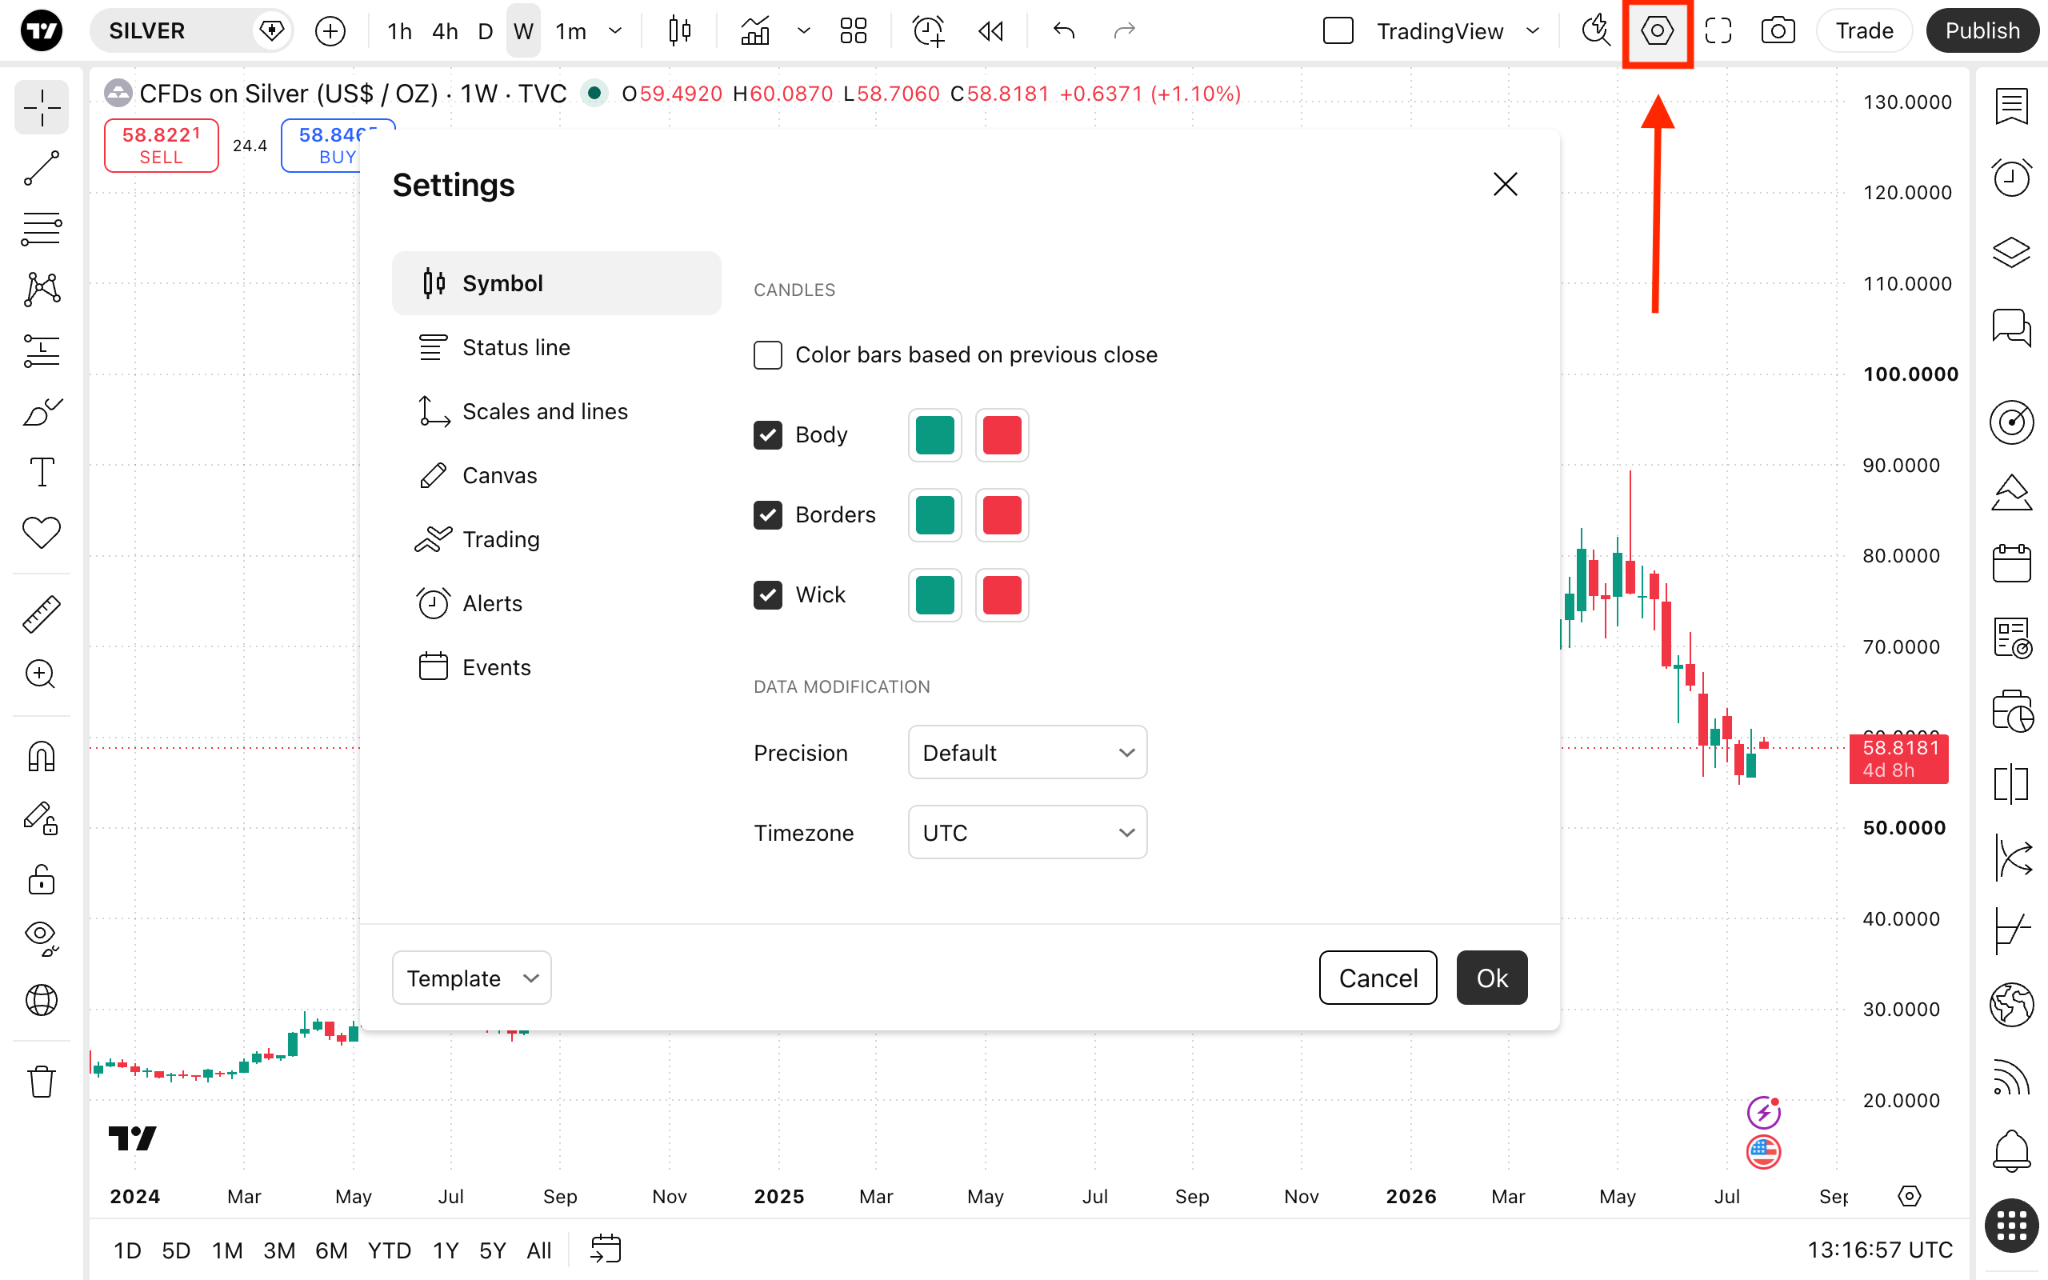
In the "Candles" section, you can adjust the following settings:
- Color bars based on previous close: With this setting on, the color of each bar will be determined by whether its close price is higher (green) or lower (red) than the close price of the previous bar, rather than by the bar's own open and close prices.
- Body: Change the color and fill of the candles' bodies.
- Borders: Change the color of the candles' edges.
- Wick: Change the color of the candles' wick.
What are candlestick patterns?
Patterns are similarities in candle appearance, their sequence, or position relative to one another that suggest a particular price movement in the near future. They are types of chart patterns — the broader term used to assess price momentum, trend strength, and market sentiment.
Candlestick patterns can include from one to five candles. They can signal what is likely to happen with the price if the pattern is confirmed.
There are three common types of patterns:
- Reversal patterns
- Continuation patterns
- Neutral patterns
The more candles a pattern needs to form, the less often it occurs. Some candle patterns can have reversed versions that work identically — just in the other direction.
Candlestick patterns indicators
To maximize the utility of candlestick charts, you can use candlestick pattern indicators. On the top toolbar, click the "Indicators, metrics, and strategies" menu → "Technicals" → "Patterns" and scroll down to "Candlestick patterns."
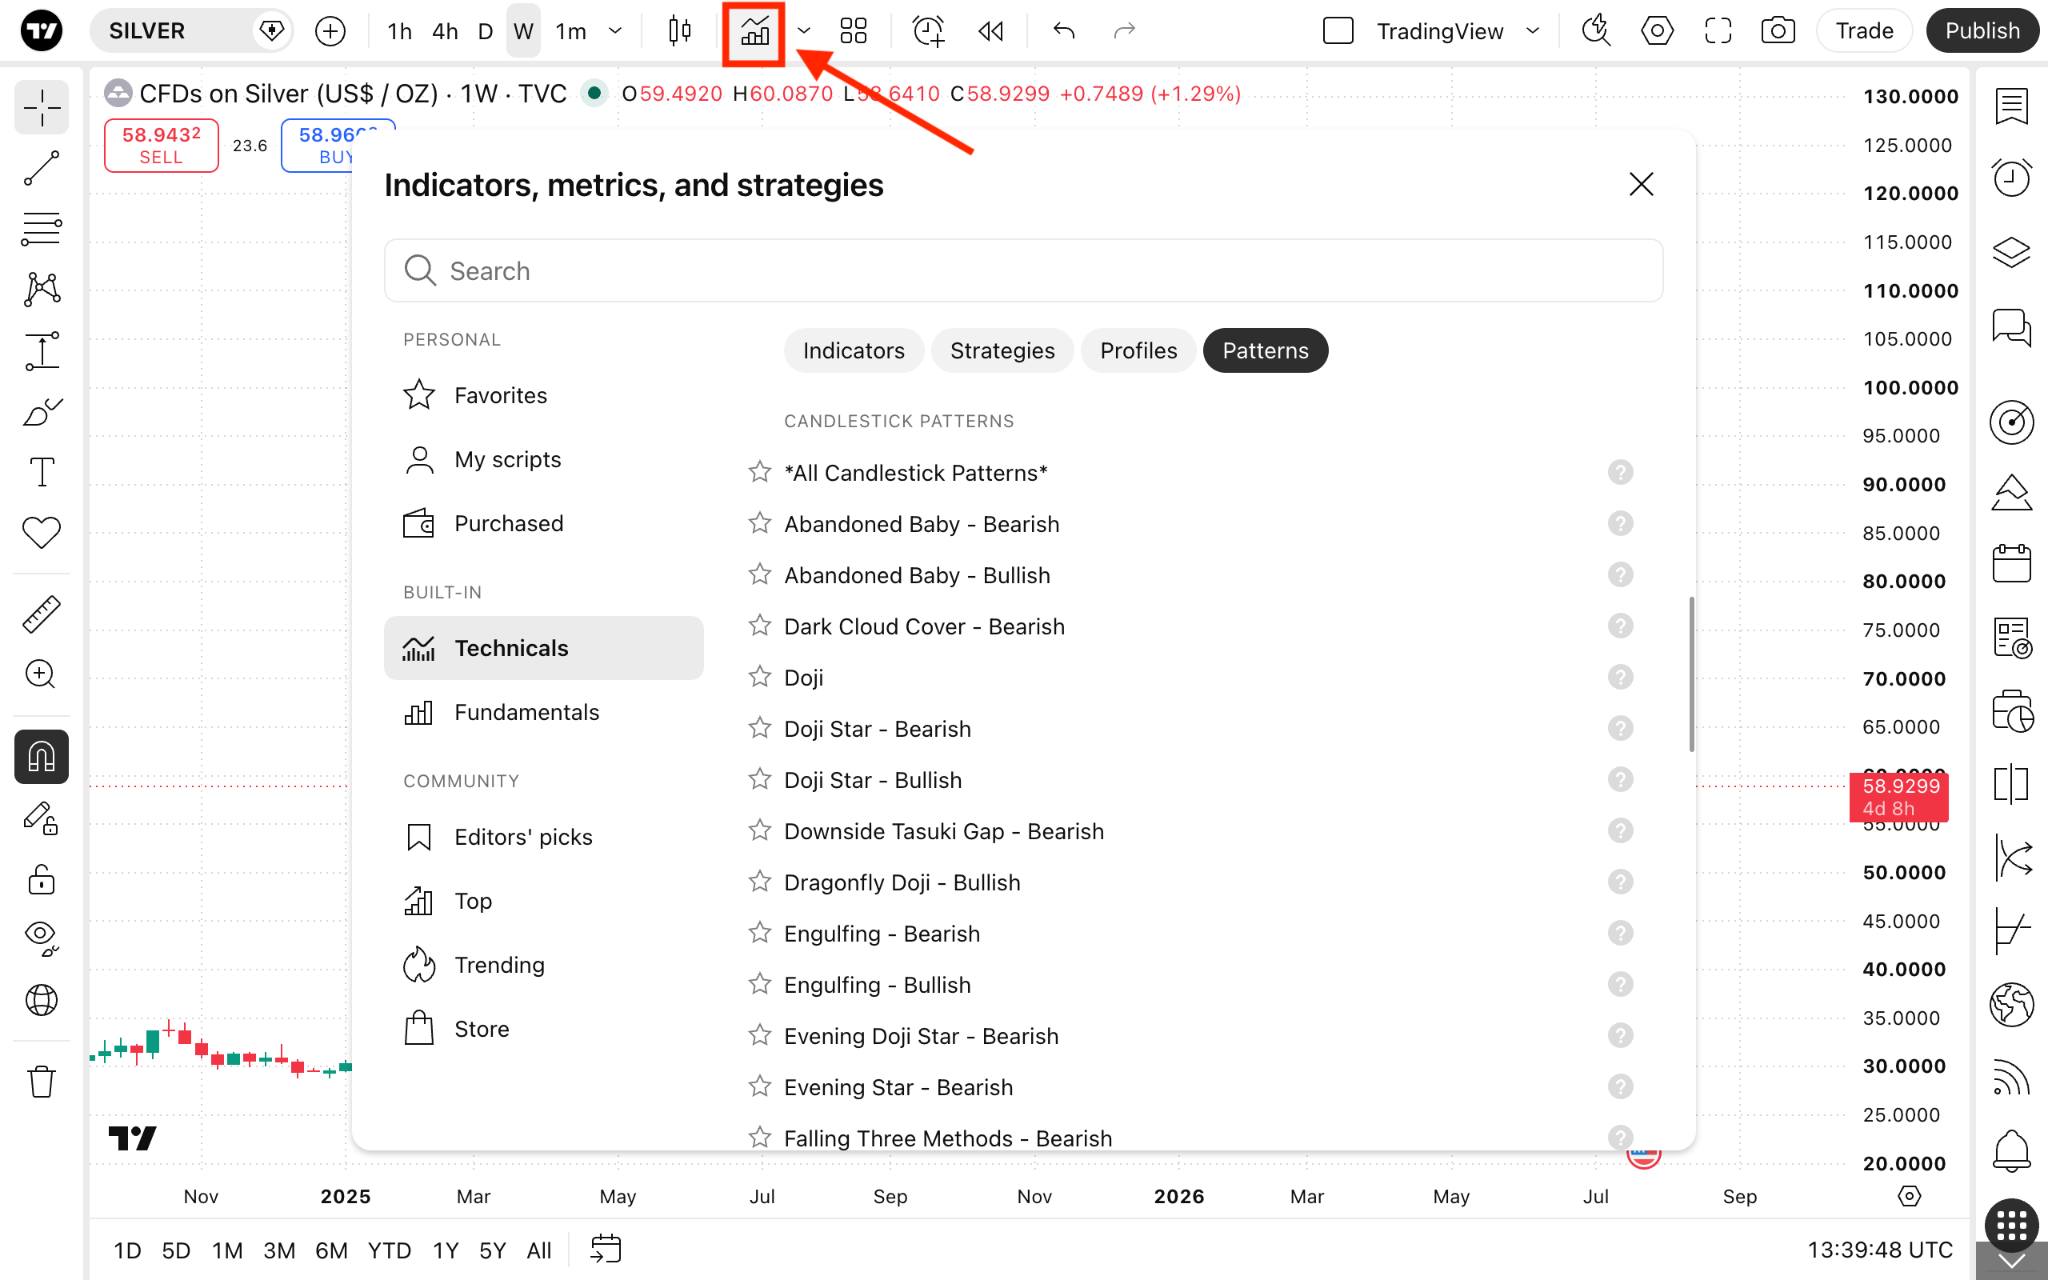
These automated tools detect specific patterns and provide insights into their potential implications.
Candlesticks in a nutshell
Candlesticks' main use case is price analysis. They are considered standard in modern trading as they incorporate both simplicity and comprehensiveness while representing complex financial data.
They come in different variations such as hollow candles, volume candles, and more, but to use all of them, you may want to get comfortable with the standard version first.
Their main strength is patterns, which come from simple Dojis to more intricate ones consisting of up to five candles. To save your time for analysis and decision-making, you can use automated tools that help you with navigating charts.
Also read: