Bearish Engulfing: recognizing sellers taking over at an uptrend's peak
The bearish Engulfing is a two-candle reversal pattern that appears after an uptrend. A small bullish candle is followed by a larger bearish candle whose body completely covers, or "engulfs," the body of the first. The pattern shows that sellers have overpowered buyers within a single session.
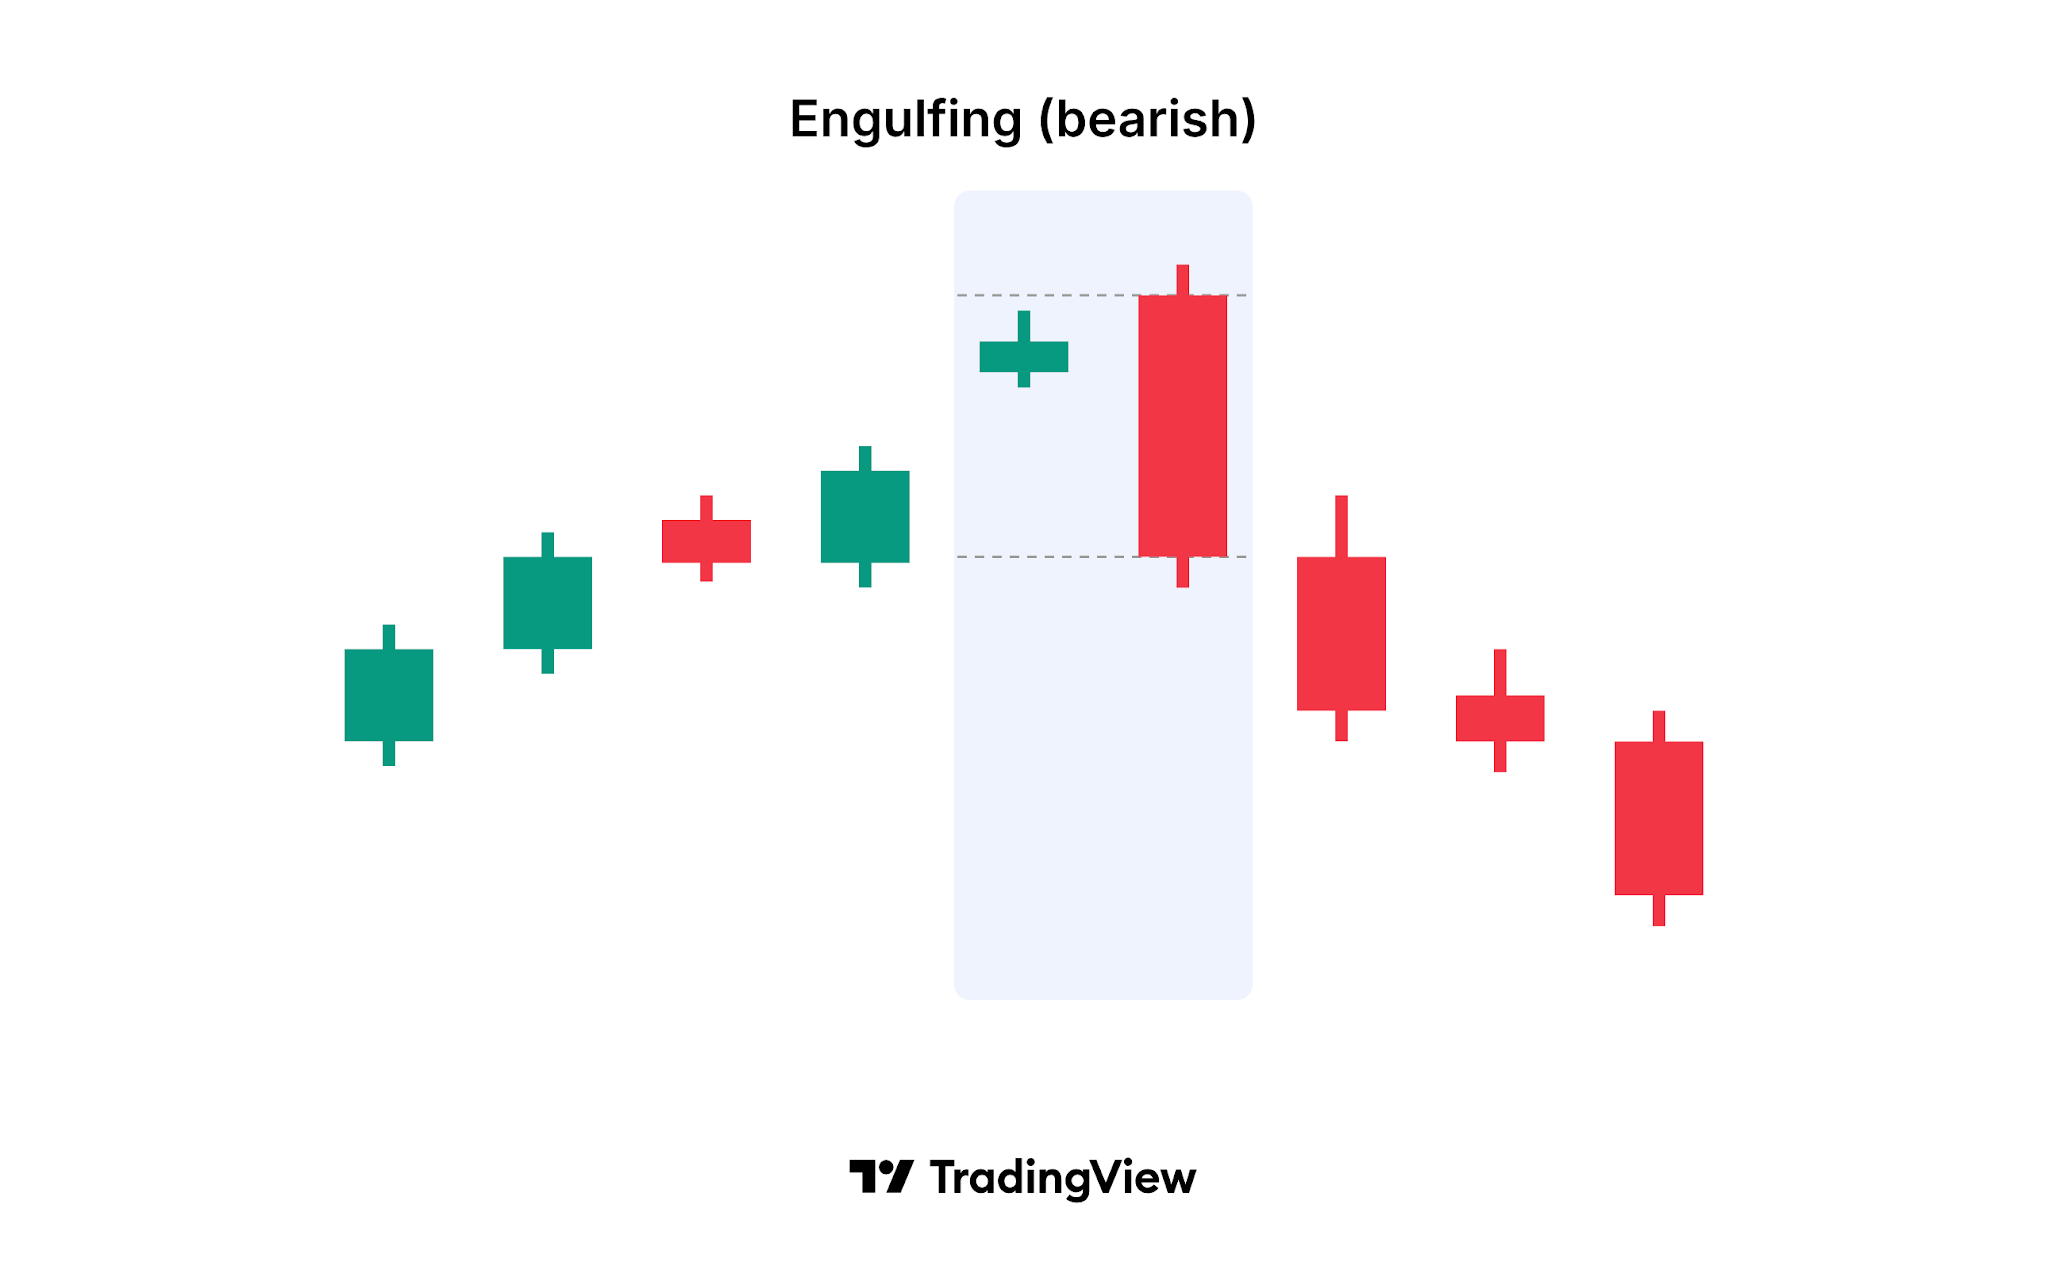
What does a bearish Engulfing look like?
The pattern forms over two consecutive candles:
- First candle: A small bullish (white or green) candle that continues the existing uptrend.
- Second candle: A long bearish (black or red) candle that opens at or above the close of the first candle and closes at or below its open.
Only the bodies need to be engulfed. The shadows of the first candle can extend beyond the body of the second. The bigger the second body is compared with the first, the clearer the pattern.
What does the pattern tell you?
The first candle shows that buyers are still pushing prices up, but with less force than before, as its small body suggests. The second candle opens at the same level or higher, so the session starts in the buyers' favor. Sellers then take control and push the price below the first candle's open, wiping out the previous session's entire gain.
A complete reversal of the prior session's move in a single candle is what many traders watch for. It shows that supply now exceeds demand, which may signal that the uptrend is ending.
How reliable is the bearish Engulfing?
The bearish Engulfing is one of the most widely followed candlestick patterns. It forms often, which also means many occurrences have no follow-through. Traders usually look for extra evidence before acting on it:
- Prior trend: The pattern only has meaning after a clear uptrend.
- Size of the second candle: A bearish body that covers several previous candles, not only the last one, shows stronger selling.
- Volume: Higher volume on the second candle suggests more sellers took part.
- Confirmation: A lower close on the next candle adds weight to the reversal.
- Context: A pattern that forms near a resistance level or in overbought conditions, for example on the RSI, carries more weight.
How does the bearish Engulfing differ from a bearish Harami?
The two patterns use the same pair of candle colors in reverse proportions. In a bearish Engulfing, the second candle's body is larger and covers the first. In a bearish Harami, a long bullish candle is followed by a small bearish candle whose body fits inside the first. The Engulfing shows sellers taking control, while the Harami shows buying momentum fading. The Dark cloud cover is a related pattern in which the bearish candle closes only below the midpoint of the first body instead of covering all of it.
What are the limitations of the pattern?
Like any candlestick pattern, the bearish Engulfing describes what has happened, not what will happen. In a strong uptrend, the price often recovers after one weak session. Because the pattern is common, it can appear many times on lower timeframes without a lasting reversal. The large second candle can also put a natural stop-loss, above its high, far from the entry, which affects the risk of a trade. Traders often combine the pattern with other analysis to filter out weaker signals.
How to find the bearish Engulfing on TradingView
TradingView can detect this pattern for you on any chart:
- Built-in indicator: Open Indicators and search for Engulfing (bearish). The indicator marks each occurrence on the chart.
- All candlestick patterns at once: Add the All candlestick patterns indicator to see every supported pattern on one chart and choose which ones to display in its settings.
- Trend filter: In the indicator settings, choose how the prior trend is detected (based on SMA 50, or SMA 50 and SMA 200), or turn trend detection off.
- Alerts: Create an alert on the indicator to get notified when a new pattern forms.
Understanding the bearish Engulfing
The bearish Engulfing is a two-candle pattern made up of a small bullish candle and a larger bearish candle whose body covers the first body. It signals a possible reversal from an uptrend to a downtrend. The pattern is common and widely watched, so traders usually confirm it with volume, the next candle, and other indicators before acting on it.