Bearish Hanging man: detecting warning signs at market highs
The Hanging man is a single-candle bearish reversal pattern that appears after an uptrend. It has a small body near the top of the candle and a long lower shadow, at least twice the size of the body. The shape shows that sellers were able to push prices sharply lower during the session, which can be an early sign that the uptrend is weakening.
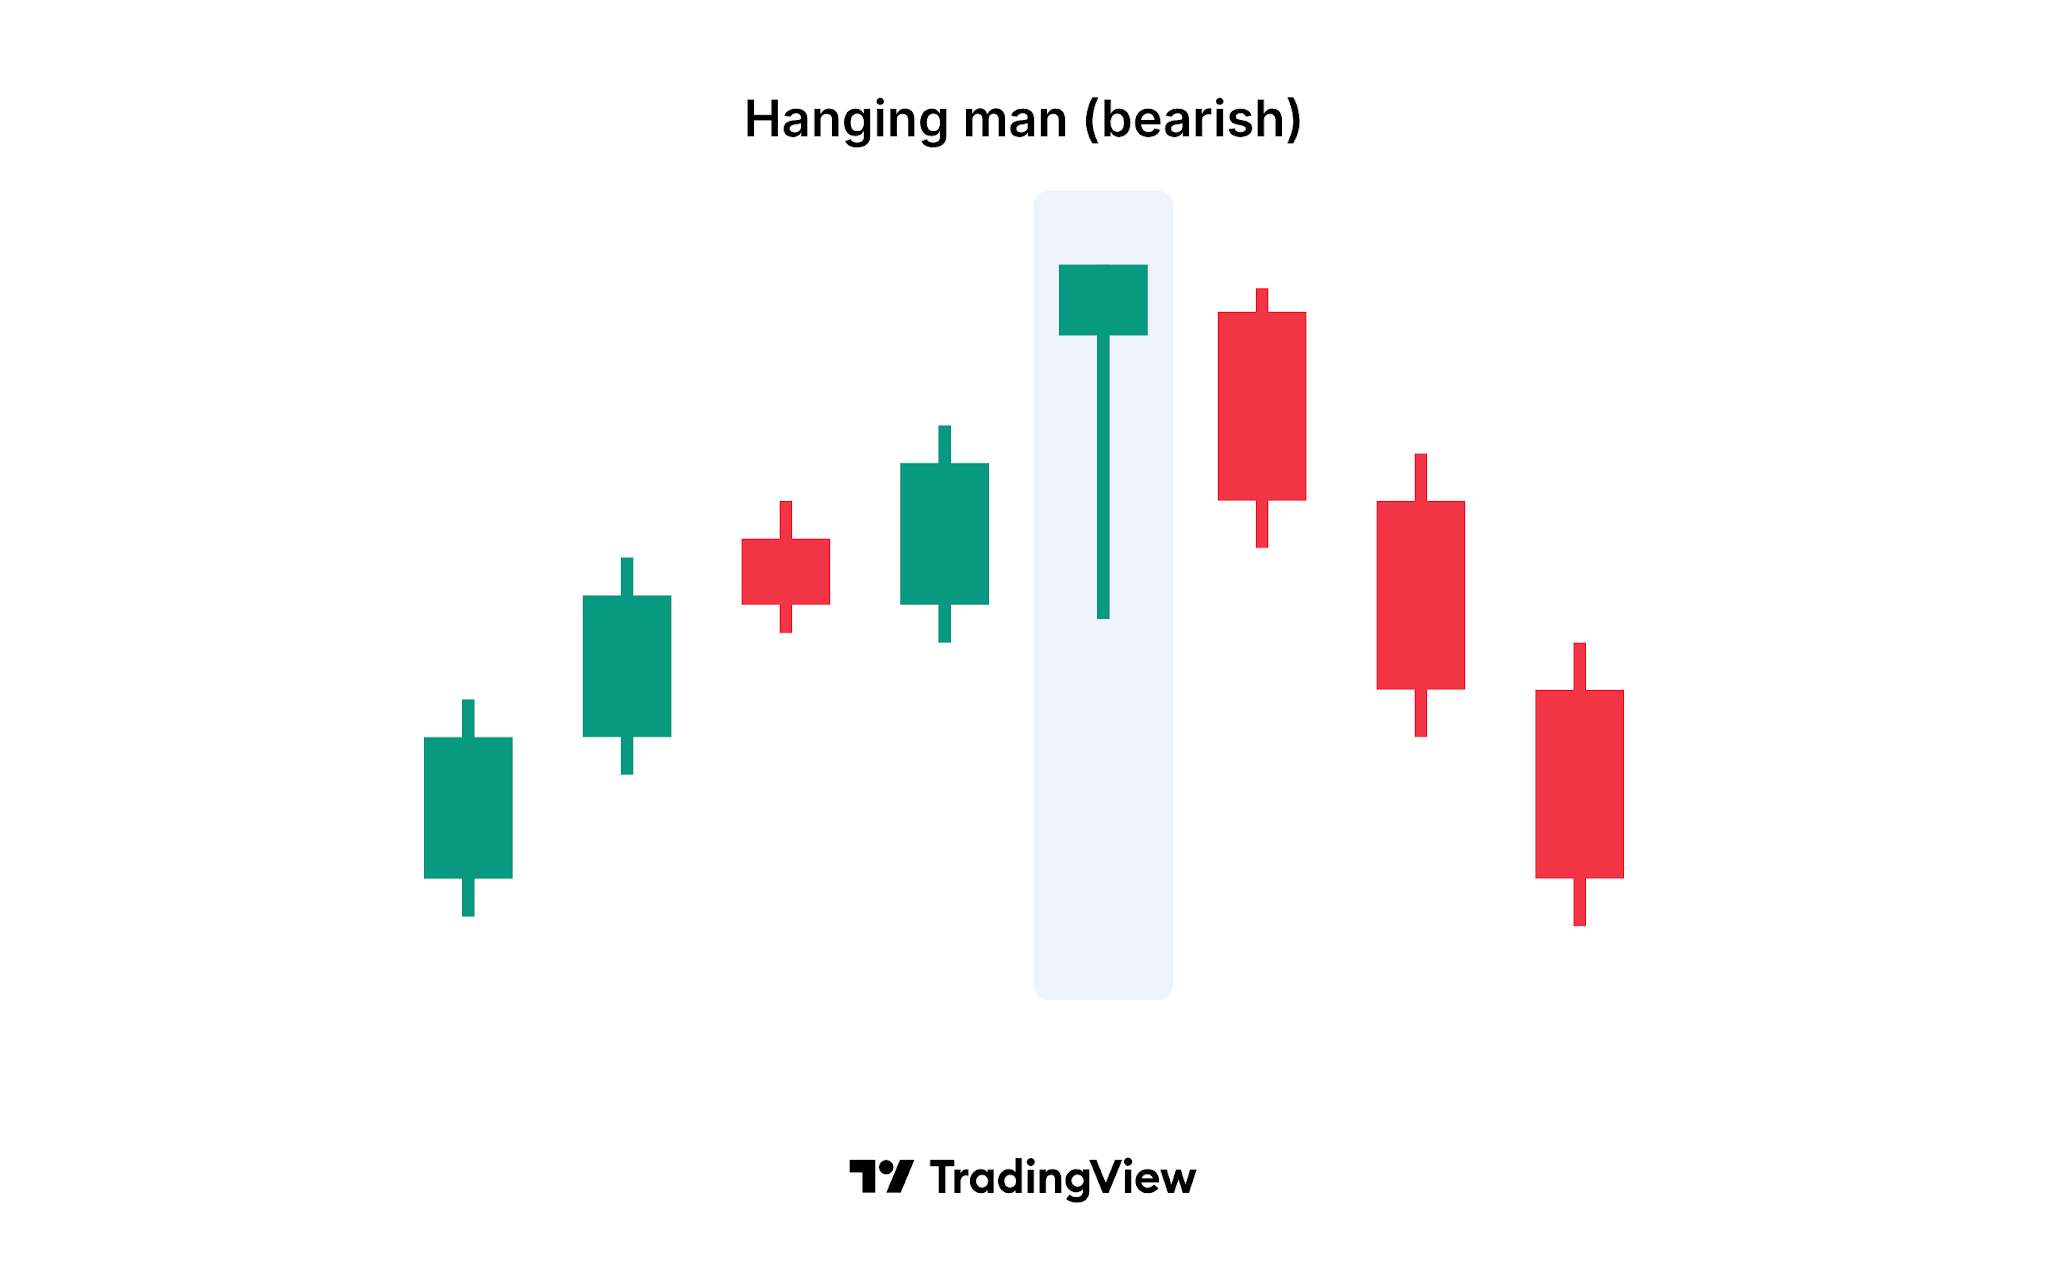
What does a Hanging man look like?
The pattern is a single candle with a distinctive shape:
- Body: Small, and located in the upper part of the candle's range. It can be bullish (white or green) or bearish (black or red), though a bearish body is often seen as slightly stronger.
- Lower shadow: Long, usually at least two times the height of the body. It marks how far prices fell during the session.
- Upper shadow: Absent or very short.
The candle looks like a figure hanging from a rope, which gives the pattern its name. It only counts as a Hanging man when it appears after a rise. The same shape after a downtrend is called a Hammer.
What does the pattern tell you?
The session opens, and sellers push prices well below the open. Buyers then bring prices back up, and the candle closes near its high. At first glance, this looks like a win for buyers.
The warning lies in the lower shadow. In an uptrend, buyers have been in control, yet during this session sellers were able to drive prices sharply lower. That shows selling pressure is building. If the next session opens and closes lower, traders who bought during the Hanging man session are left with losses, which may add to the selling.
How reliable is the Hanging man?
The Hanging man is a weaker signal than its bullish twin, the Hammer, because the candle itself closes near its high. Most traders treat it as a warning rather than a signal to act on by itself.
Traders usually look for extra evidence before acting on the signal:
- Prior trend: The pattern only has meaning after a clear uptrend.
- Length of the lower shadow: A longer lower shadow relative to the body shows stronger selling during the session.
- Volume: Higher volume on the Hanging man suggests that the selling was broad.
- Confirmation: A bearish candle that closes below the Hanging man's body on the next session adds weight to the reversal.
- Context: A pattern that forms near a resistance level or in overbought conditions, for example on the RSI, carries more weight.
How does the Hanging man differ from the Hammer?
The Hanging man and the Hammer have the same shape: a small body at the top of the range and a long lower shadow. The only difference is the trend that comes before them. A Hanging man forms after an uptrend and may signal a move down. A Hammer forms after a downtrend and may signal a move up.
What are the limitations of the pattern?
Like any candlestick pattern, the Hanging man describes what has happened, not what will happen. Many Hanging man candles appear during strong uptrends and are followed by further gains. Without a confirming candle, the pattern often fails. Traders often combine it with stop-loss levels, for example above the high of the Hanging man, to limit losses if the uptrend resumes.
How to find the Hanging man on TradingView
TradingView can detect this pattern for you on any chart:
- Built-in indicator: Open Indicators and search for Hanging man (bearish). The indicator marks each occurrence on the chart.
- All candlestick patterns at once: Add the All candlestick patterns indicator to see every supported pattern on one chart and choose which ones to display in its settings.
- Trend filter: In the indicator settings, choose how the prior trend is detected (based on SMA 50, or SMA 50 and SMA 200), or turn trend detection off.
- Alerts: Create an alert on the indicator to get notified when a new pattern forms.
Understanding the Hanging man
The Hanging man is a single candle with a small body near its high and a long lower shadow, at least twice the size of the body, that forms after an uptrend. It shows that sellers were able to push prices sharply lower during the session. It may signal a reversal to the downside, but it is a weak signal on its own, and traders usually wait for a lower close on the next candle before acting on it.