Bearish Evening Doji star: recognizing a confirmed reversal at an uptrend's peak
The Evening Doji star is a three-candle bearish reversal pattern that appears after an uptrend. A long bullish candle is followed by a Doji that gaps above it, and then by a long bearish candle that closes deep into the body of the first candle. The Doji marks the moment buying stalls, and the third candle shows sellers taking over.
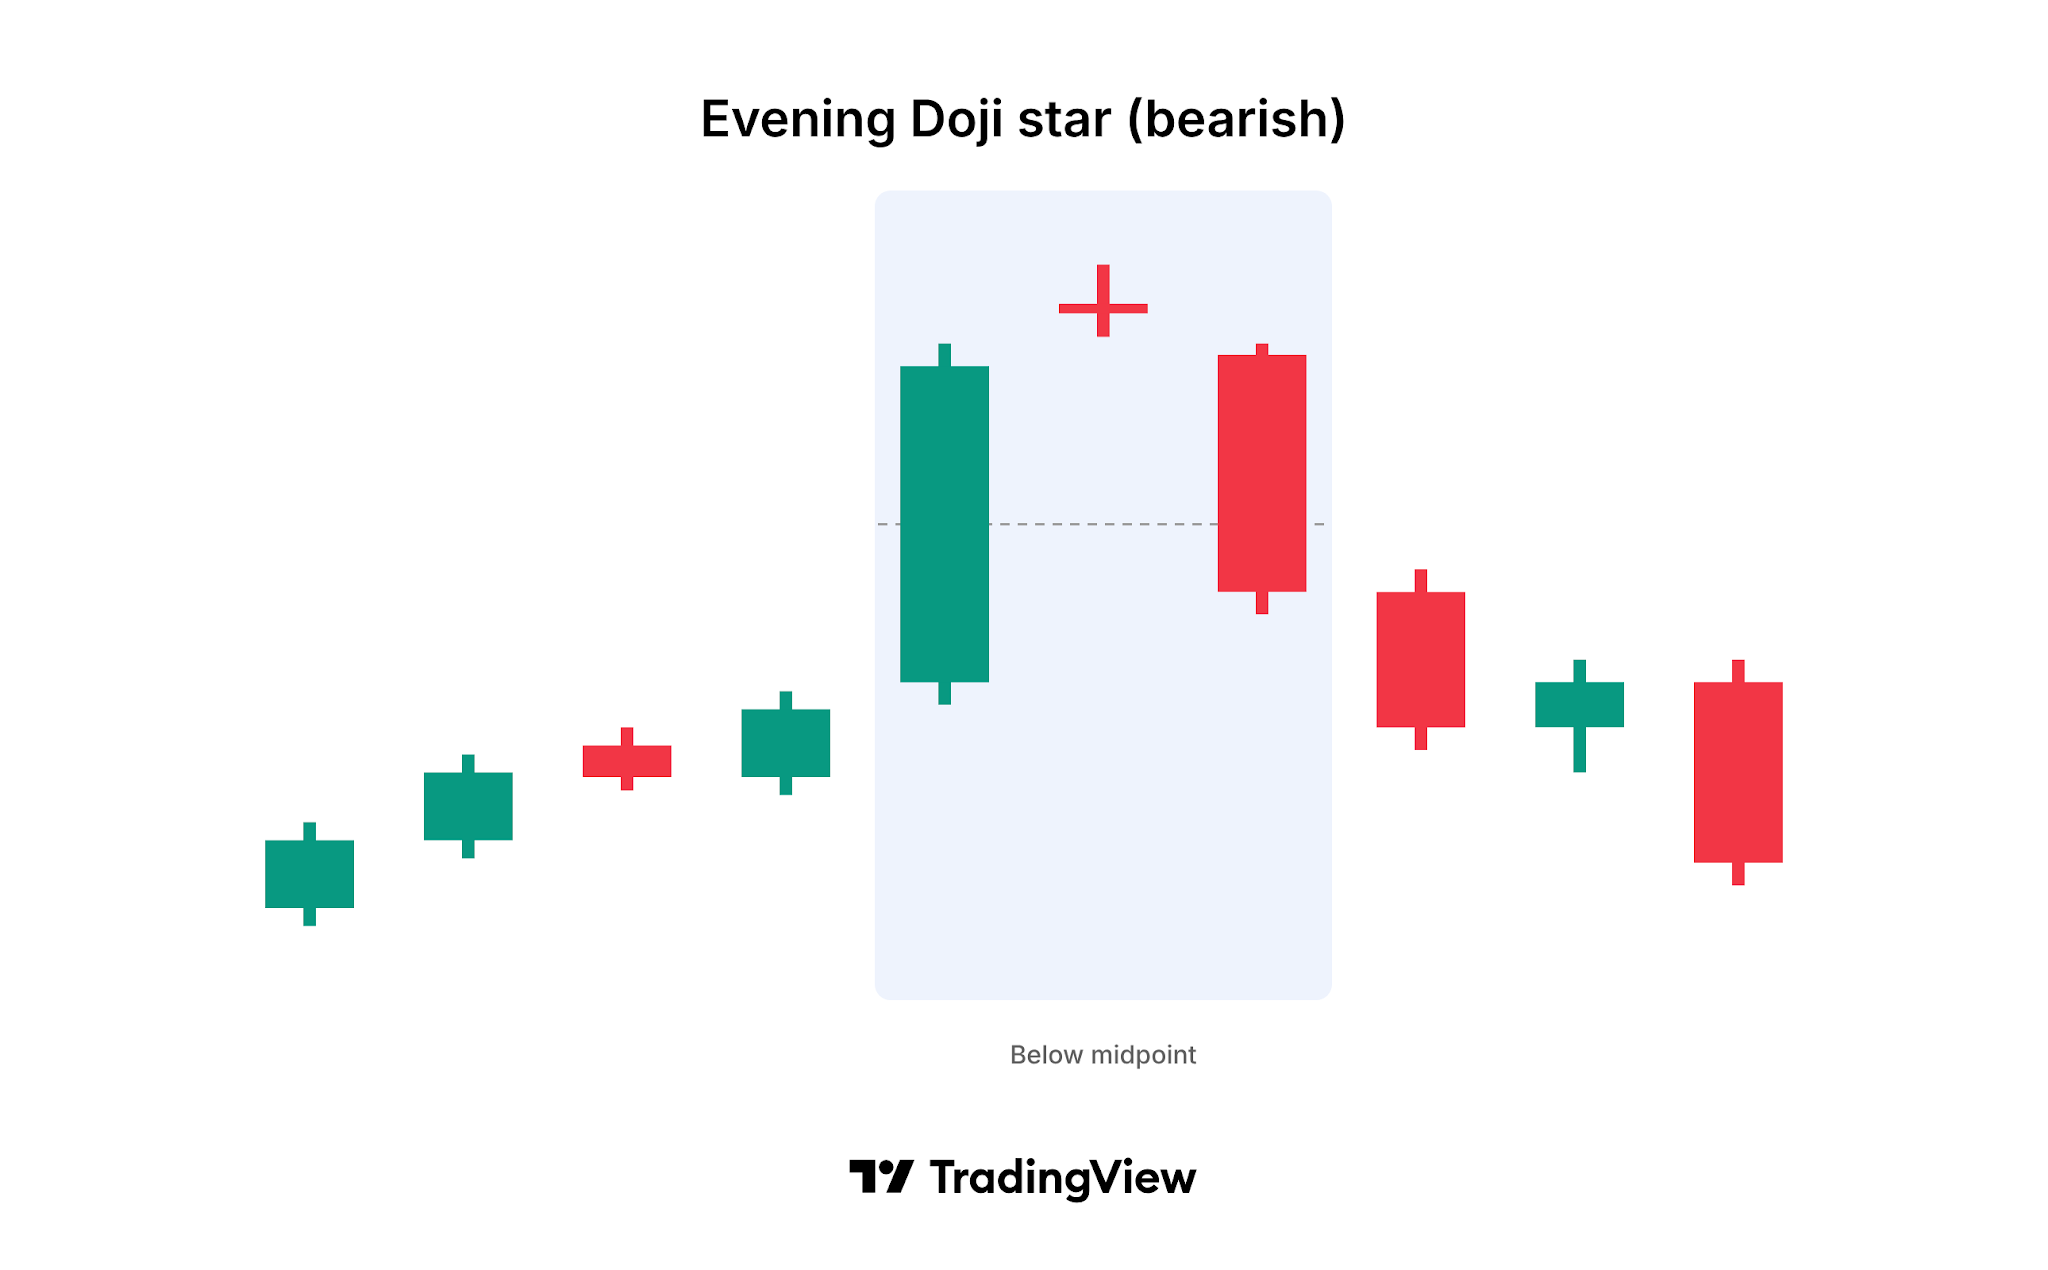
What does an Evening Doji star look like?
The pattern forms over three consecutive candles:
- First candle: A long bullish (white or green) candle that continues the existing uptrend.
- Second candle: A Doji, with its open and close at almost the same price, whose body gaps above the body of the first candle.
- Third candle: A long bearish (black or red) candle whose body stays below the Doji's body and that closes below the midpoint of the first candle's body.
The gap above the first candle only needs to be between the bodies. The shadows of the Doji can overlap with the shadows of the candles on either side.
What does the pattern tell you?
The first candle shows that buyers are in control. The Doji opens higher, but buyers cannot push the price further, and the session ends where it began. When the third candle opens lower and falls well into the first candle's range, it shows that sellers now have the upper hand.
Taken together, the three candles describe a shift from strength to hesitation to selling pressure. Many traders read this as a sign that the uptrend may be ending.
How reliable is the Evening Doji star?
The third candle already provides some confirmation, but traders still look for extra evidence before acting on it:
- Prior trend: The pattern only has meaning after a clear uptrend.
- Depth of the third candle: A close further into the body of the first candle shows stronger selling.
- Volume: Higher volume on the third candle suggests more sellers took part.
- Context: A pattern that forms near a resistance level or in overbought conditions, for example on the RSI, carries more weight.
How does the Evening Doji star differ from similar patterns?
Three patterns share the same structure and differ in the middle candle:
- Evening star: The middle candle has a small body that is not a Doji. Many traders consider the Doji version a slightly stronger warning, because it shows complete indecision.
- Bearish Doji star: This is only the first two candles of the Evening Doji star, without the confirming bearish candle.
- Bearish Abandoned baby: The Doji is separated from both neighboring candles by full gaps, including the shadows.
The Morning Doji star is the bullish counterpart of this pattern.
What are the limitations of the pattern?
Like any candlestick pattern, the Evening Doji star describes what has happened, not what will happen. The uptrend can resume after the pattern completes. Because the third candle has already moved a long way down, much of the price move may be over by the time the pattern is complete. Gaps between bodies are also rare in markets that trade around the clock, such as crypto and forex. Traders often place a stop-loss above the high of the Doji to limit losses if the reversal fails.
How to find the Evening Doji star on TradingView
TradingView can detect this pattern for you on any chart:
- Built-in indicator: Open Indicators and search for Evening Doji star (bearish). The indicator marks each occurrence on the chart.
- All candlestick patterns at once: Add the All candlestick patterns indicator to see every supported pattern on one chart and choose which ones to display in its settings.
- Trend filter: In the indicator settings, choose how the prior trend is detected (based on SMA 50, or SMA 50 and SMA 200), or turn trend detection off.
- Alerts: Create an alert on the indicator to get notified when a new pattern forms.
Understanding the Evening Doji star
The Evening Doji star is a three-candle pattern made up of a long bullish candle, a Doji that gaps above it, and a long bearish candle that closes below the midpoint of the first candle. It signals a possible reversal from an uptrend to a downtrend. The third candle provides built-in confirmation, but traders still check volume, the next candles, and other indicators before acting on it.