Bearish Falling window: interpreting a price gap within a downtrend
The bearish Falling window is a two-candle continuation pattern that forms during a downtrend. It is defined by a price gap, called a "window," between the low of the first candle and the high of the second candle. The gap shows that sellers pushed prices lower without any trading in between, and many traders read it as a sign that the downtrend may continue.
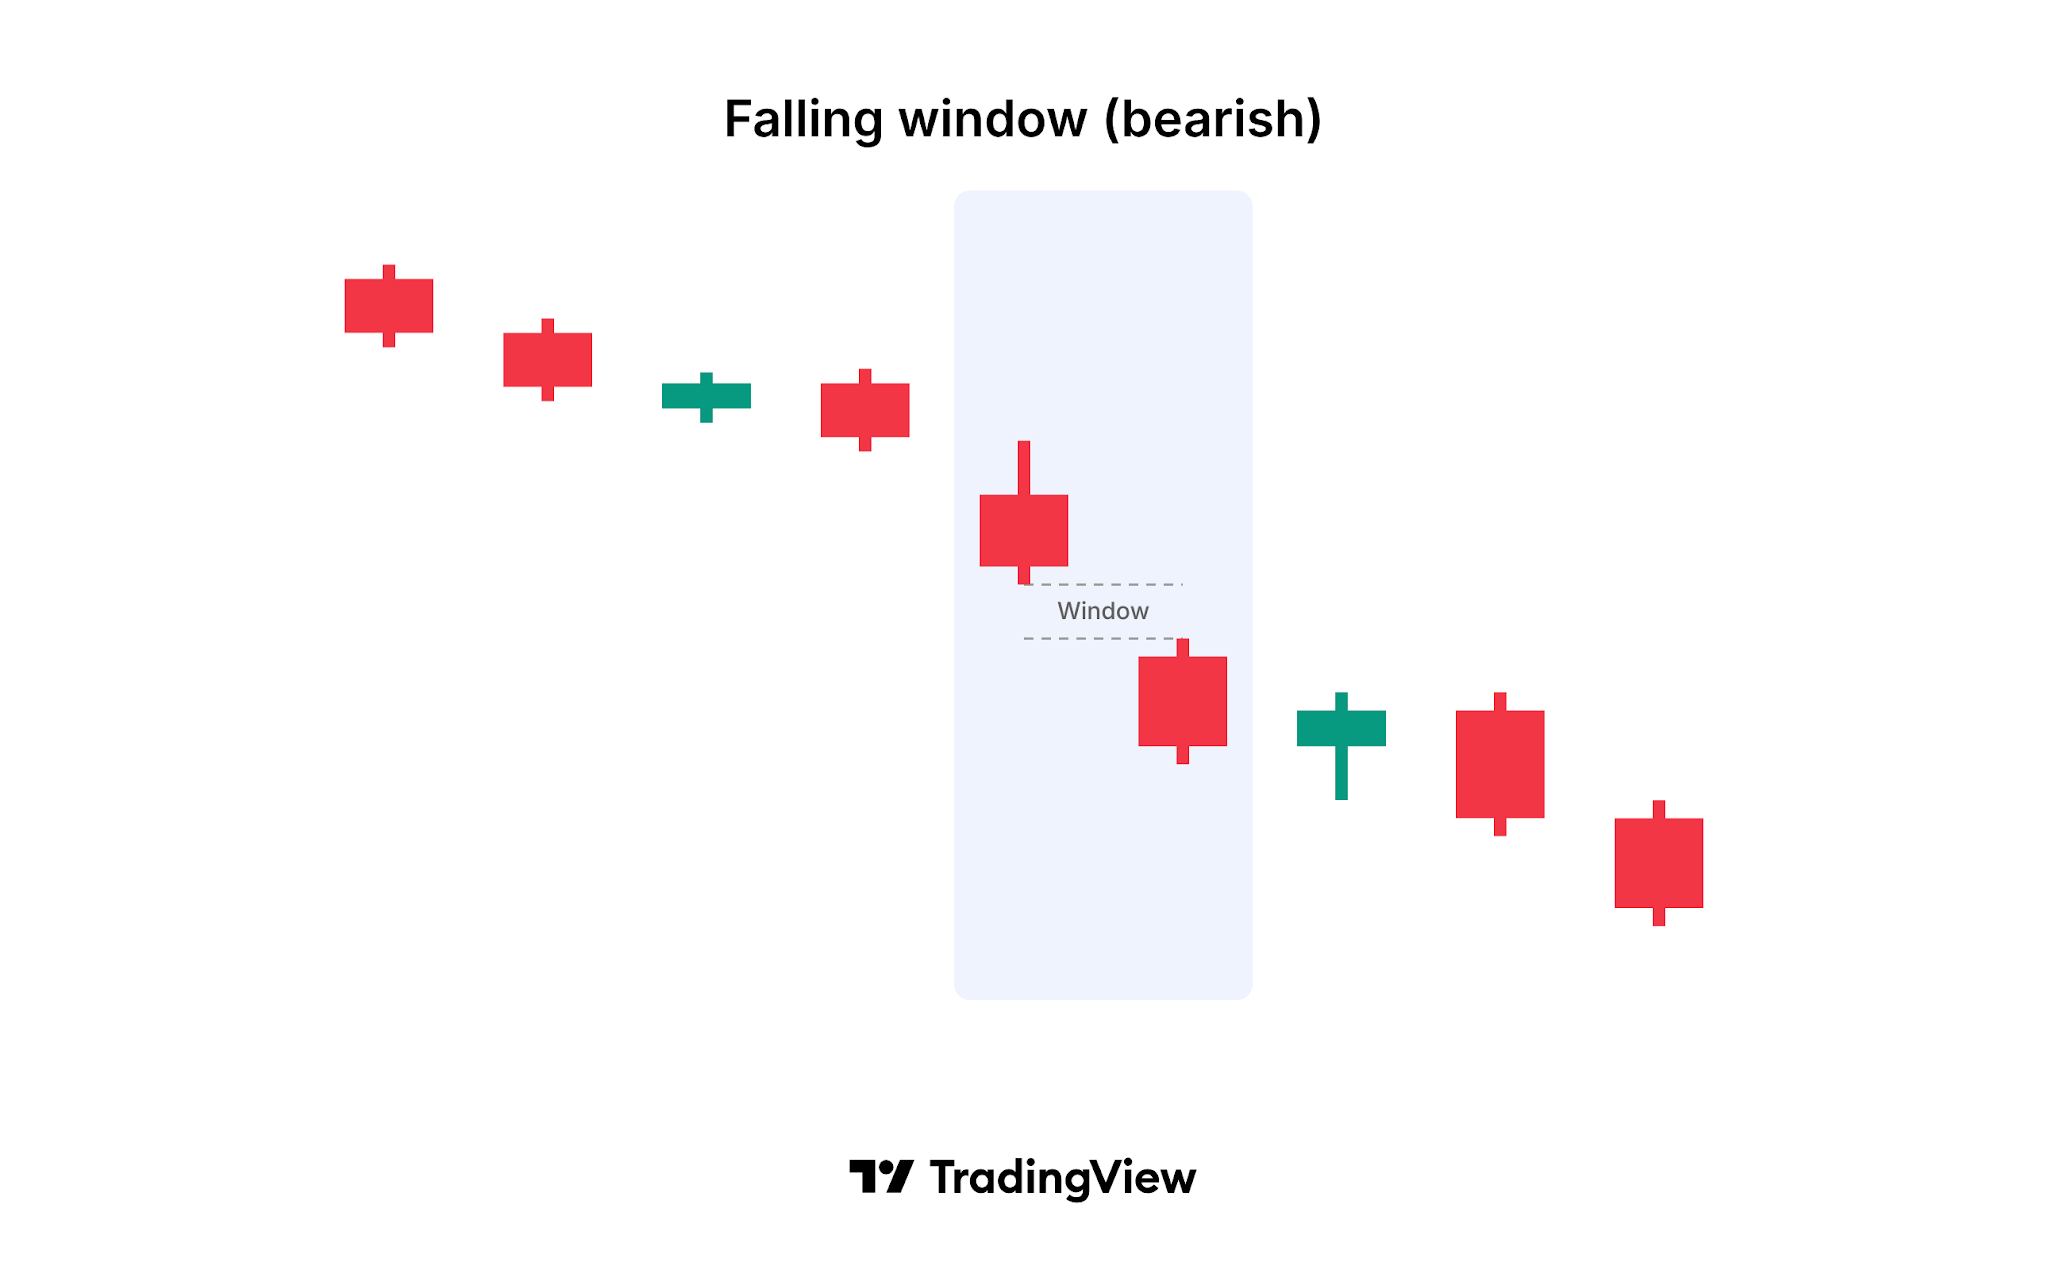
What does a bearish Falling window look like?
The pattern forms over two consecutive candles:
- First candle: A candle of any type that forms as part of an existing downtrend. It can be bullish (white or green) or bearish (black or red).
- Second candle: A candle of any type whose high is below the low of the first candle.
- The window: The empty space between the first candle's low and the second candle's high. No part of the two candles, including their shadows, overlaps.
The only candle that does not qualify is the Four-price Doji, where the open, high, low, and close are all the same. Unlike most candlestick patterns, the shape and color of the candles matter less than the gap between them.
What does the pattern tell you?
A gap down means that the market opened below the previous candle's low and never traded back up into that range. Selling pressure was strong enough that buyers were not willing to step in at the earlier prices. In a market that is already falling, this suggests that sellers remain in control and that the move lower may have more room to run.
How reliable is the bearish Falling window?
The Falling window is a continuation signal, so it carries the most weight when the downtrend is already clear.
Traders usually look for extra evidence before acting on the signal:
- Prior trend: The pattern only has meaning inside an existing downtrend.
- Gap size: A wider gap relative to recent candle ranges suggests stronger selling pressure.
- Volume: Higher volume on the second candle suggests broad participation in the move.
- Follow-through: Prices that stay below the window on the next candles support the continuation. A close back inside the gap weakens the signal.
How does the Falling window work as resistance?
The upper edge of the window is the low of the first candle, and the lower edge is the high of the second candle. If prices rally after the pattern, traders often treat this zone as resistance. A rally that stalls inside the gap, or just below it, is consistent with the downtrend continuing. A close above the top of the window, the low of the first candle, means the gap has been filled, and many traders then consider the pattern no longer valid.
What are the limitations of the pattern?
Like any candlestick pattern, the bearish Falling window describes what has happened, not what will happen. Gaps can be filled quickly, especially in volatile markets. True gaps are also rare in markets that trade around the clock, such as crypto and forex, where one candle's close is usually the next candle's open, so the pattern appears more often in stocks and futures. A gap caused by a one-off event, such as an earnings report, may not reflect the broader trend. Traders often combine the pattern with stop-loss levels, for example above the top of the window, to limit losses if the downtrend does not continue.
How to find the bearish Falling window on TradingView
TradingView can detect this pattern for you on any chart:
- Built-in indicator: Open Indicators and search for Falling window (bearish). The indicator marks each occurrence on the chart.
- All candlestick patterns at once: Add the All candlestick patterns indicator to see every supported pattern on one chart and choose which ones to display in its settings.
- Trend filter: In the indicator settings, choose how the prior trend is detected (based on SMA 50, or SMA 50 and SMA 200), or turn trend detection off.
- Alerts: Create an alert on the indicator to get notified when a new pattern forms.
Understanding the bearish Falling window
The bearish Falling window is a two-candle continuation pattern in which the high of the second candle is below the low of the first, leaving a gap during a downtrend. It suggests that sellers remain in control and that the decline may continue. The gap often acts as resistance on later rallies, and a close above it weakens the signal, so traders confirm the pattern with volume, follow-through, and other indicators before acting on it.