Bearish Downside Tasuki gap: how to confirm a downtrend will continue
The Downside Tasuki gap is a three-candle continuation pattern that appears during a downtrend. Two bearish candles are separated by a gap down, and a bullish third candle moves back into that gap without closing it. The failure of buyers to fill the gap suggests that sellers are still in control and the decline may continue.
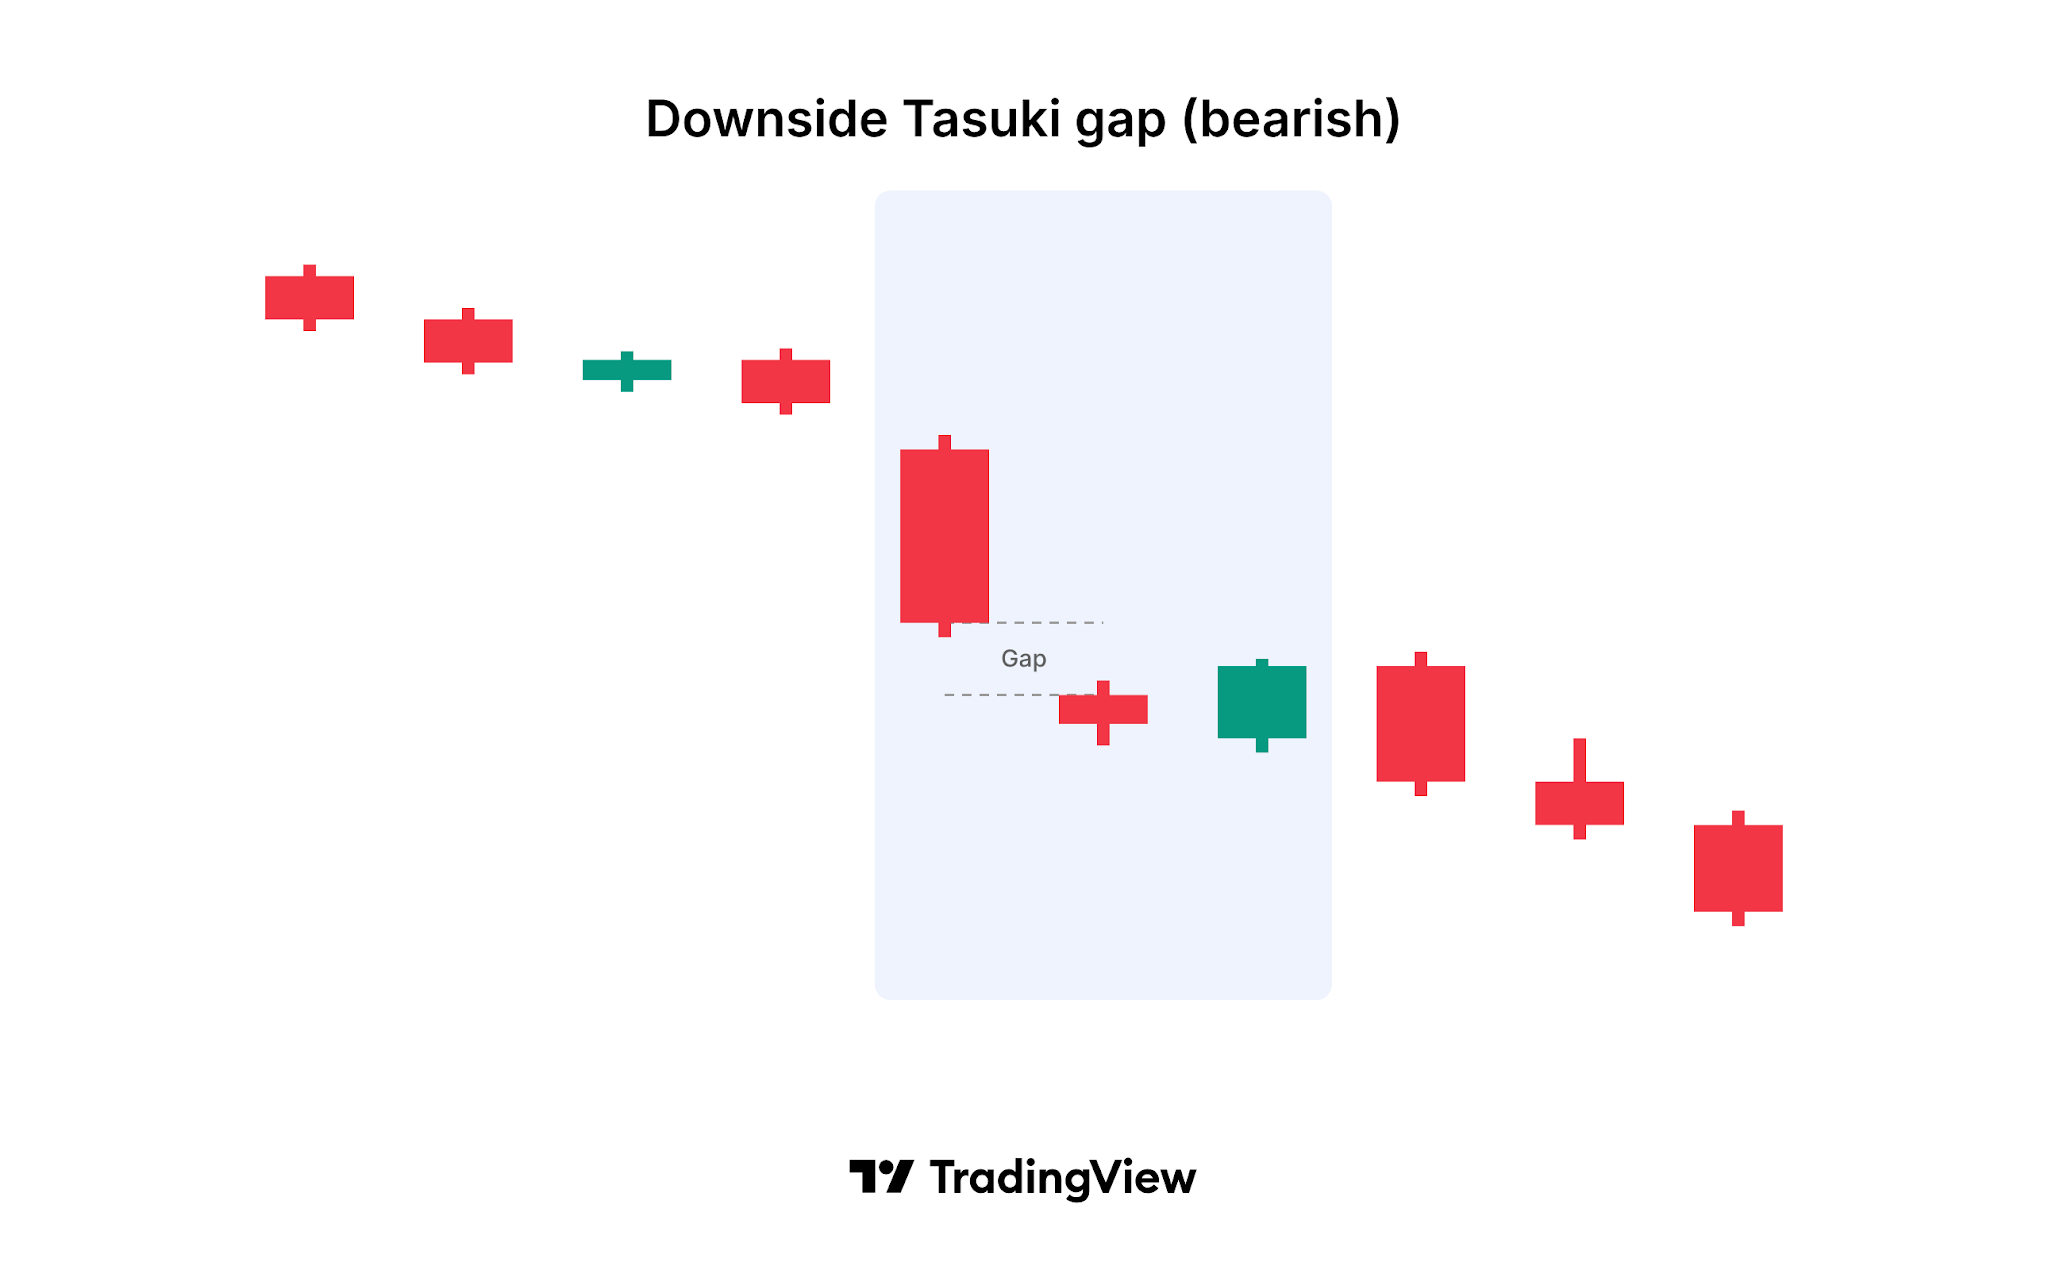
What does a Downside Tasuki gap look like?
The pattern forms over three consecutive candles:
- First candle: A long bearish (black or red) candle that continues the existing downtrend.
- Second candle: A smaller bearish candle whose body gaps below the body of the first candle.
- Third candle: A bullish (white or green) candle that opens within the body of the second candle and closes inside the gap between the first two candles, without reaching the body of the first candle.
The gap between the first and second candles stays partly open after the third candle closes. That unfilled gap is the core of the pattern.
What does the pattern tell you?
The first two candles show strong selling: the price falls, then opens even lower and keeps falling. The third candle shows buyers stepping in and pushing the price back up, which can look like the start of a recovery. Because the rise stops before the gap is filled, it suggests the buying is limited, for example profit-taking by sellers, rather than a real change in control.
Many traders read the unfilled gap as an area of resistance. As long as the price stays below it, the downtrend is considered intact.
How reliable is the Downside Tasuki gap?
The Downside Tasuki gap is a less common pattern, and its continuation signal is usually considered moderate. Traders look for extra evidence before acting on it:
- Prior trend: The pattern only has meaning within a clear downtrend.
- The gap holds: If later candles close above the gap and fill it, the continuation signal is cancelled.
- Size of the third candle: A third candle that only enters a small part of the gap shows weaker buying than one that comes close to filling it.
- Confirmation: A lower close on the next candle adds weight to the continuation.
- Volume: Lower volume on the bullish third candle than on the bearish candles suggests the bounce lacks support.
How does the Downside Tasuki gap differ from a Falling window?
A Falling window is simply a gap down between two candles, with no overlap between the high of the second candle and the low of the first. The Downside Tasuki gap starts with a gap between the bodies and then adds a test of that gap by a bullish candle. The bullish counterpart of this pattern is the Upside Tasuki gap.
What are the limitations of the pattern?
Like any candlestick pattern, the Downside Tasuki gap describes what has happened, not what will happen. A bounce that stops short of the gap can still develop into a reversal on the following candles. The pattern also needs a gap between bodies, which is rare in markets that trade around the clock, such as crypto and forex. Traders often place a stop-loss above the top of the gap to limit losses if the downtrend does not continue.
How to find the Downside Tasuki gap on TradingView
TradingView can detect this pattern for you on any chart:
- Built-in indicator: Open Indicators and search for Downside Tasuki gap (bearish). The indicator marks each occurrence on the chart.
- All candlestick patterns at once: Add the All candlestick patterns indicator to see every supported pattern on one chart and choose which ones to display in its settings.
- Trend filter: In the indicator settings, choose how the prior trend is detected (based on SMA 50, or SMA 50 and SMA 200), or turn trend detection off.
- Alerts: Create an alert on the indicator to get notified when a new pattern forms.
Understanding the Downside Tasuki gap
The Downside Tasuki gap is a three-candle pattern made up of two bearish candles separated by a gap down and a bullish candle that closes inside the gap without filling it. It signals that a downtrend may continue. Traders watch whether the gap holds as resistance and usually confirm the signal with the next candles, volume, and other indicators before acting on it.