Understanding volume candle charts
Volume candles are similar to standard candles except that they vary in thickness depending on the trading volume. This chart type can help you more easily identify the time periods when the most trading has occurred.
CONTENTS:
- What are volume candlesticks
- Volume candles vs standard candles
- Enabling the chart type
- Volume candles settings
- Candlestick patterns
What are volume candlesticks
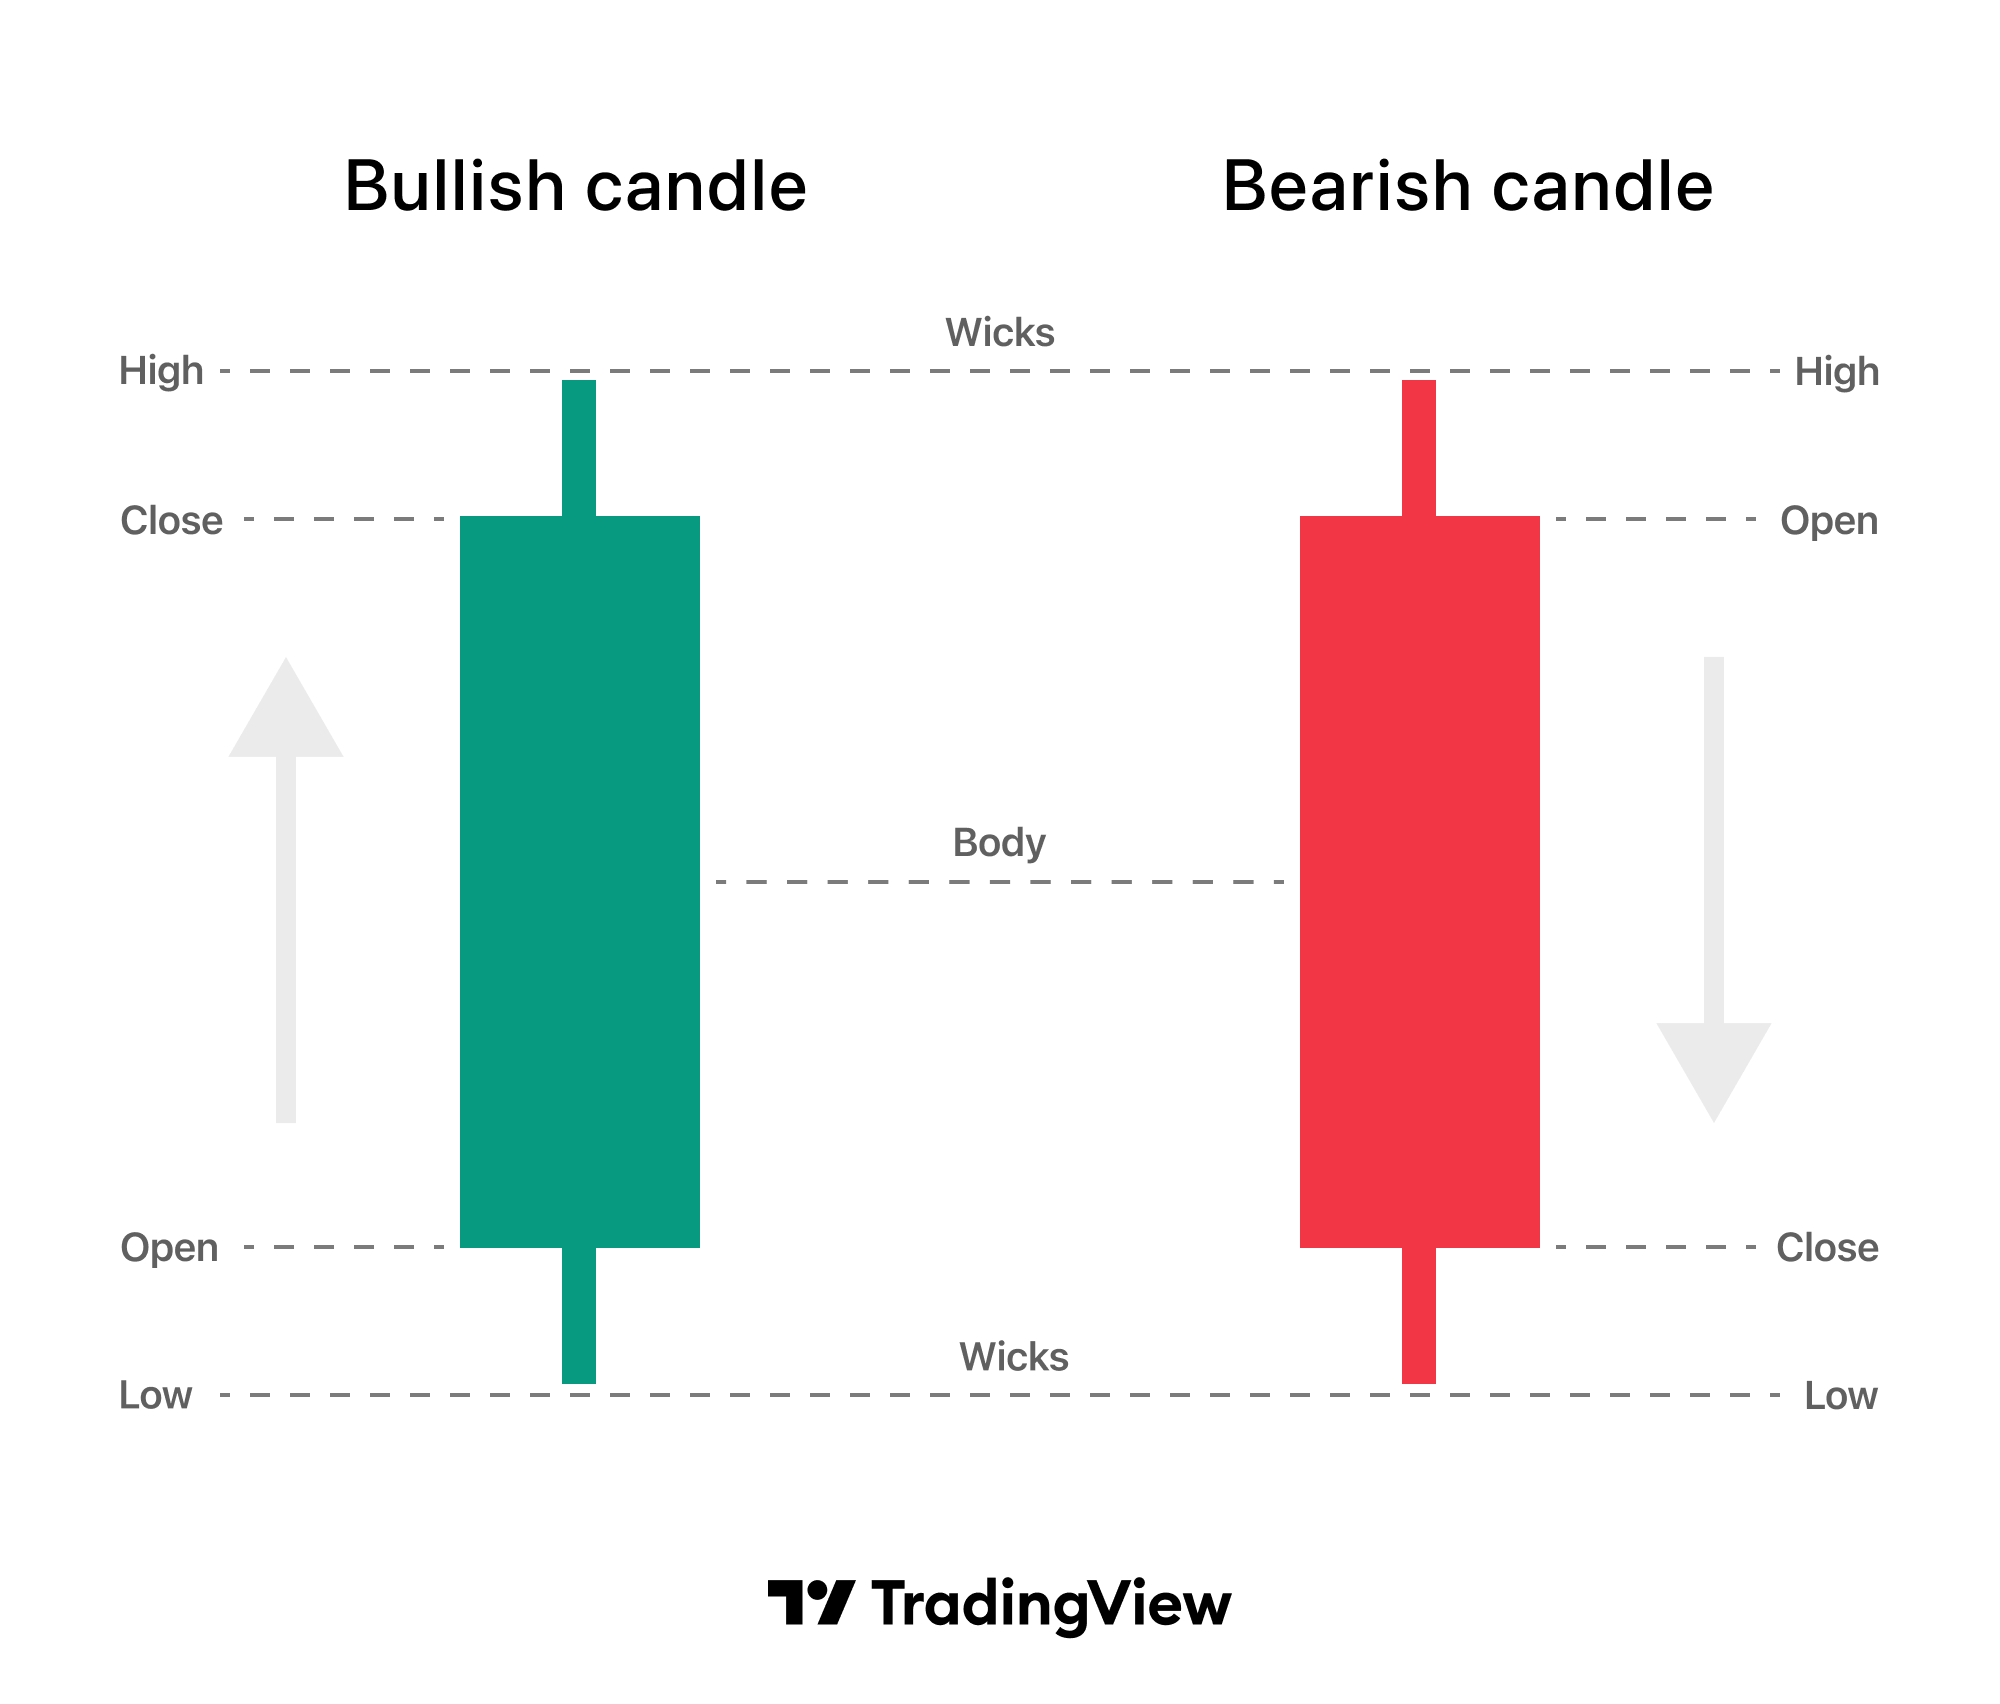
If you are familiar with standard candlesticks, you may already know that each candle consists of a rectangular body that represents open and close prices and wicks/shadows/tails that indicate the highest and lowest prices during that period.
Volume is one of the most important metrics in trading. High volume may tell you whether the price movement is caused by market participants' interest in that asset and thus it is more likely to be the "true" price direction.
On the contrary, low volume may indicate a false breakout of chart patterns, where the price breaches the boundary but returns to its previous values.
Volume candles vs standard candles
As mentioned earlier, the only difference between these two chart types is that volume candles are displayed with different thickness of their bodies.
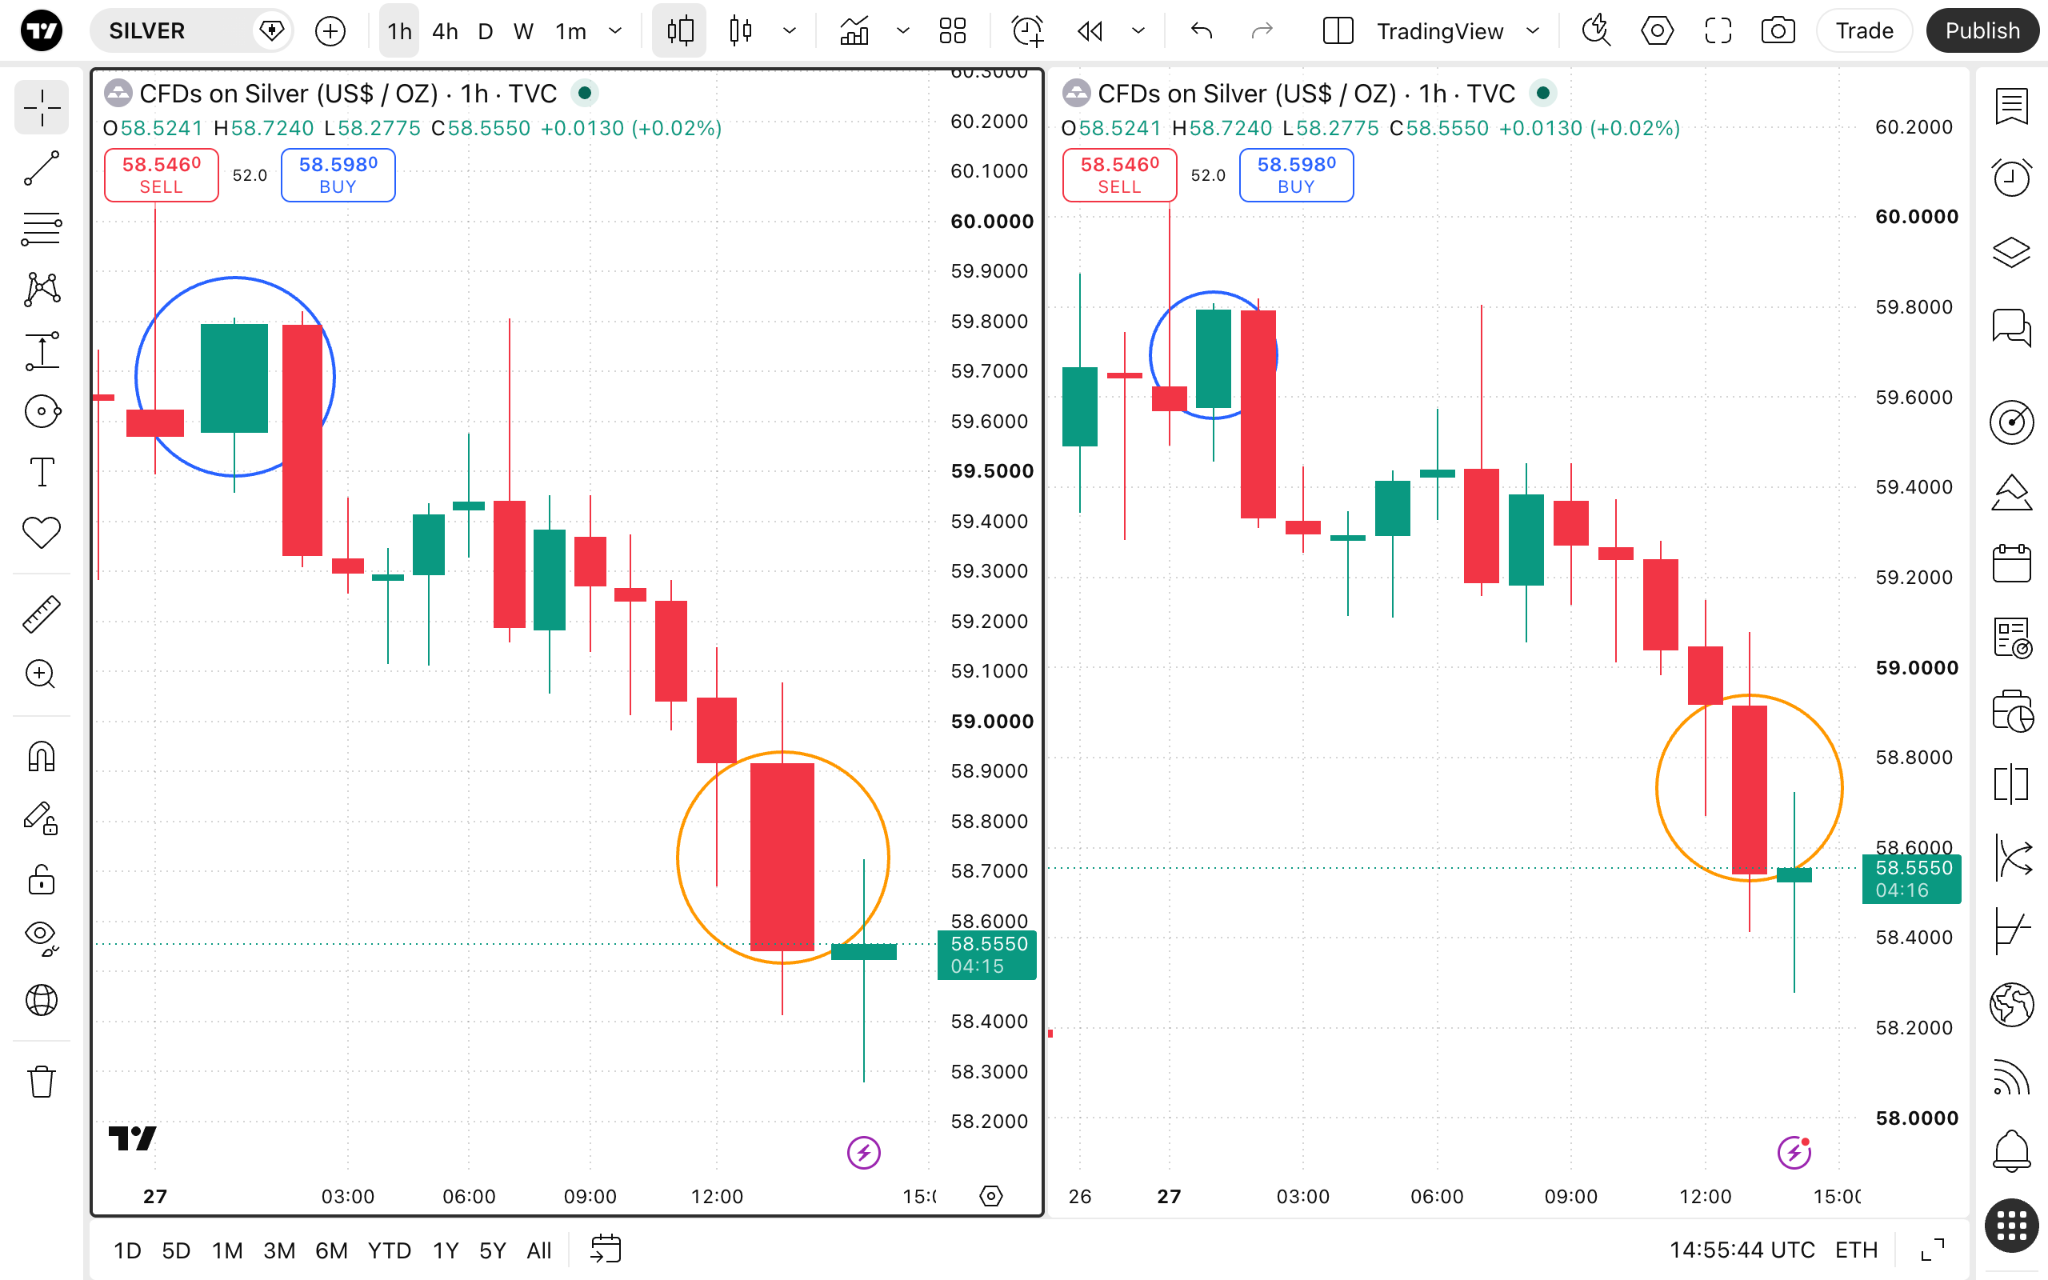
As a quick summary of their benefits, volume candles:
- Give you a clear picture of open, high, low, and close prices.
- Provide an easy way to interpret the relationship between price and volume.
- Work with candlestick patterns.
Enabling the chart type
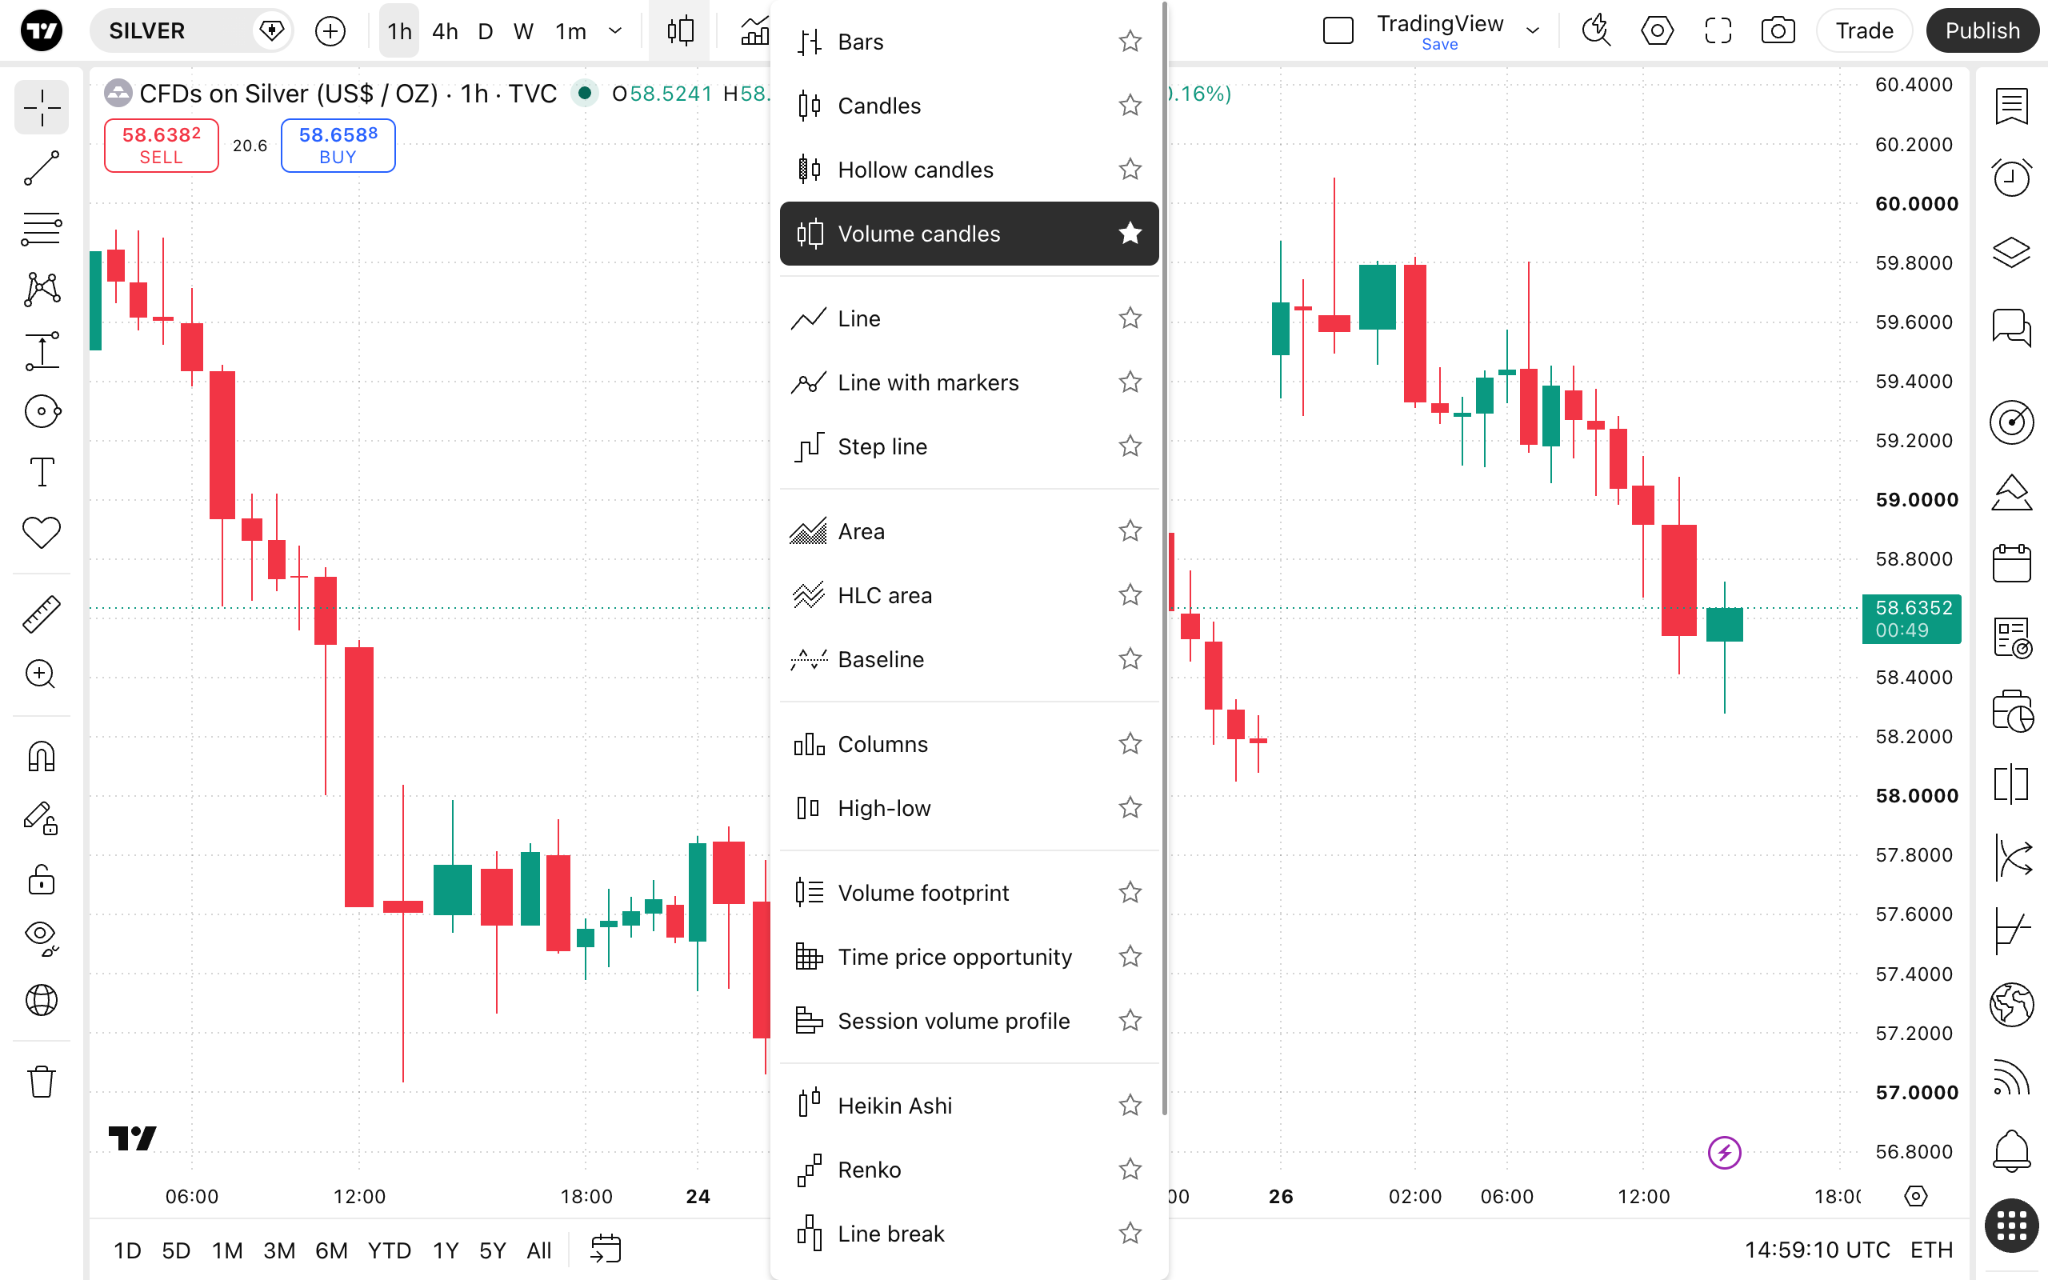
On Supercharts, open the сhart type menu on the top toolbar, and select "Volume candles."
Volume candles settings
You can customize volume candles by adjusting their colors and assignment type to bullish and bearish.
To do this, find the gear button on the top toolbar and open the "Symbol" tab.
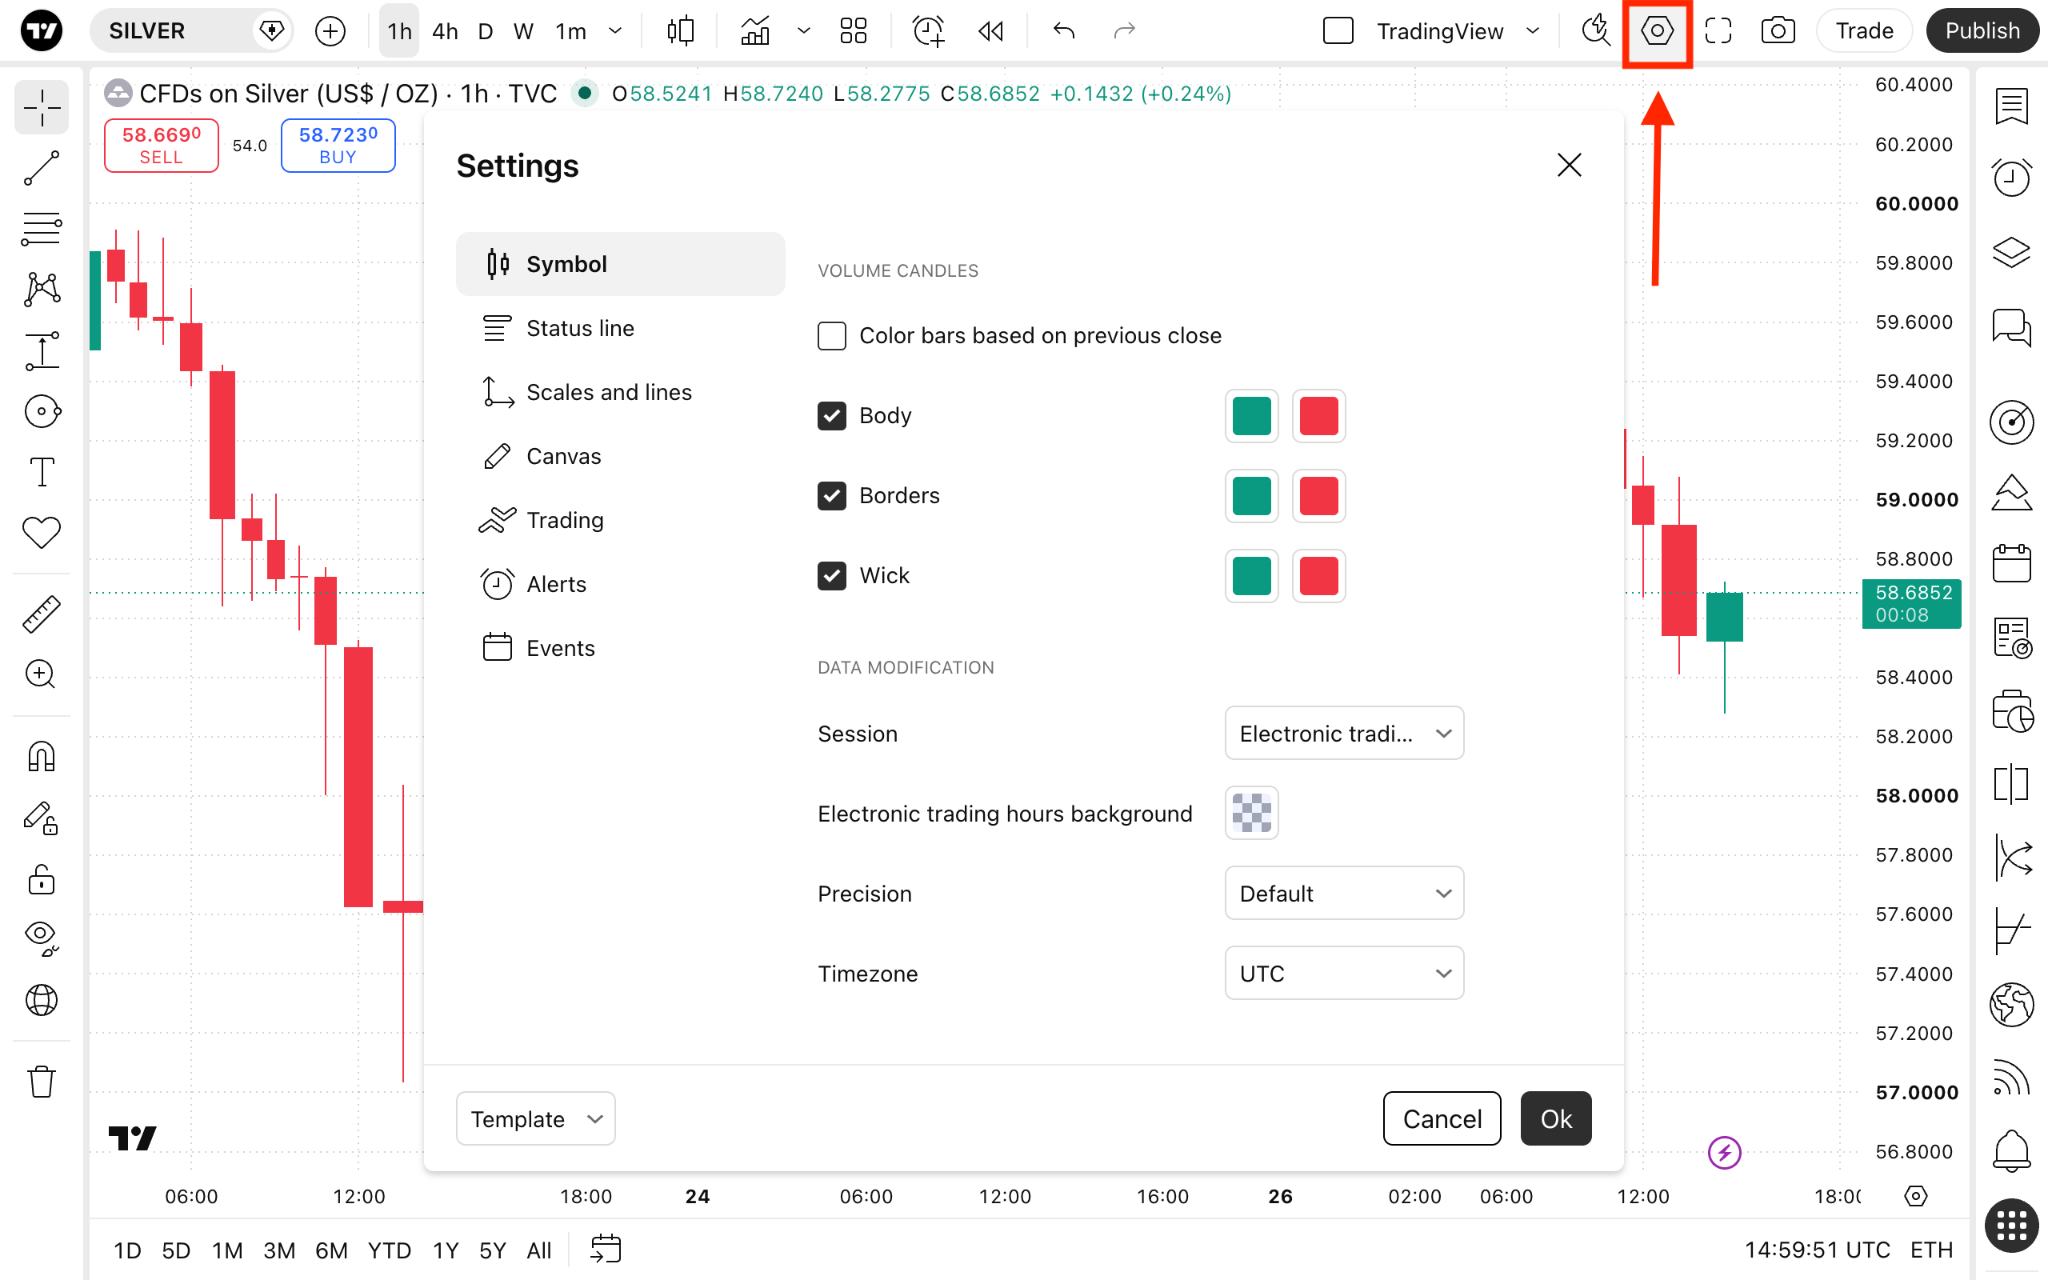
In the "Volume candles" section, you adjust the following parameters:
- Color based on previous close: With this setting on, the color of each bar will be determined by whether its close price is higher (green) or lower (red) than the close price of the previous bar, rather than by the bar's own open and close prices.
- Body: Change the color and fill of the candles' bodies.
- Borders: Change the color of the candles' edges.
- Wick: Change the color of the candles' wick.
Candlestick patterns
To maximize the utility of candlestick charts, you can use candlestick pattern indicators. On the top toolbar, click the "Indicators, metrics, and strategies" menu → "Technicals" → "Patterns" and scroll down to "Candlestick patterns."
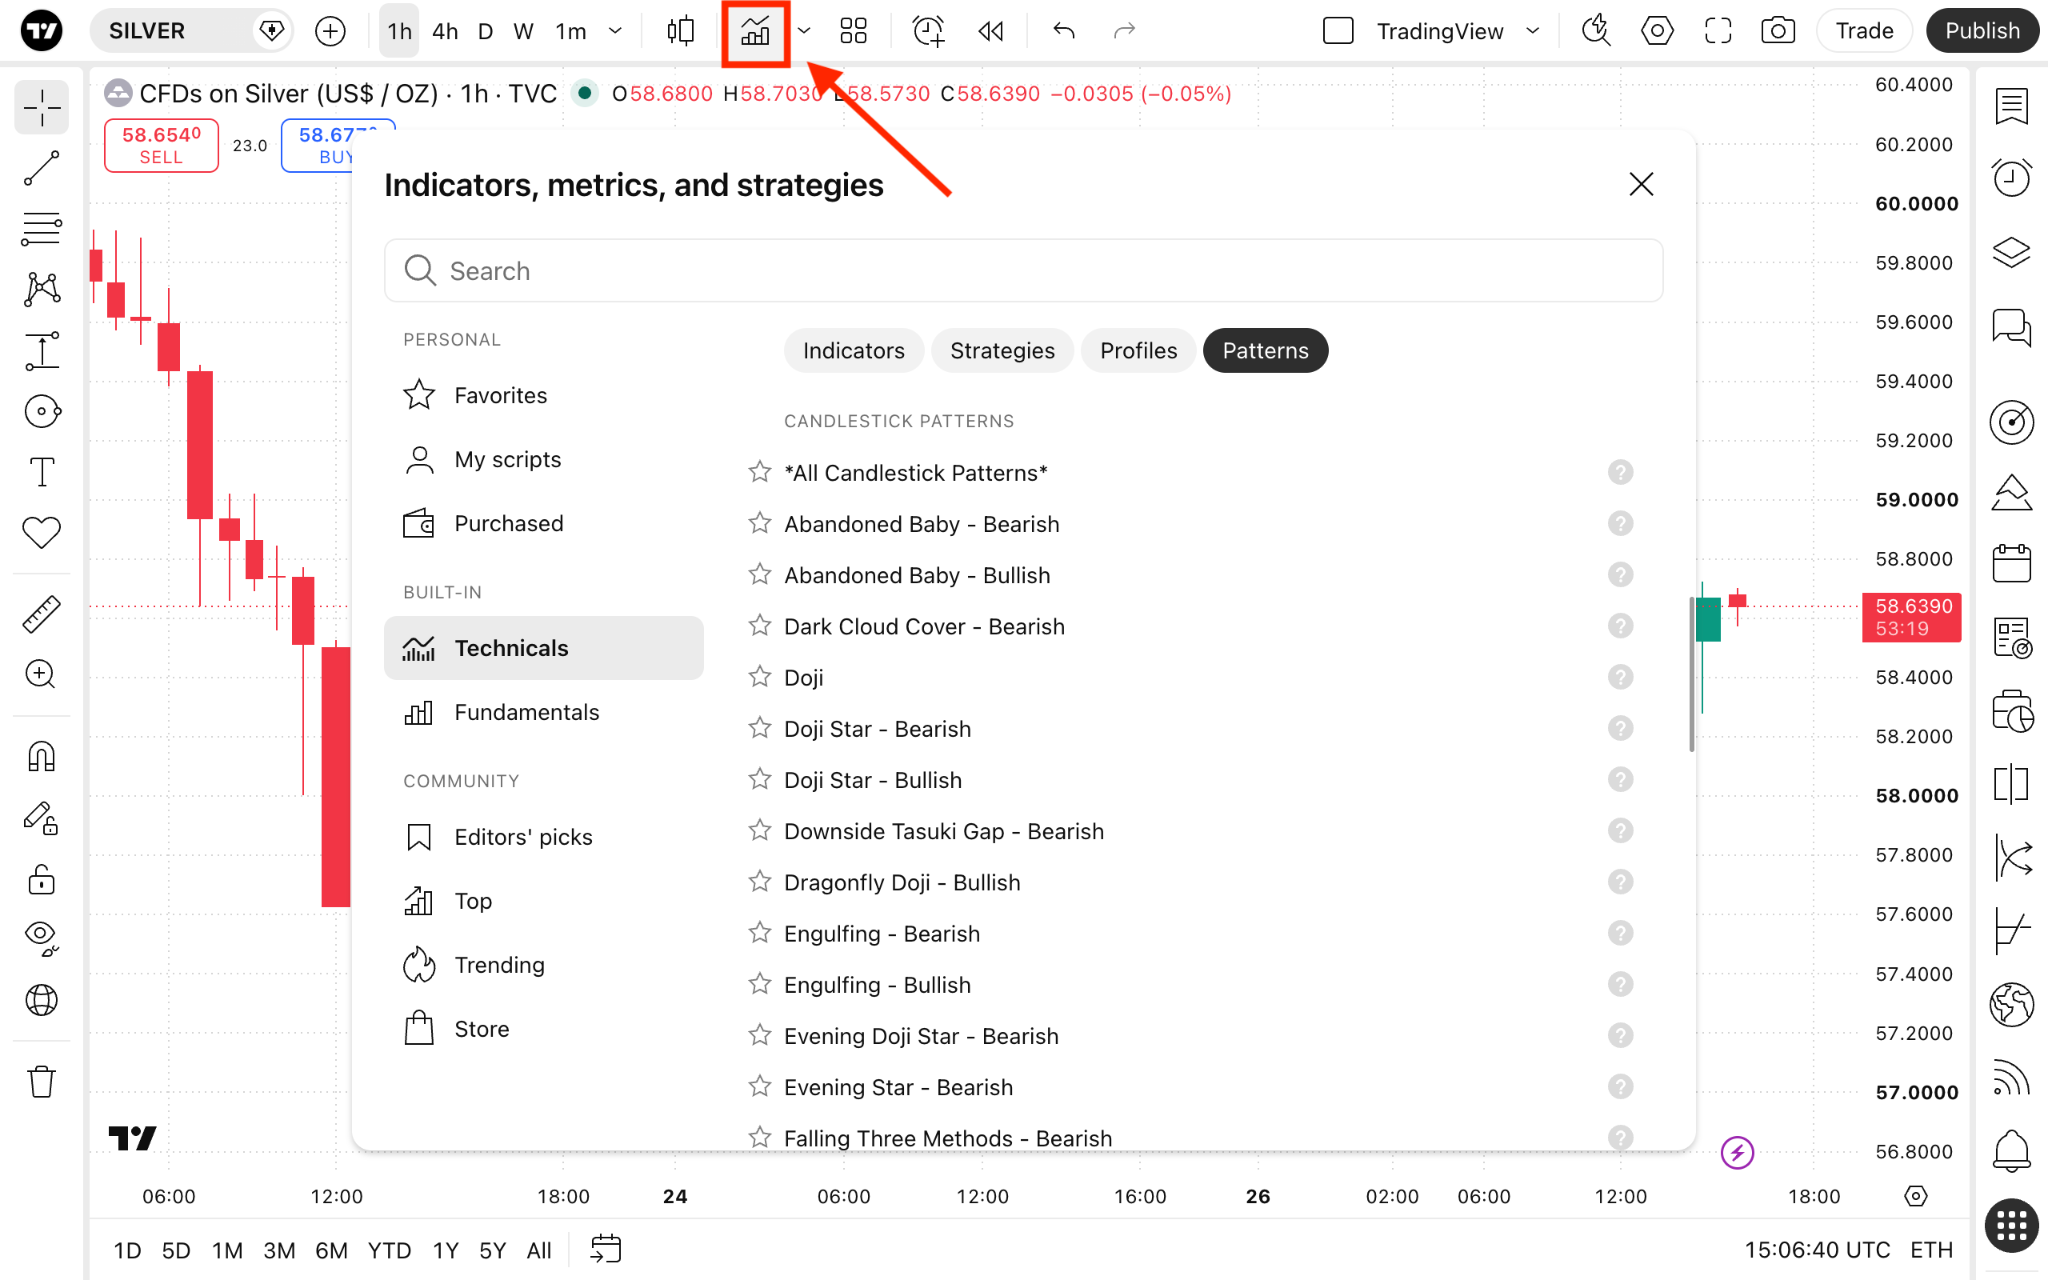
These automated tools detect specific patterns and provide insights into their potential implications.
Volume candles in a nutshell
Volume candles are a step toward the understanding of true price movements. Their visual appearance can help you avoid potential false signals of other technical analysis tools regarding trend changes or continuation.
Also read: