Hollow candle charts explained
Hollow candles are a type of Japanese candlesticks that allow for more advanced analysis, using color and fill to indicate both price direction and the relationship between open and close prices. With them, you can more easily spot trend reversals and market shifts.
CONTENTS:
- How to read hollow candles
- Hollow candles vs standard candles
- Enabling the chart type
- Hollow candles settings
How to read hollow candles
Hollow candlesticks consist of a rectangular body that represents open and close prices for a specific time period, as well as wicks (or shadows) that indicate the highest and lowest prices during that period.
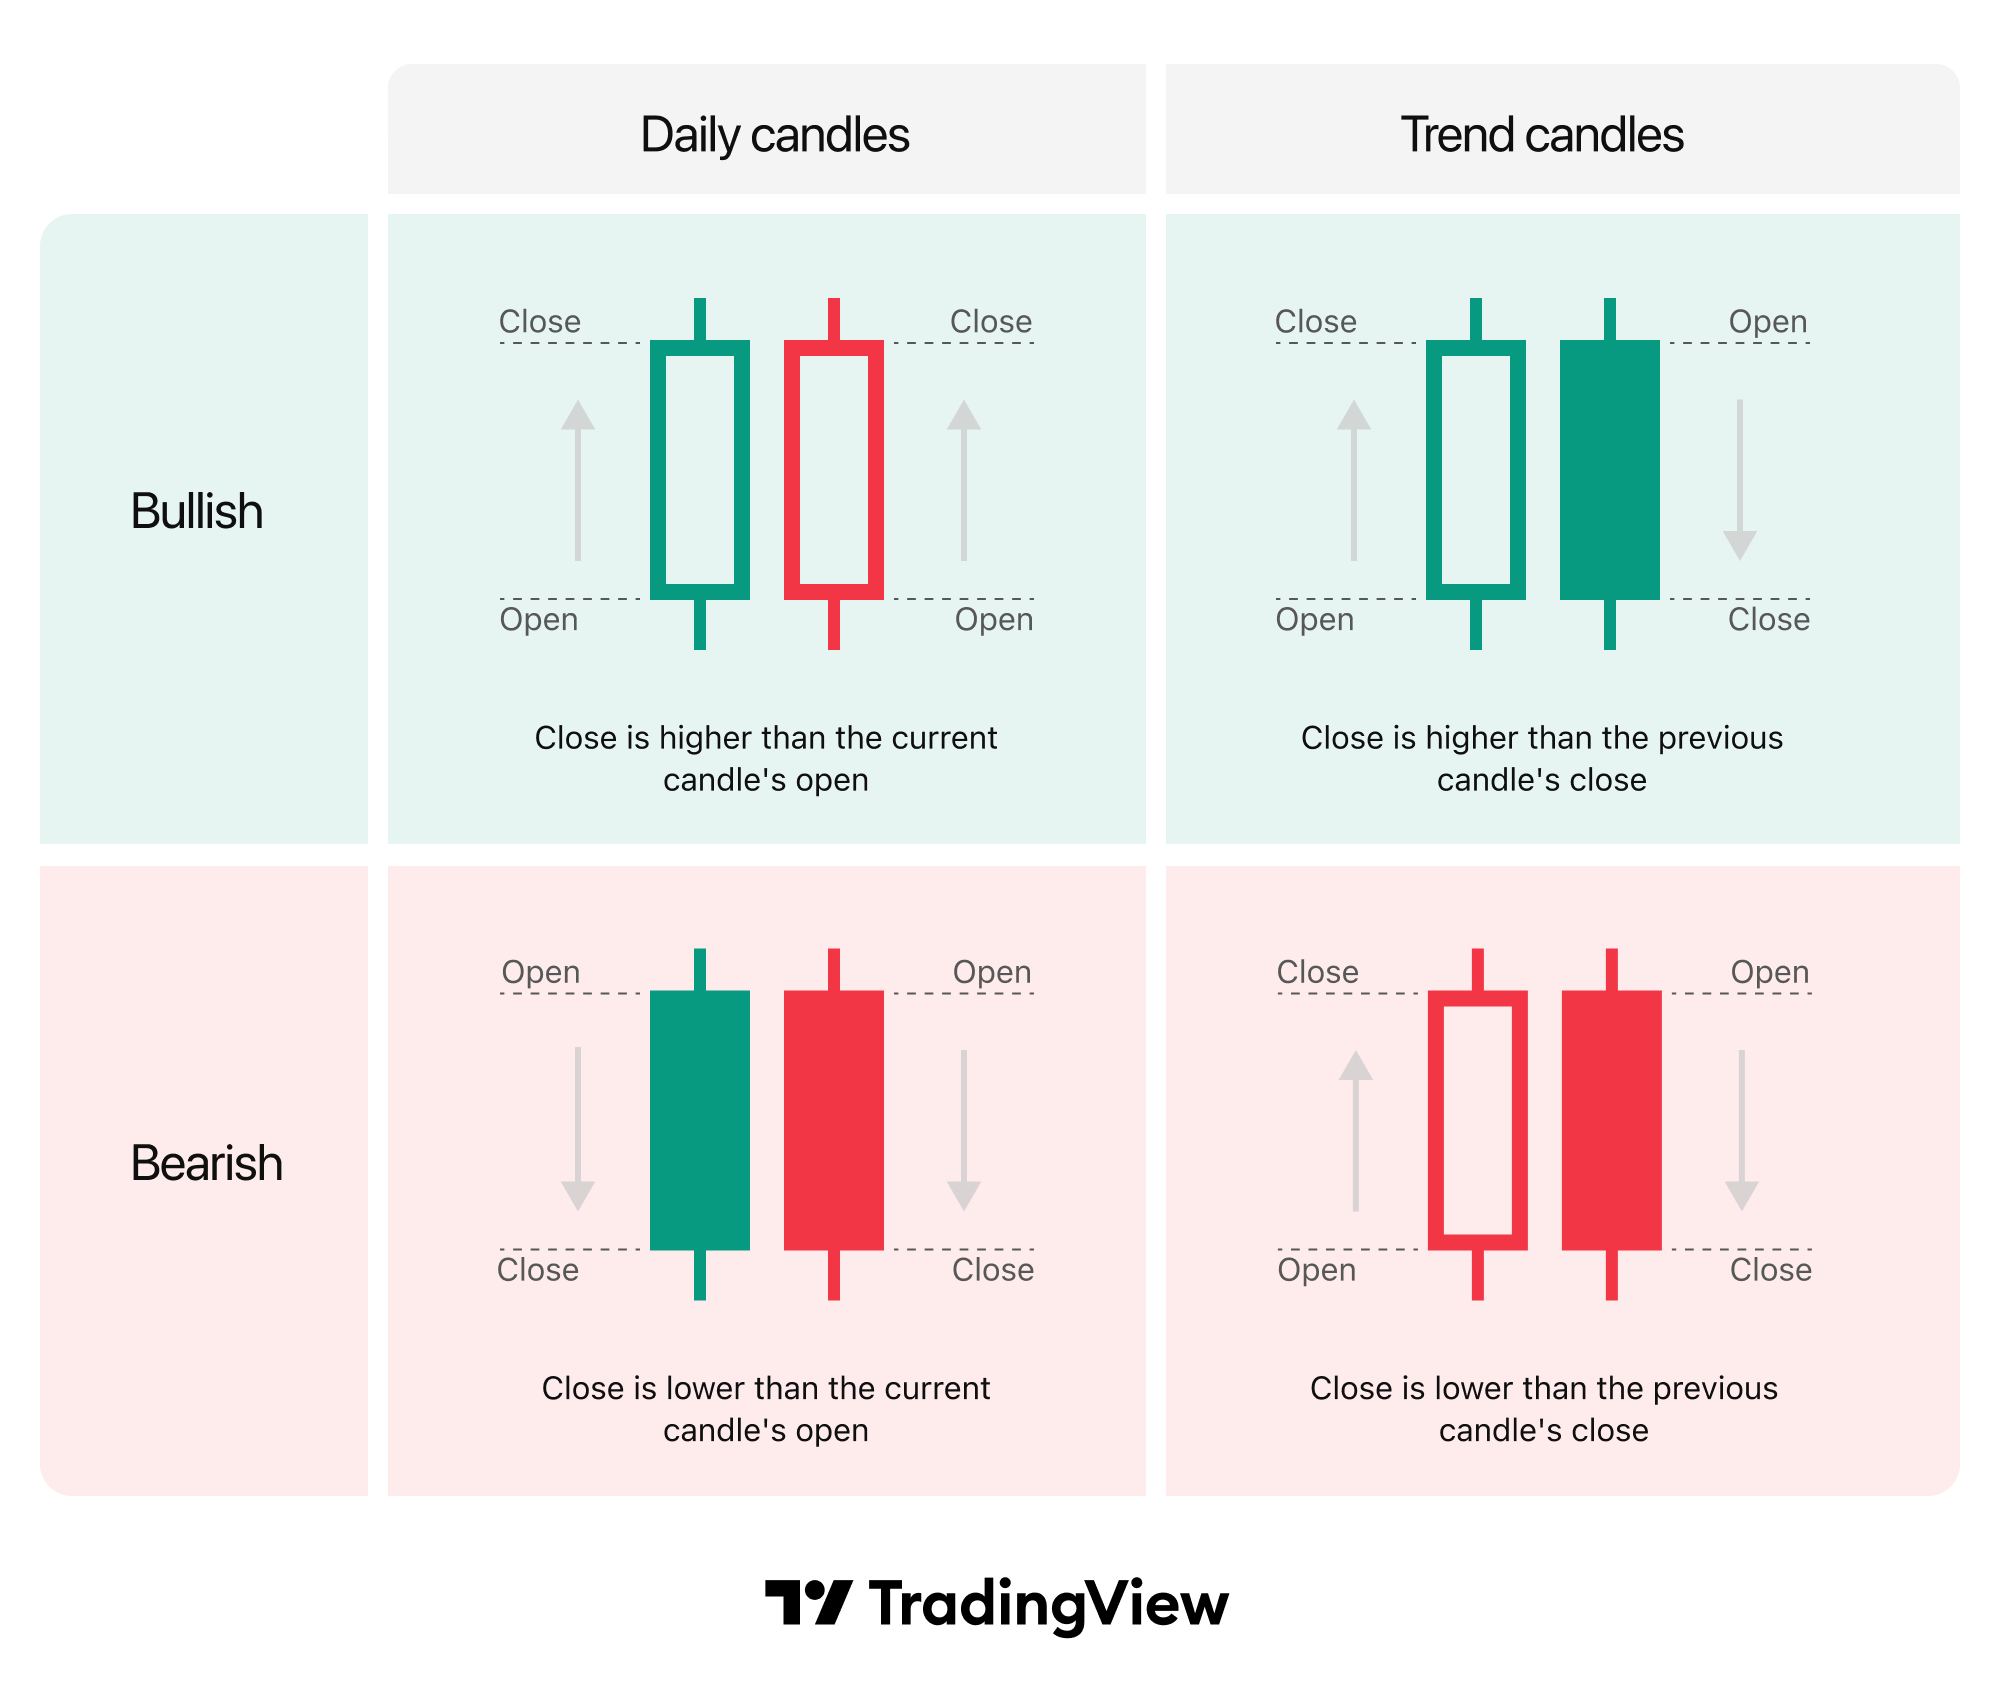
Whereas standard candles are always filled, hollow candles can be either filled or hollow. This depends on whether the close price is higher or lower than the open price.
The color of a candle is determined by comparing its close price relative to the previous candlestick.
There are four types of hollow candles. Below, they are listed starting from the most bullish to the most bearish:
- Green hollow: Close is higher than the current open and the previous close.
- Green filled: Close is lower than the current open but higher than the previous close.
- Red hollow: Close is higher than the current open but lower than the previous close.
- Red filled: Close is lower than the current open and the previous close.
Hollow candles vs standard candles
While both chart types are widely used by traders, they both have their own benefits and limitations.
Hollow candles
- Help understand trend changes, showing the relationship of close prices between the current and previous periods.
- Provide clearer information about accumulation and distribution phases, signalling trend continuation or potential reversal (clusters of hollow candles signal accumulation phases, while filled candles appear during distribution phases).
Standard candles
- Provide clarity due to only-filled-type candles, however, may mislead you with false reversal signals.
- Some candlestick patterns are easier to spot with this type of chart.
Enabling the chart type
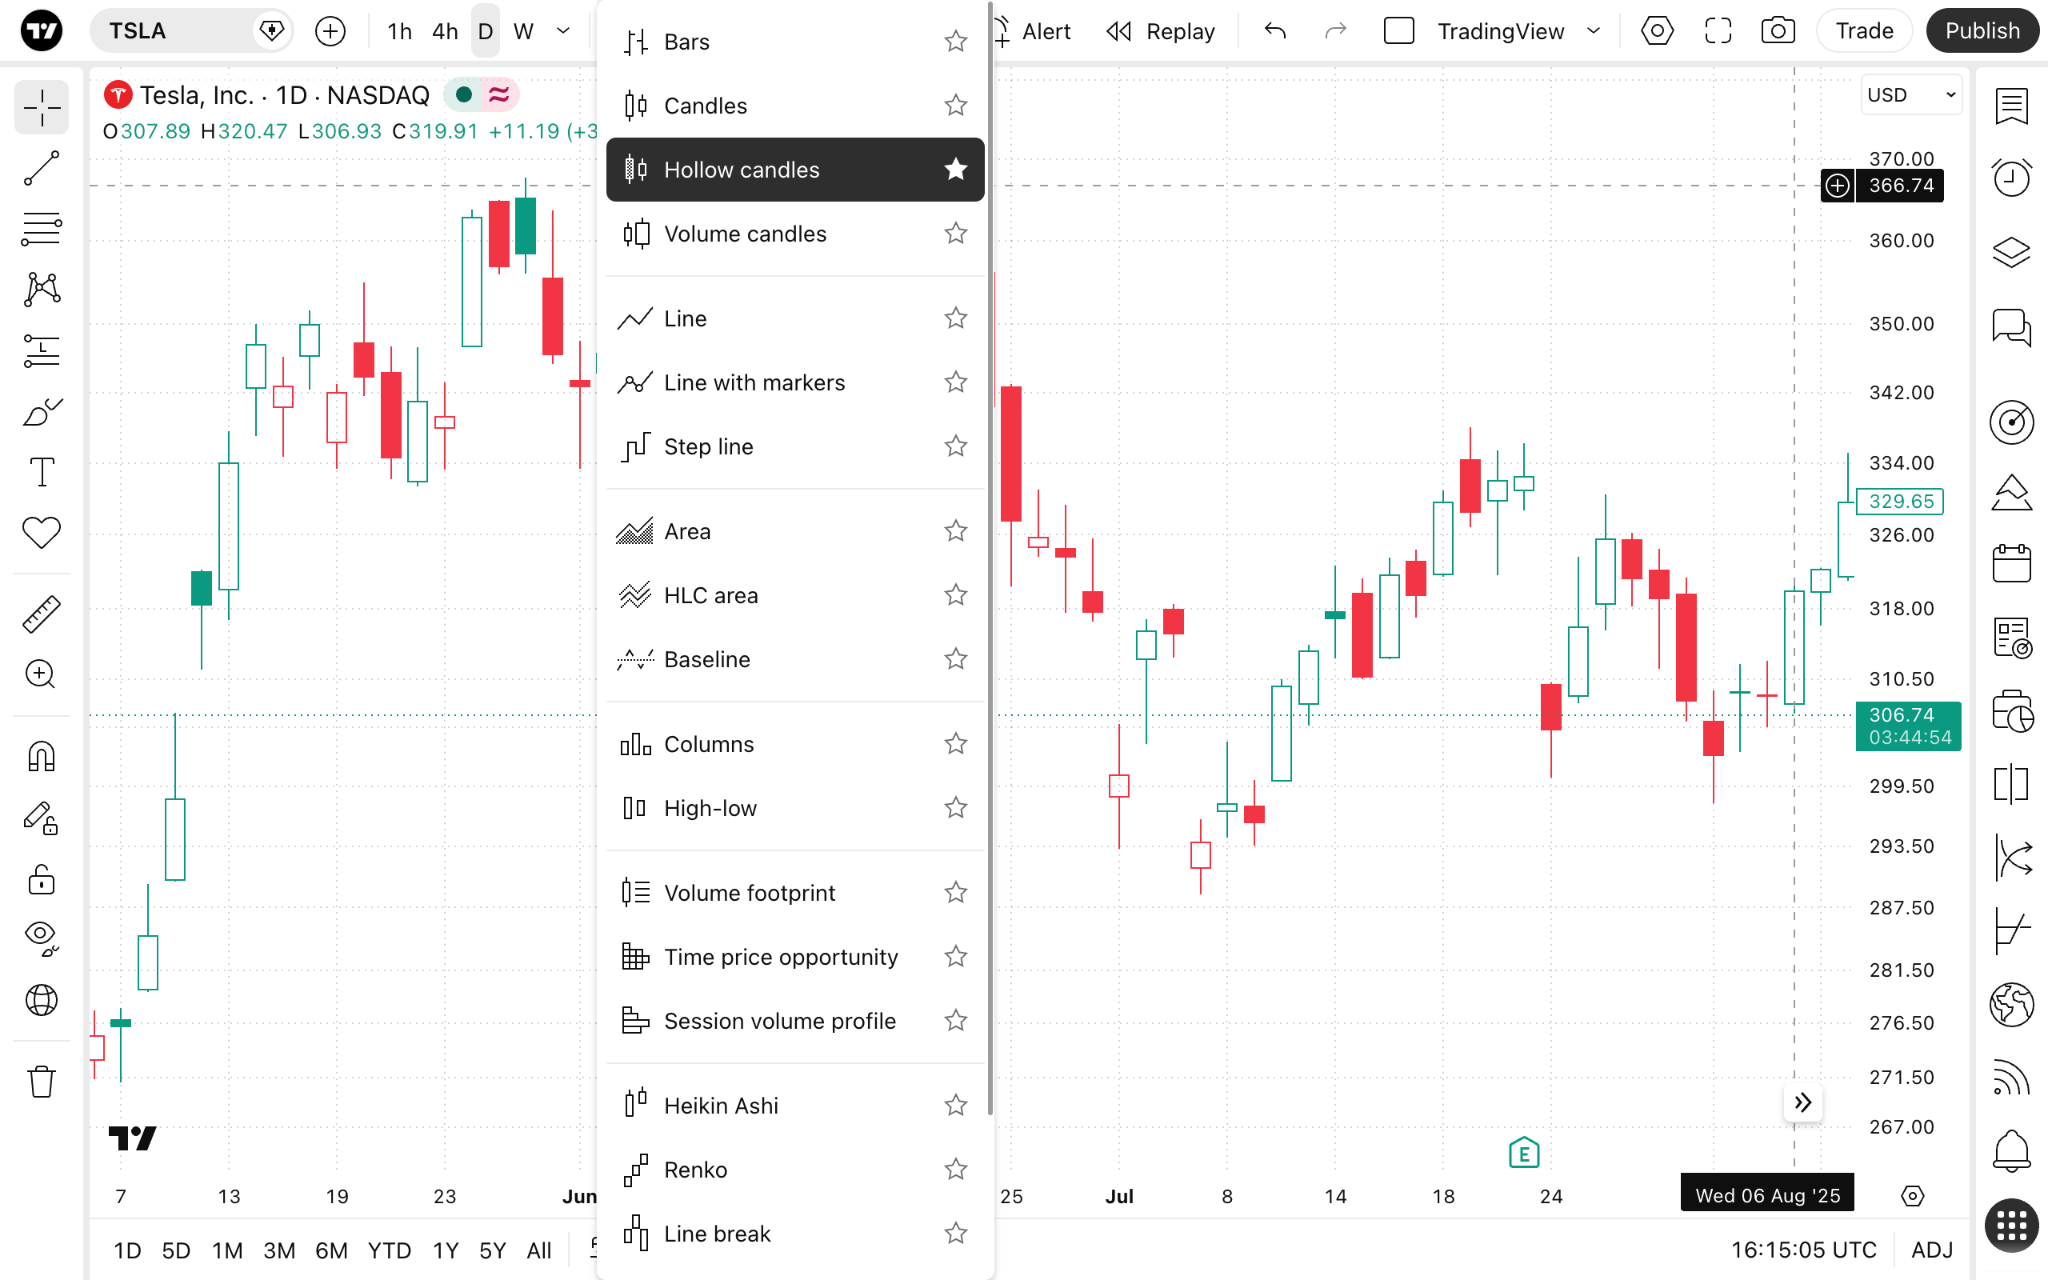
On Supercharts, open the сhart type menu on the upper toolbar, and select "Hollow candles."
Hollow candles settings
You can customize hollow candles by adjusting their colors. To do this, find the gear button on the top toolbar, and open the "Symbol" tab.
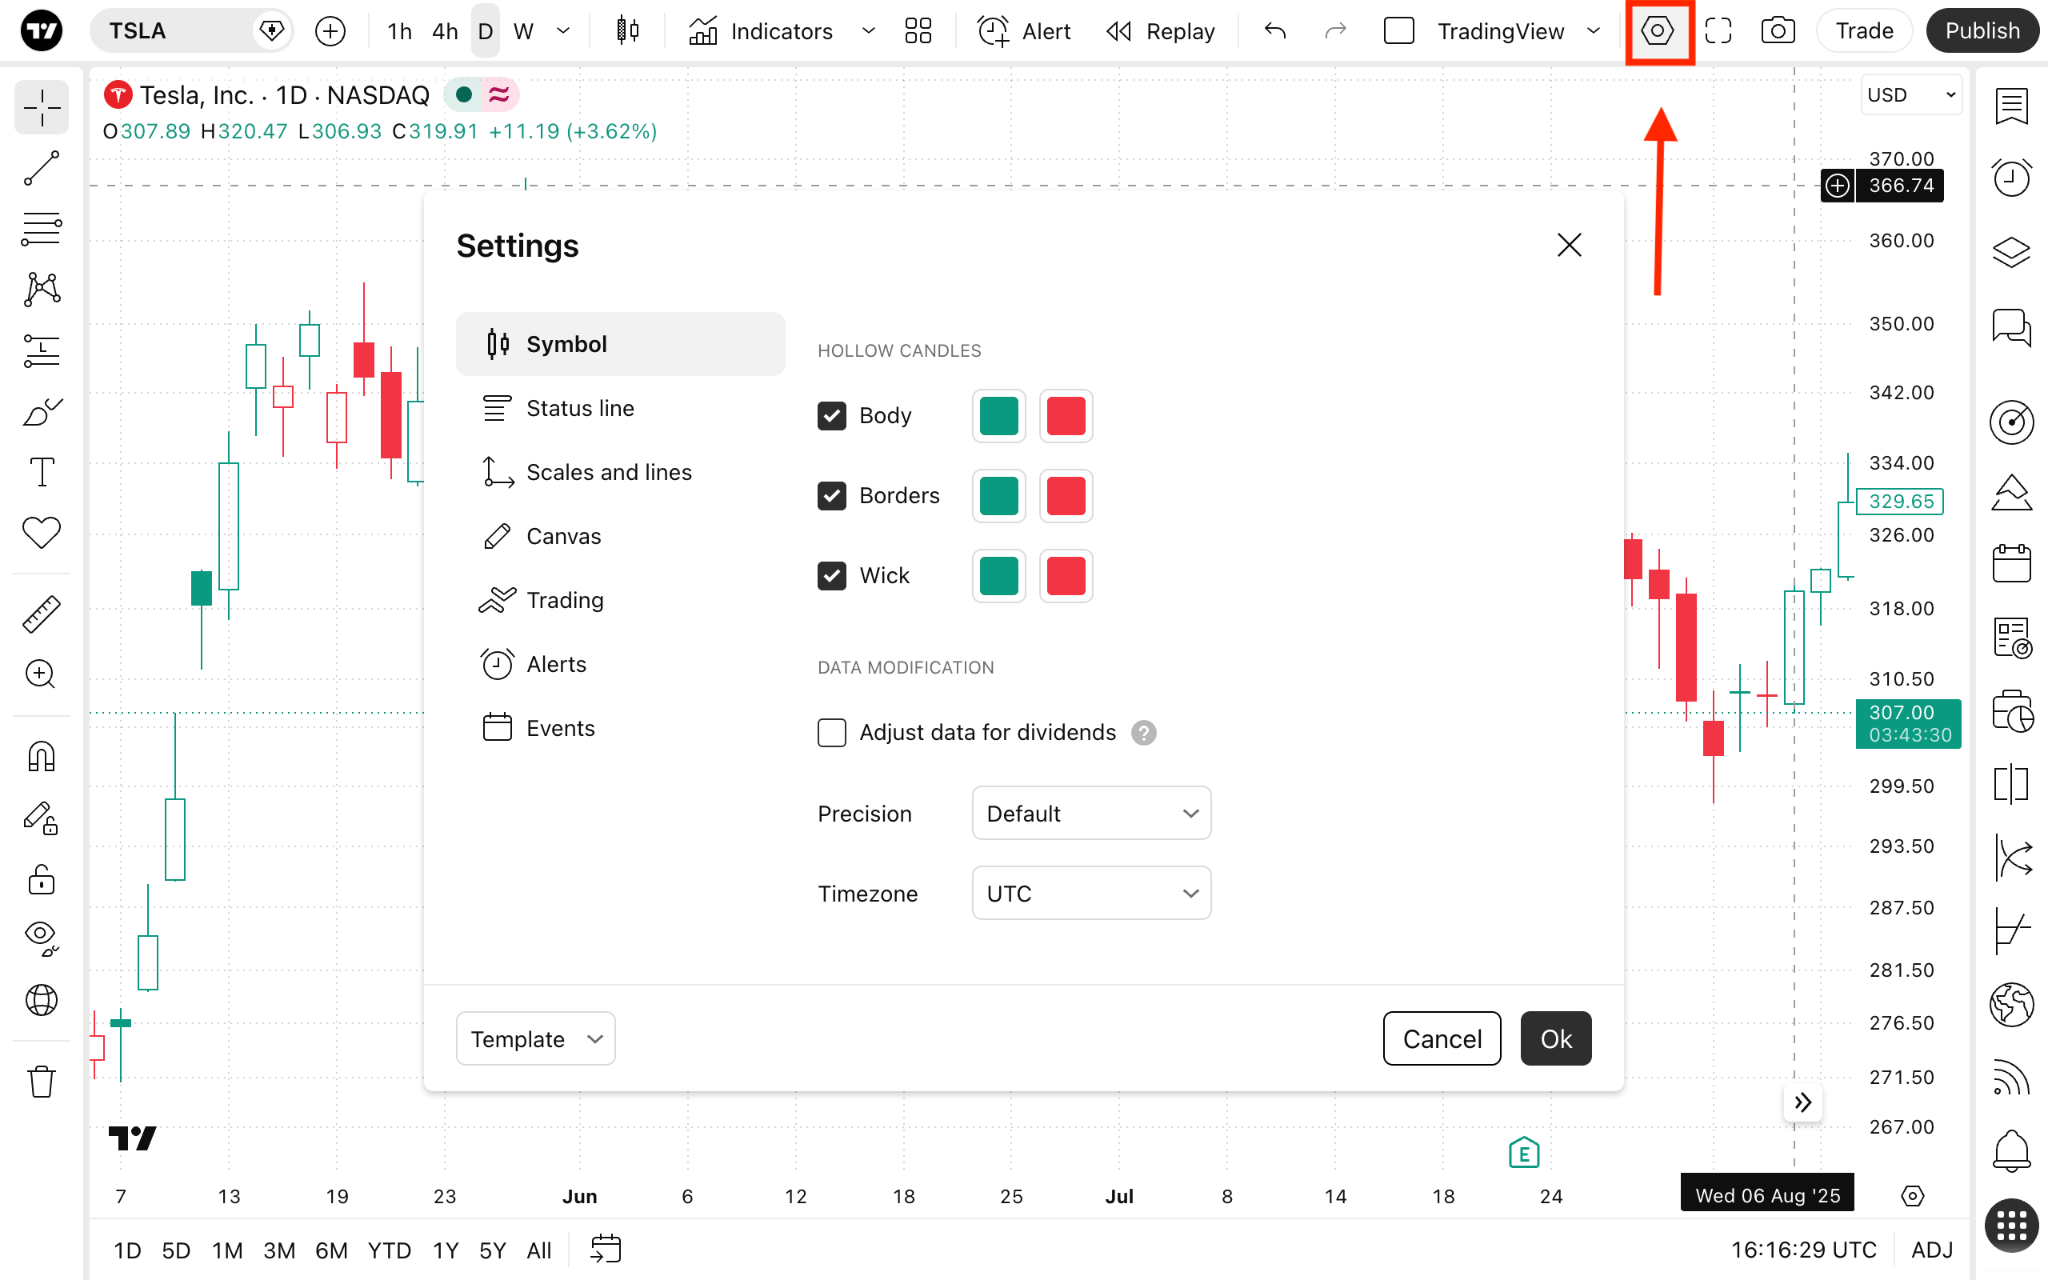
The first section, "Hollow candles," lists settings specific to this chart type:
- Body: Choose the color of the bodies.
- Borders: Choose the colors of the edges.
- Wick: Choose the color of the candles' wicks.
Hollow candles in a nutshell
Hollow candles are a step forward toward the understanding of distribution and accumulation phases. Their visual appearance may help you avoid potential false signals of other technical analysis tools regarding trend changes or continuation.
Also read: