Candlestick Pattern in Screener
A Candlestick Pattern is a visual representation of price movements on a candlestick chart. It is widely used in technical analysis to evaluate potential future price direction.
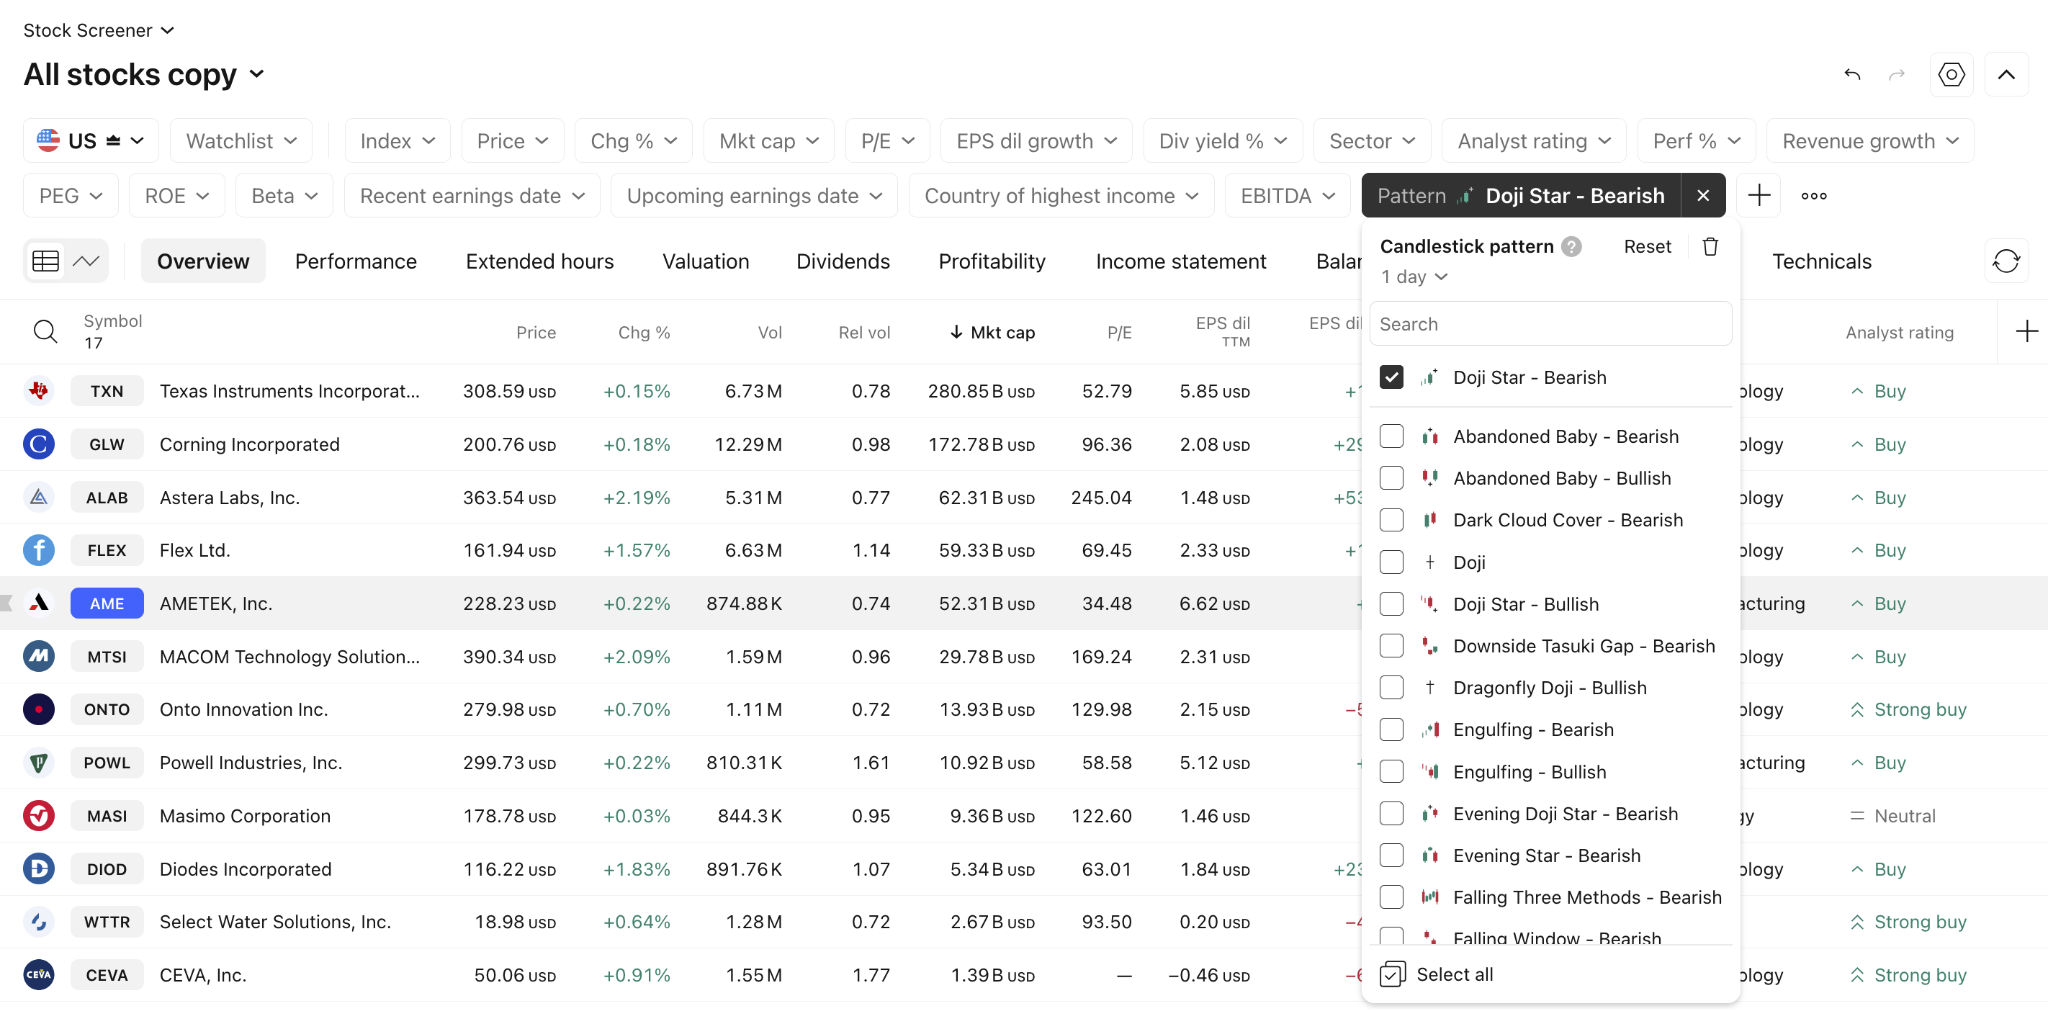
In the Screener, the Candlestick Pattern field displays the most recent pattern on the chart and allows users to filter symbols based on this pattern.
The Screener offers a comprehensive set of candlestick patterns, allowing users to make informed decisions based on market trends and technical analysis.
Patterns can be categorized in three ways:
- By direction: Bullish, Bearish, or Neutral
- By signal strength: Strong, Medium, or Weak
- By signal type: Continuation or Reversal
The direction of a pattern helps identify the expected path of an asset's price based on market sentiment:
- Bullish Patterns suggest a potential price increase.
- Bearish Patterns indicate a possible price decline.
- Neutral Patterns indicate an equilibrium between buying and selling pressures (currently, there is one such pattern available).
Signal strength helps assess the reliability and expected momentum of a pattern:
- Strong signals are generally considered more reliable and may indicate a higher likelihood of a meaningful price movement.
- Medium signals are moderately reliable and may indicate a potential price movement, especially when supported by other technical signals.
- Weak signals may indicate a potential price movement but are generally considered less reliable than medium or strong signals.
Please note that when multiple patterns occur simultaneously, the Screener displays them from left to right in order of signal strength.

In the example above, the Doji Star pattern (a medium signal) is displayed first, followed by the Long Lower Shadow pattern (a weak signal).
Signal strength classifications are based on TradingView's internal pattern categorization and are intended to help users compare patterns within the Screener. Candlestick patterns should not be used in isolation and are generally most effective when combined with other forms of technical analysis and risk management.
Signal types indicate whether a pattern supports the existing market trend or predicts a reversal:
- Continuation signals suggest the price will continue moving in its current direction.
- Reversal signals indicate the price may soon change direction.
These are all the patterns currently available:
Descriptions for all patterns are available directly on the chart and can be viewed through tooltips. We highly recommend using the screener’s field with the candlestick pattern indicator on the chart, as this approach provides real-time trend monitoring and detailed descriptions for each pattern. You can learn more about pattern chart monitoring and tooltips here.