Economic Calendar: track all major market events
The Economic Calendar is a tool that helps you track the most important events and data in the financial world. It allows you to prepare for market fluctuations by monitoring economic indicators, central bank announcements, and government policy changes from around the globe.
CONTENTS:
How to use the Economic Calendar
The Calendar is designed for quick scanning and deep analysis. It first lists the time of the announcement or report release, followed by the country of origin. Right next to the country, you will see a small bar graph illustrating the importance of the event, allowing you to instantly assess what requires immediate attention.
Next is the event itself. This can be anything that might influence the markets: economic data, employment reports, central bank announcements, shifts in government policy, or even tweets from key world leaders.
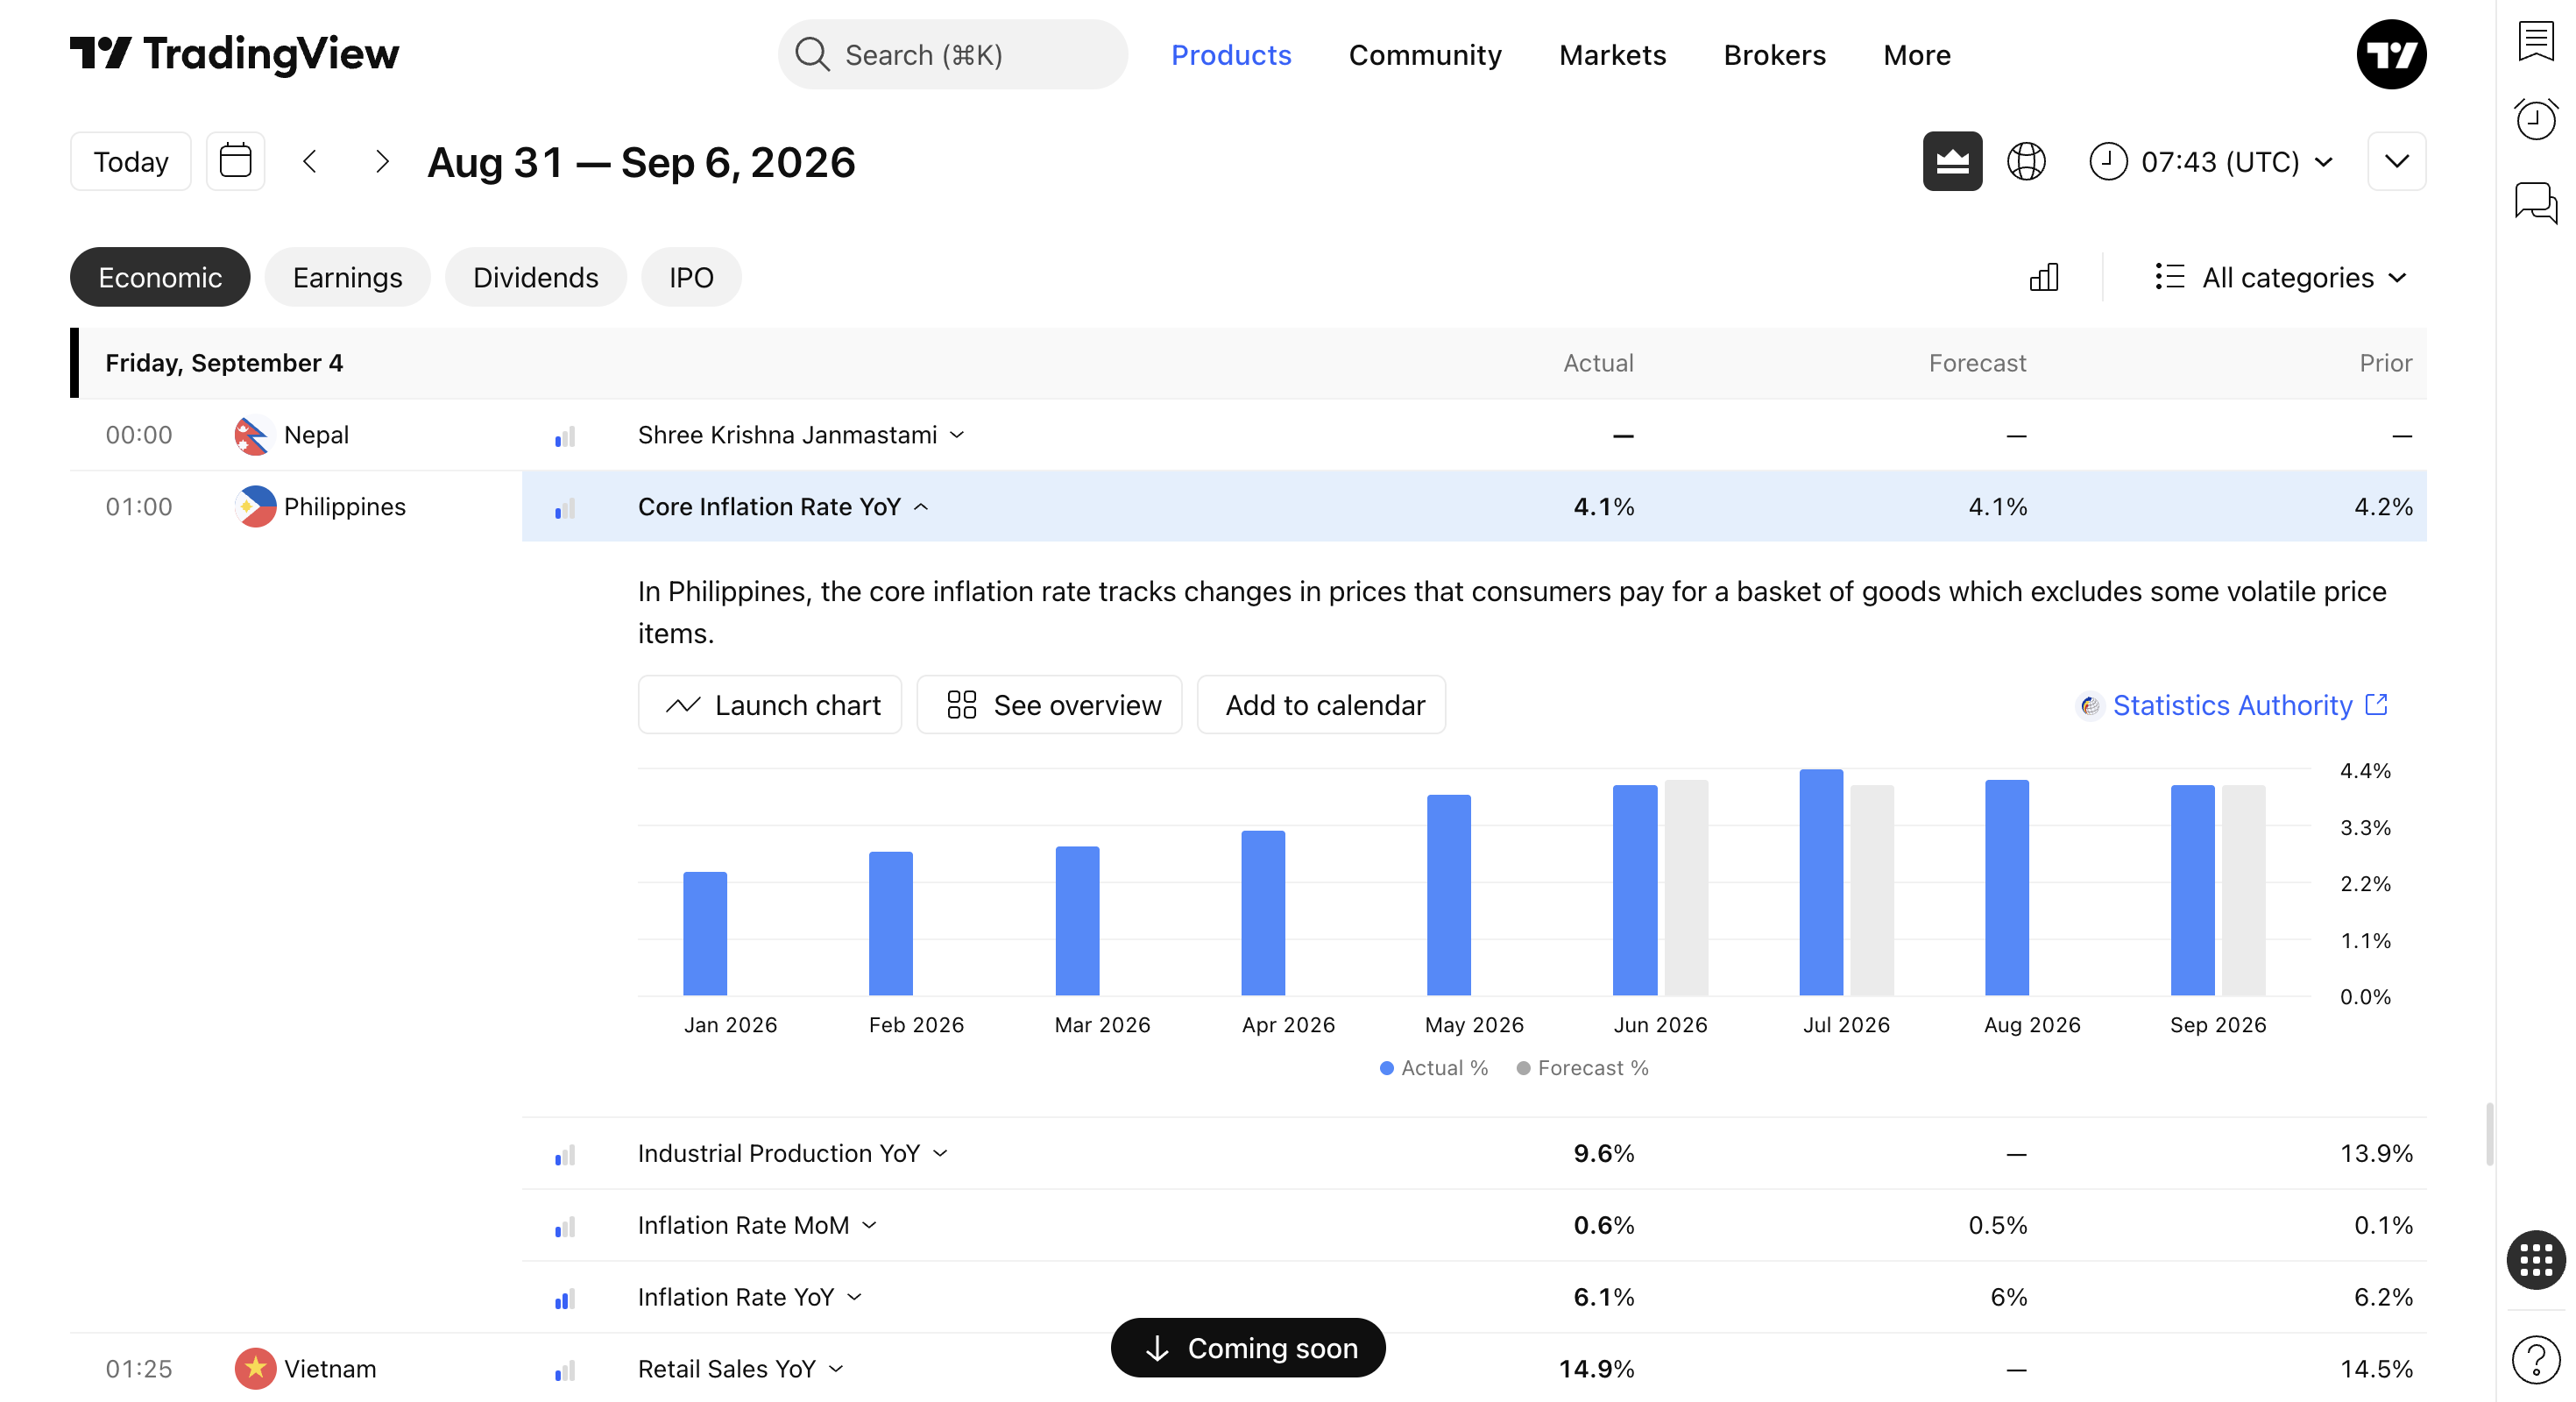
Clicking on an event reveals its detailed description along with three actionable options:
- Launch chart: Opens a detailed, dedicated chart for that specific economic indicator.
- See overview: Sends you to the indicator's symbol page, complete with charts, news, and other related information.
- Add to calendar: Adds the event directly to your personal Google Calendar to ensure you never miss it.
On the upper toolbar, the data is broken down into three critical columns to help you evaluate the reports:
- Actual: Shows the actual reported value of the indicator (as opposed to what was expected), helping you accurately evaluate breaking reports.
- Forecast: Shows the market's expected forecast for the indicator, which many traders use to develop proactive strategies.
- Prior: Displays the previous value of the indicator so you can see the full scale and trend of the economic event.
Economic Calendar filters
Now that you are familiar with what the Economic Calendar contains, you can use filters to focus strictly on the information that matters for your analysis:
- Countries: Choose one or several specific countries to receive reports from. If your strategy requires broad macroeconomic data, you can set this filter to the "Entire world."
- High importance: When toggled on, this mode hides the noise and shows only the events with the highest market-moving potential.
- Period options: With just one click, you can filter the timeline to see only upcoming events, past reports from yesterday, or scheduled announcements for today, tomorrow, or this week.
- Categories menu: Select a specific category to see only announcements related to interest rates, inflation, bonds, etc. If you aren't looking for anything specific, leave it on the default "All categories."
- Time zone: To make your scheduling even more precise, use this filter to lock the calendar to your local time zone.
With the right filters and careful research, the Economic Calendar transforms into an indispensable tool for global market analysis.
Economic Calendar and Supercharts
Every TradingView tool is interconnected, allowing you to use them simultaneously. When you are conducting technical analysis on Supercharts, you can easily access the Calendar directly from the right-hand toolbar.
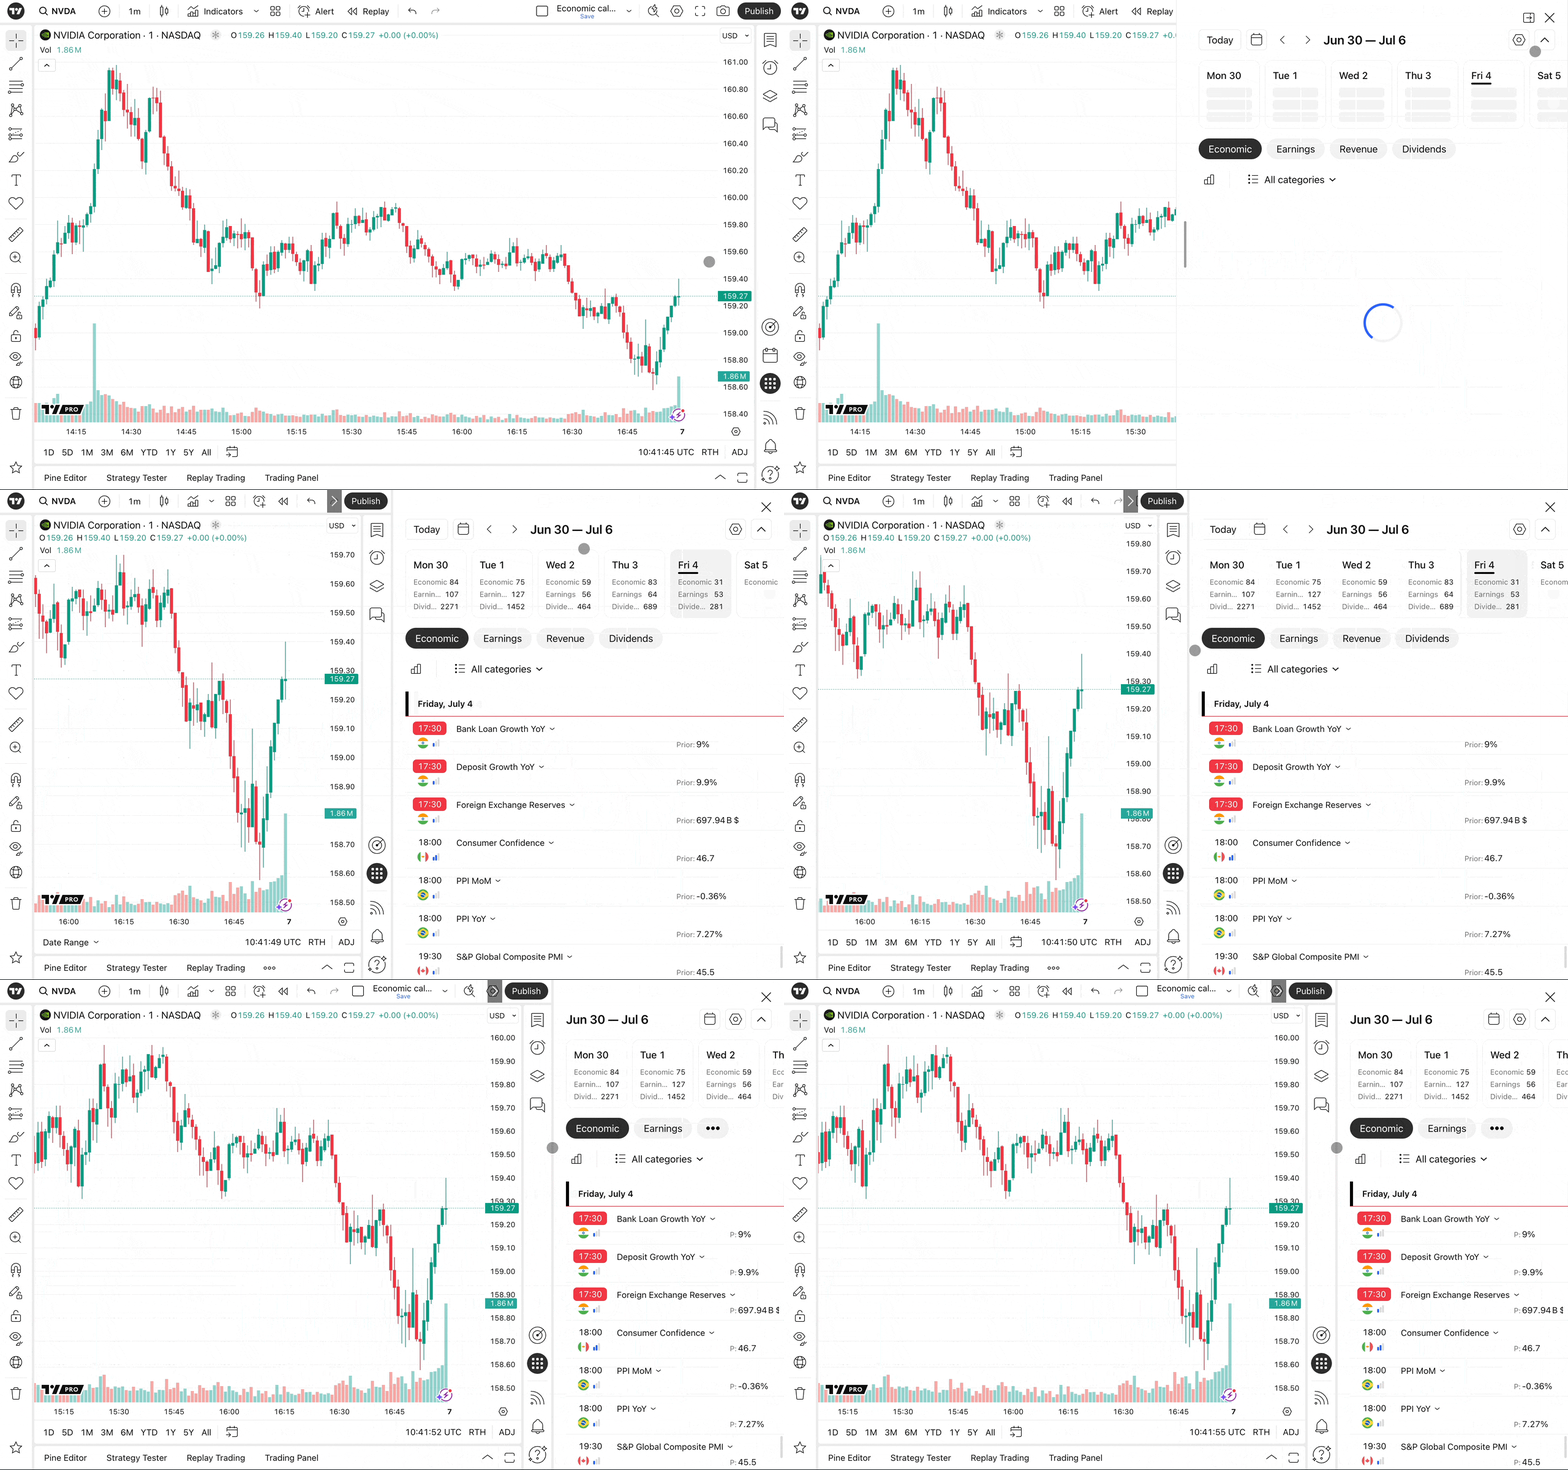
You can split view your screen and adjust the sizes of each separate window. All the functionality remains exactly the same, meaning you never have to interrupt your charting research to check the news.
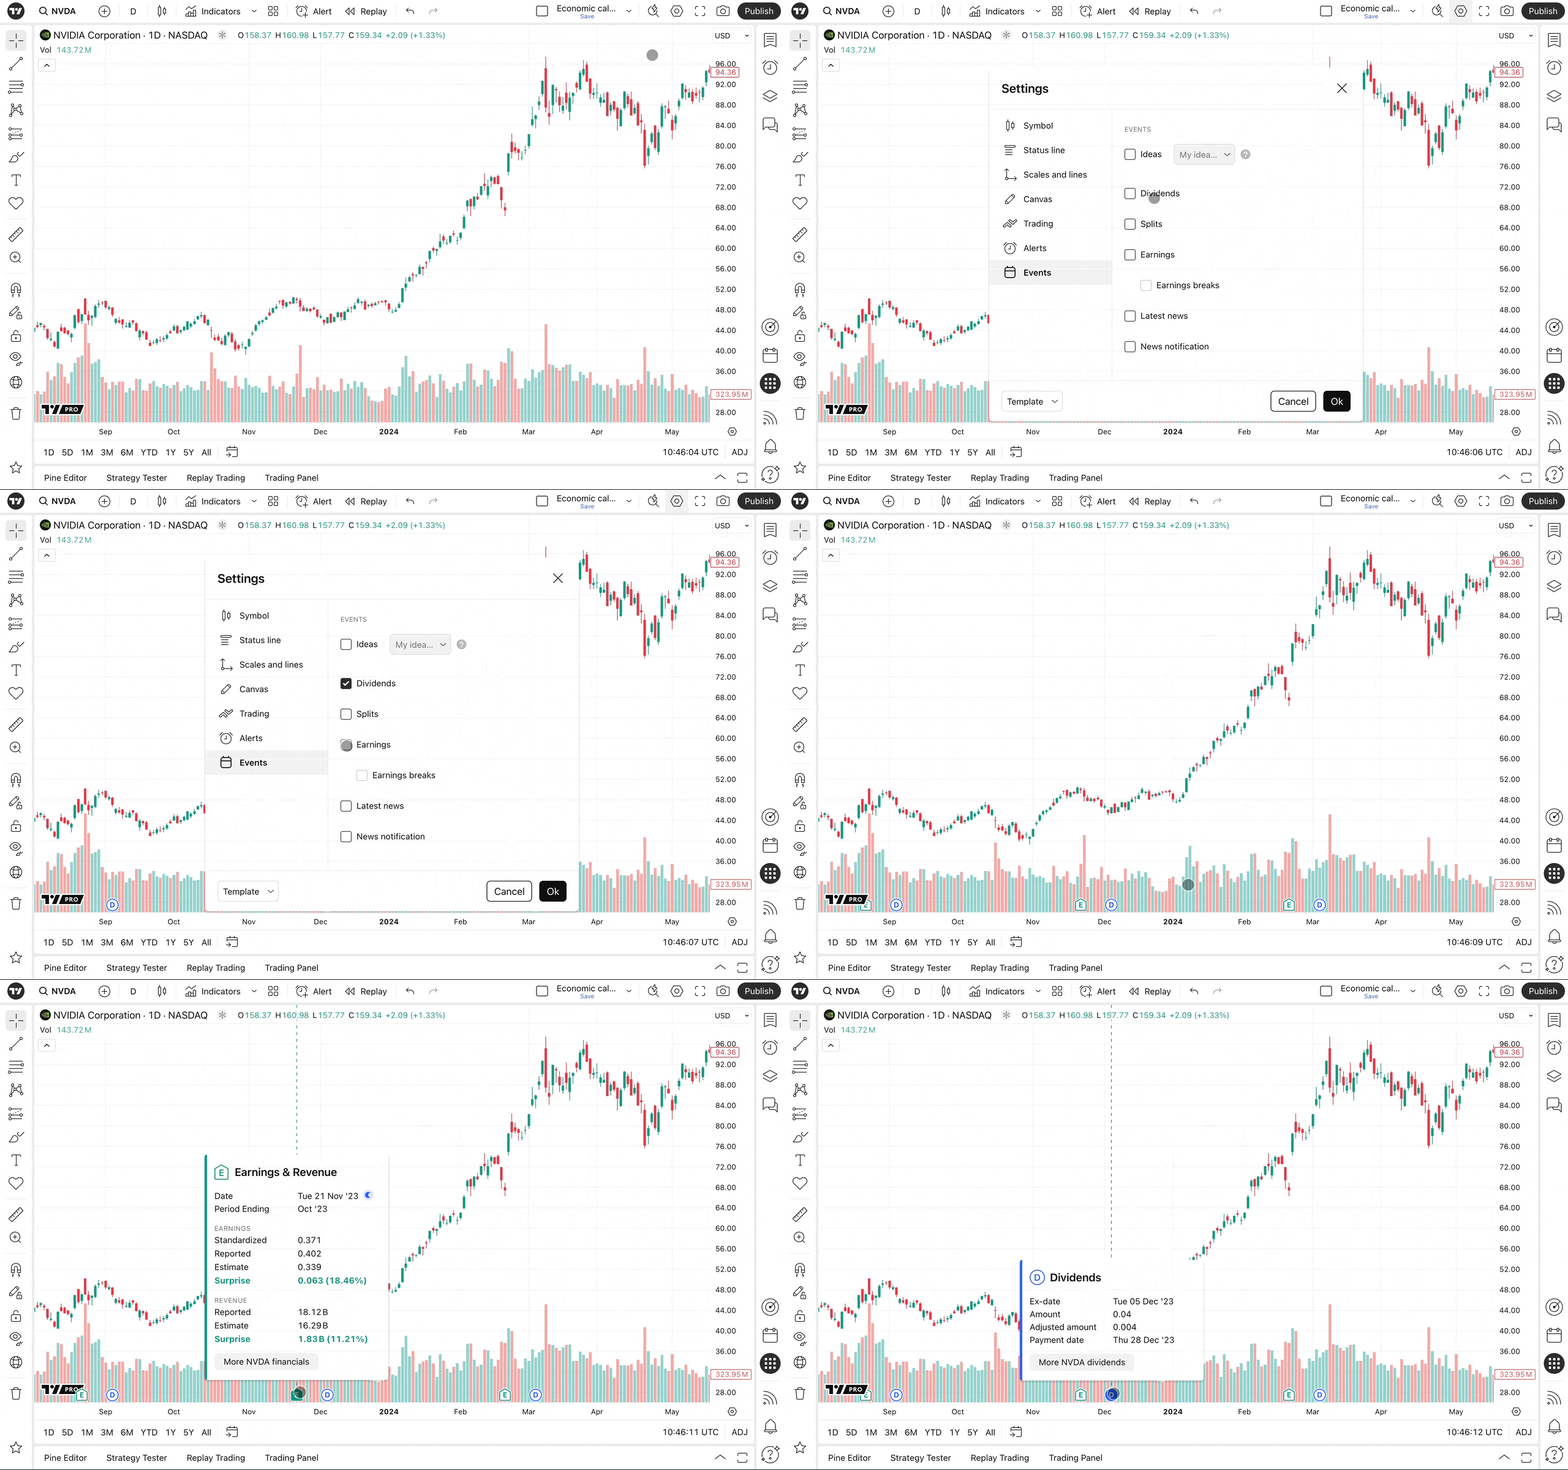
Furthermore, you can overlay calendar events directly onto your price action. Click the Gear (Settings) button on your Superchart and navigate to the Events tab. Depending on the type of asset you are charting (such as broad indices, futures, and forex), you can enable economic events from the calendar to appear directly on your chart's timeline.
Also read: