What are Earnings and Revenue Calendar
Earnings and revenue always come together, as they are presented in a single corporate report. With the unified Earnings and Revenue Calendar, you can easily access key data related to a company's performance all in one place.
This calendar is designed to help you compare companies based on their earnings per share (EPS) and total revenue. If you are performing top-down fundamental analysis, the Earnings and Revenue Calendar provides a comprehensive overview of the current market, helping you identify potentially lucrative investment opportunities.
CONTENTS:
What are EPS and Revenue?
- EPS (Earnings Per Share): An indicator of a company's profitability. It measures how much net income the company makes for each share of its common stock that has been issued.
- Revenue: The total amount of cash a business generates through all its normal operations. In financial reports, it is often listed as "sales" — the gross income generated from goods and services before deducting any expenses.
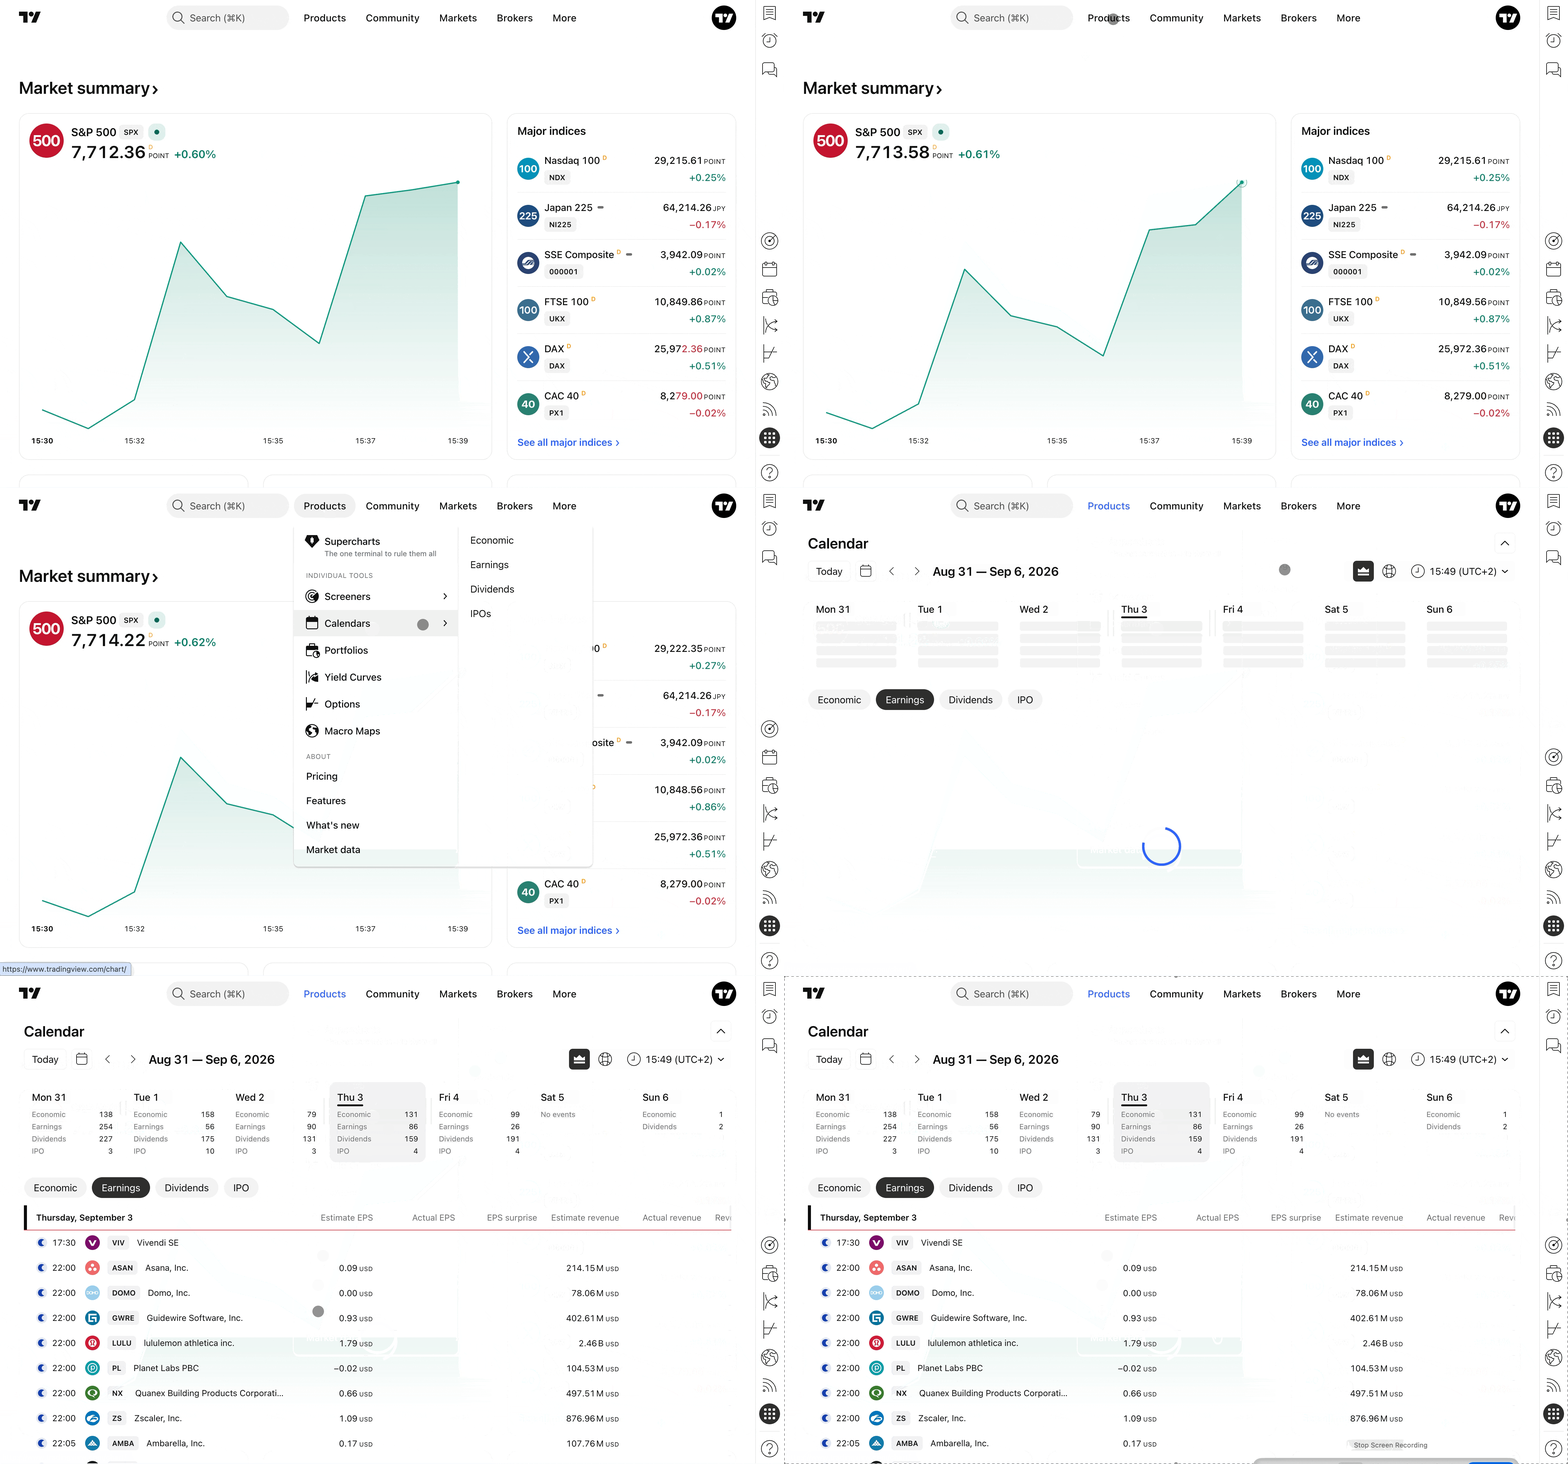
How to use the Calendar
Since companies report earnings and revenue simultaneously, you will see both metrics for the same list of companies in one unified table, making it easy to compare performance relative to their peers.
The calendar displays the following data columns:
- Estimated EPS / Revenue
- Actual EPS / Revenue
- Surprise (the percentage difference between the estimate and the actual reported number)
- Market Cap
Using the Calendar on Supercharts
If you want to access this financial data without leaving your charts, click Calendars on the right-hand toolbar and select the Earnings and Revenue option.
Moreover, you can choose to display upcoming corporate reports directly on your price chart. To do this, navigate to your chart settings by clicking the Gear icon, open the Events tab, and check the Earnings box. You will then see "Earnings & Revenue" markers along the bottom time scale of your chart, visually aligning the company's performance history with its price action.
The Earnings and Revenue Calendar in a nutshell
If you are just starting your fundamental analysis, this calendar provides an excellent starting point to compare different companies by their core performance metrics. Once you identify a promising stock, you can continue your deep dive on its dedicated market page. Whether you use the main calendar dashboard or access the data directly from Supercharts via the right toolbar and chart settings, you have everything you need to stay ahead during reporting season.
Also read: