TradingView Portfolios: track your assets, know your trades
Tired of hand-writing your trades? To free up your time, we've designed Portfolios — your analytical hub to evaluate your trading and investment strategies. It allows you to know exactly how profitable your positions are, which assets generate the highest returns, and where capital is worth reallocating.
CONTENTS:
What are Portfolios?
A portfolio is simply a collection of all your financial investments — stocks, indices, funds, forex, or crypto. Think of it as a single basket holding all the assets you've invested in. Managing a portfolio means balancing your risk tolerance, investment goals, and time horizon. While this can be challenging, TradingView is here to help.
This tool lets you track all your investments in one clean interface. It provides a performance overview, holdings breakdown, transaction history, and analytical insights, giving you a clear picture of your portfolio's dynamics.
Portfolios help you see how your assets are performing at a glance by measuring your returns against a benchmark of your choice.
How to create a portfolio
When you log in to your TradingView account, you can start creating your portfolio. To do this, navigate to Portfolios under the Products menu.
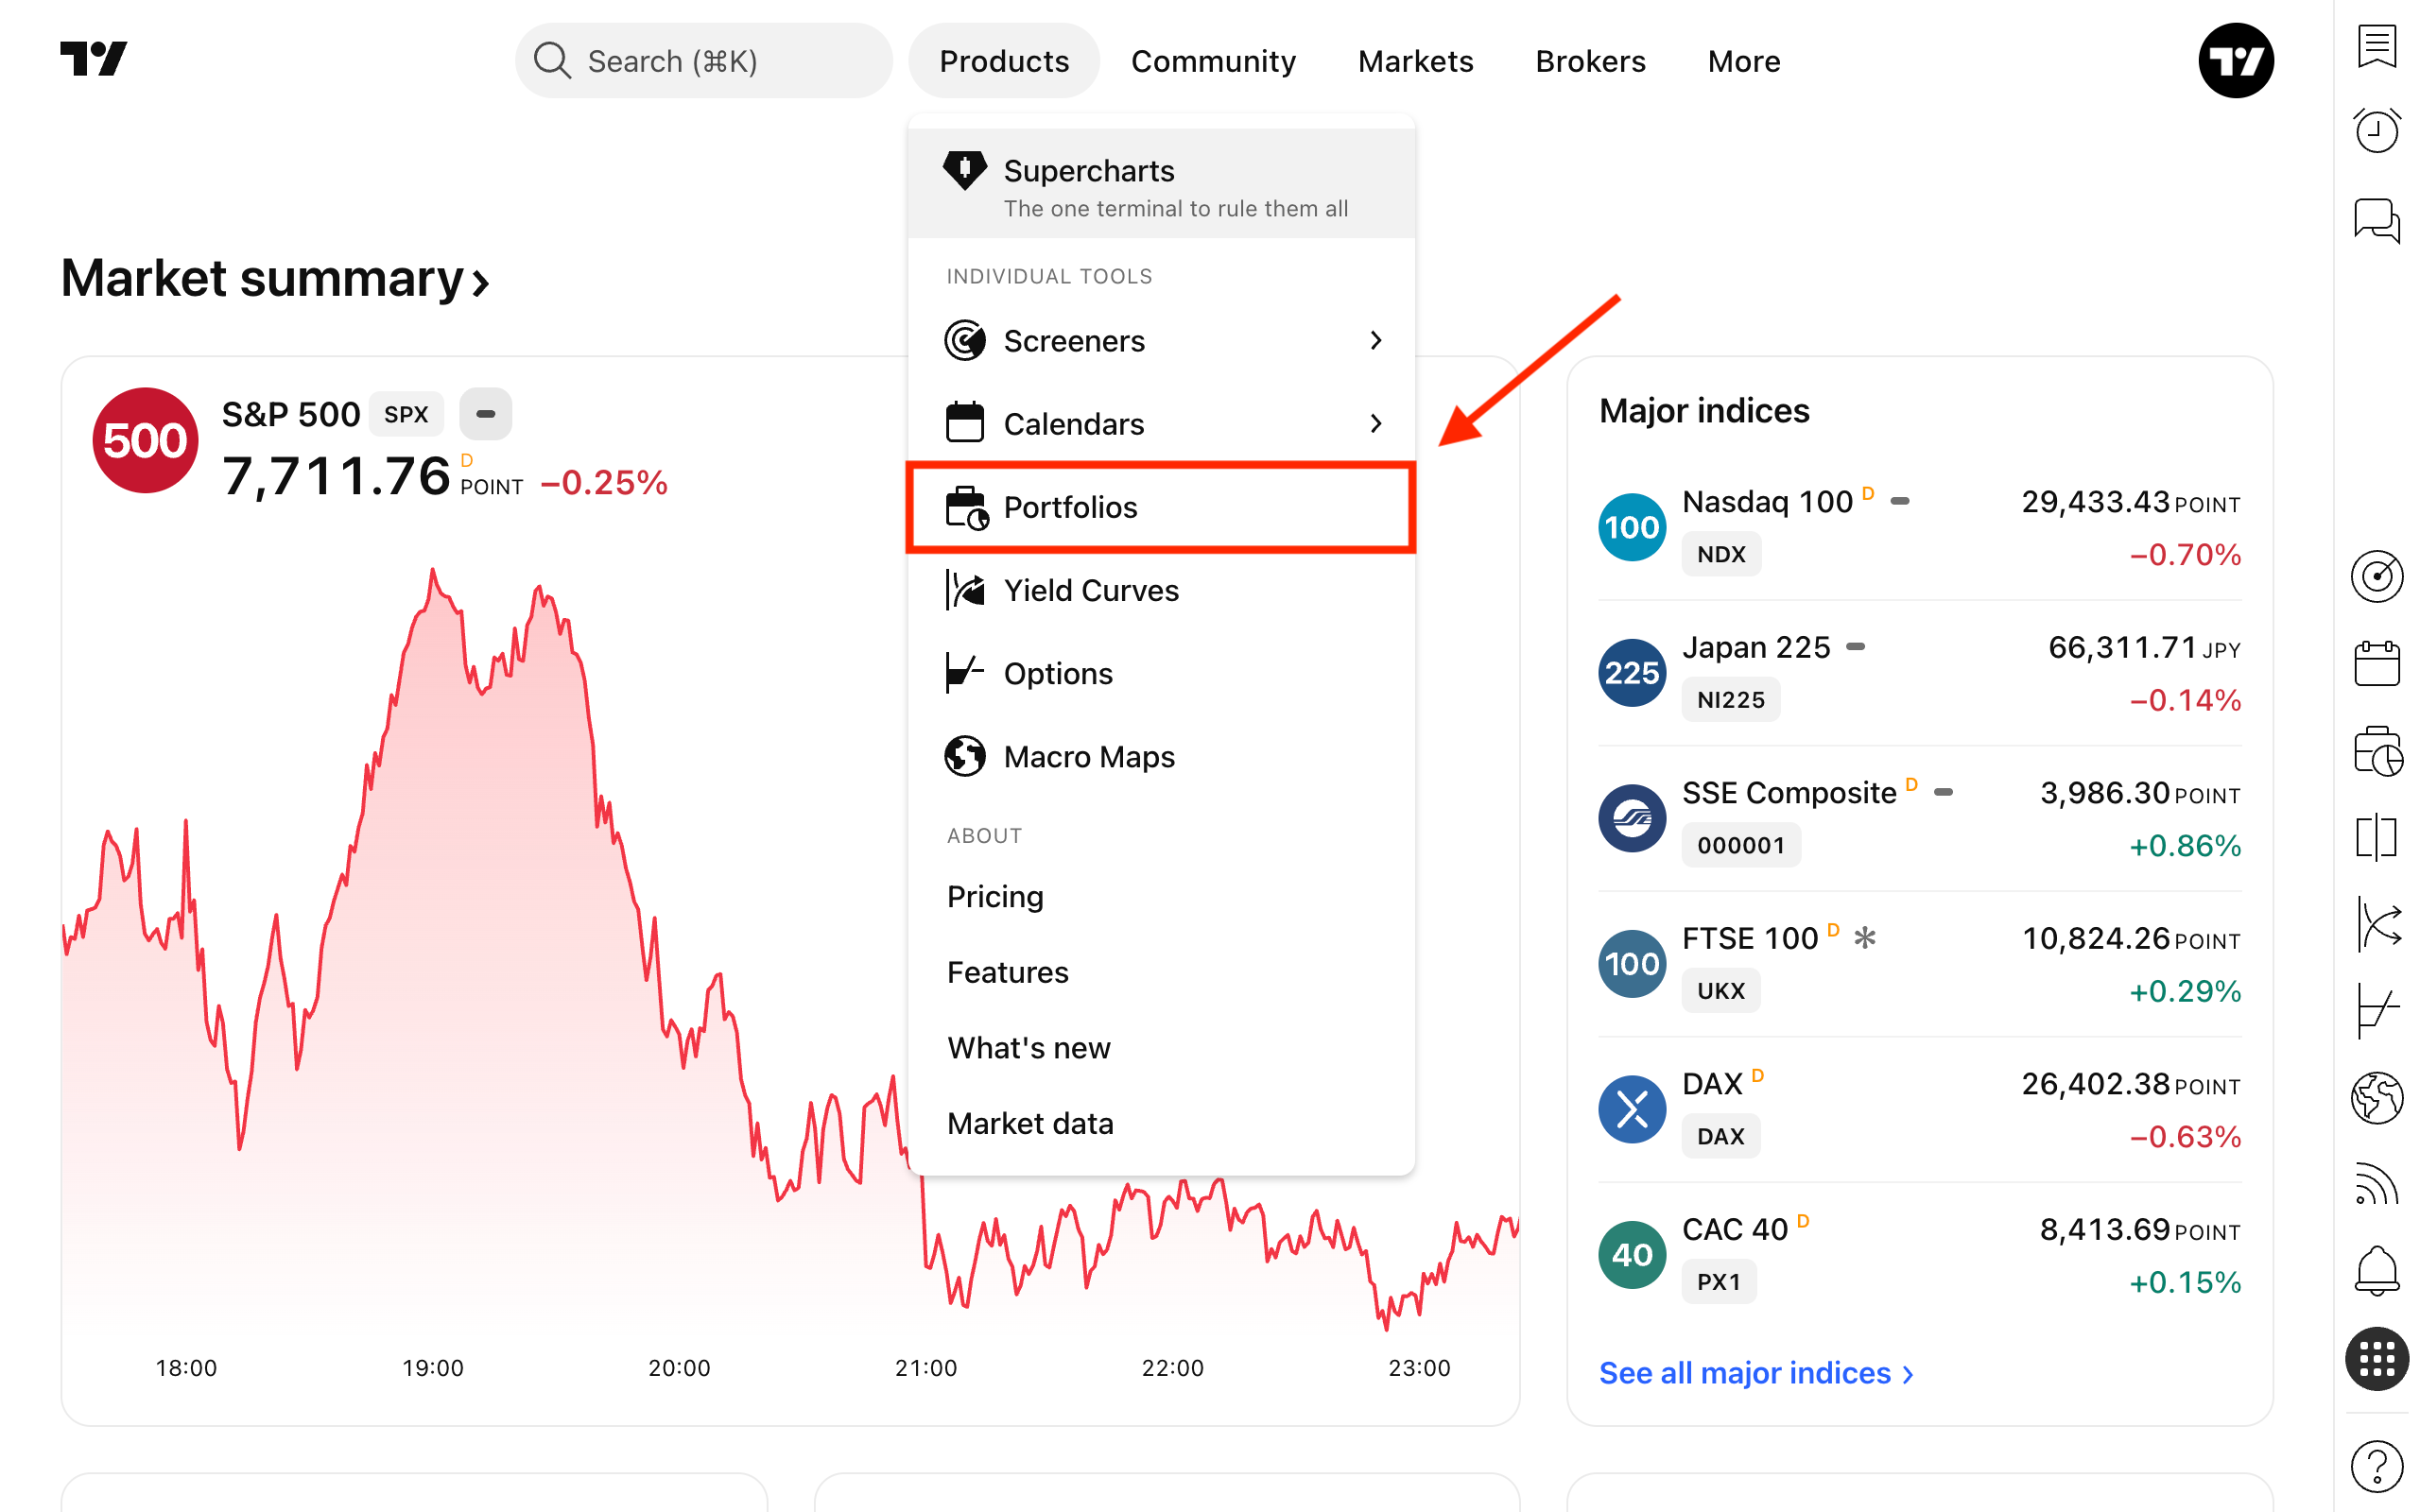
Next, choose one of three supported methods to build your portfolio:
- Import transactions: Upload an exported CSV or XLSX file.
- Create it manually: Add your desired symbols one by one.
- Add data from a watchlist: Import a watchlist already saved in your TradingView account.
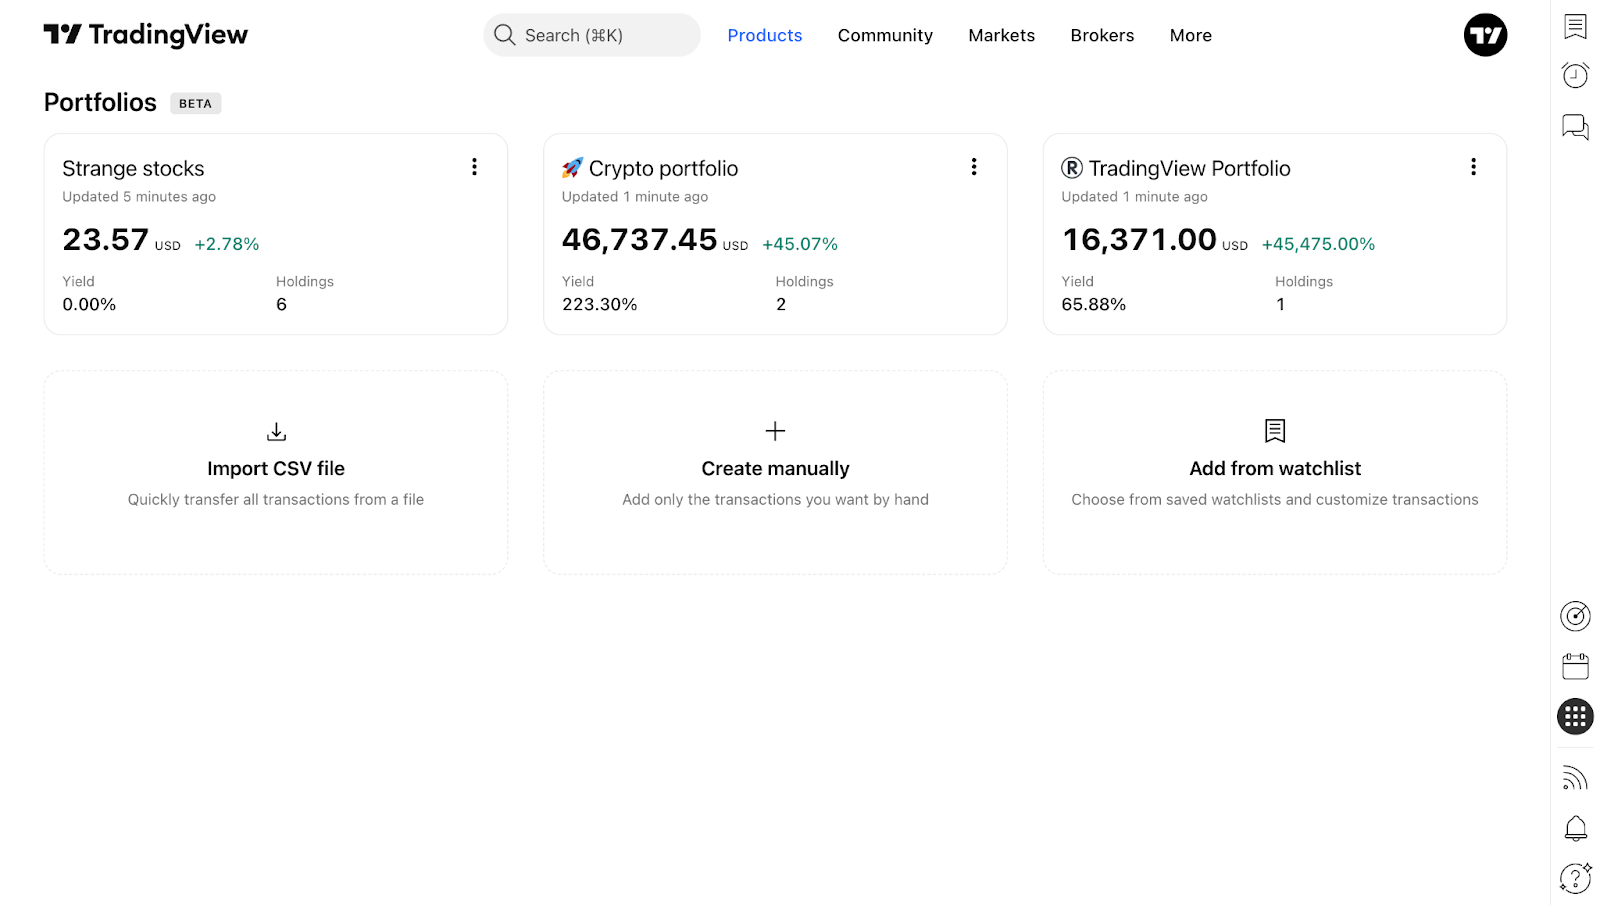
Currently, you can create up to three portfolios. Each portfolio displays your current cash equivalent, overall profitability, annualized yield, and total number of included assets (holdings).
What to look for in your portfolio
On the main portfolio page, you will find essential metrics covering your investments:
- Portfolio value: The total worth of your assets in your chosen base currency (fiat currencies or cryptocurrencies).
- Unrealized gain: The profit or loss you would realize if you closed all current open positions today.
- Total gain: The combined realized and unrealized return of your portfolio, accounting for all income and expenses.
- Annualized yield: The time-weighted average annual return, taking all cash flows into account.
Overview
Here, you get a bird's-eye view of your investment approach:
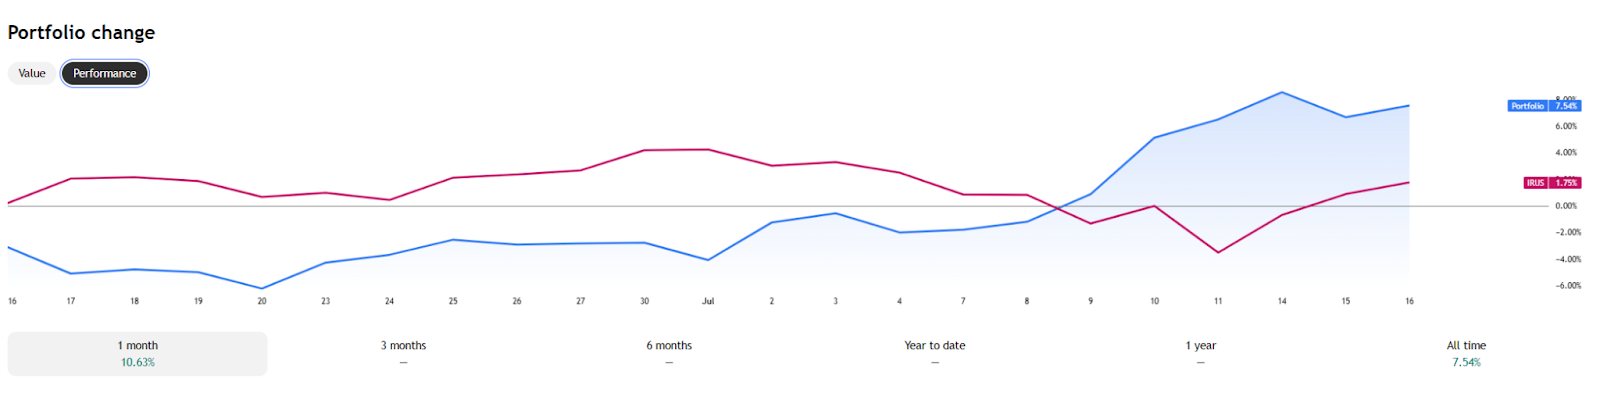
Portfolio change: Displays daily portfolio value and relative returns. Toggle between a simple Value line (showing portfolio worth over time) or a Performance view (comparing your returns against a selected benchmark).
Distribution: Provides a visual analysis of asset allocation by selected category:
- Assets: Individual holdings in your portfolio.
- Asset types: Stocks, crypto, forex, funds, or indices.
- Sectors: Economic sectors (e.g., electronic technology, consumer services).
- Currency: Fiat or cryptocurrencies in which your assets trade.
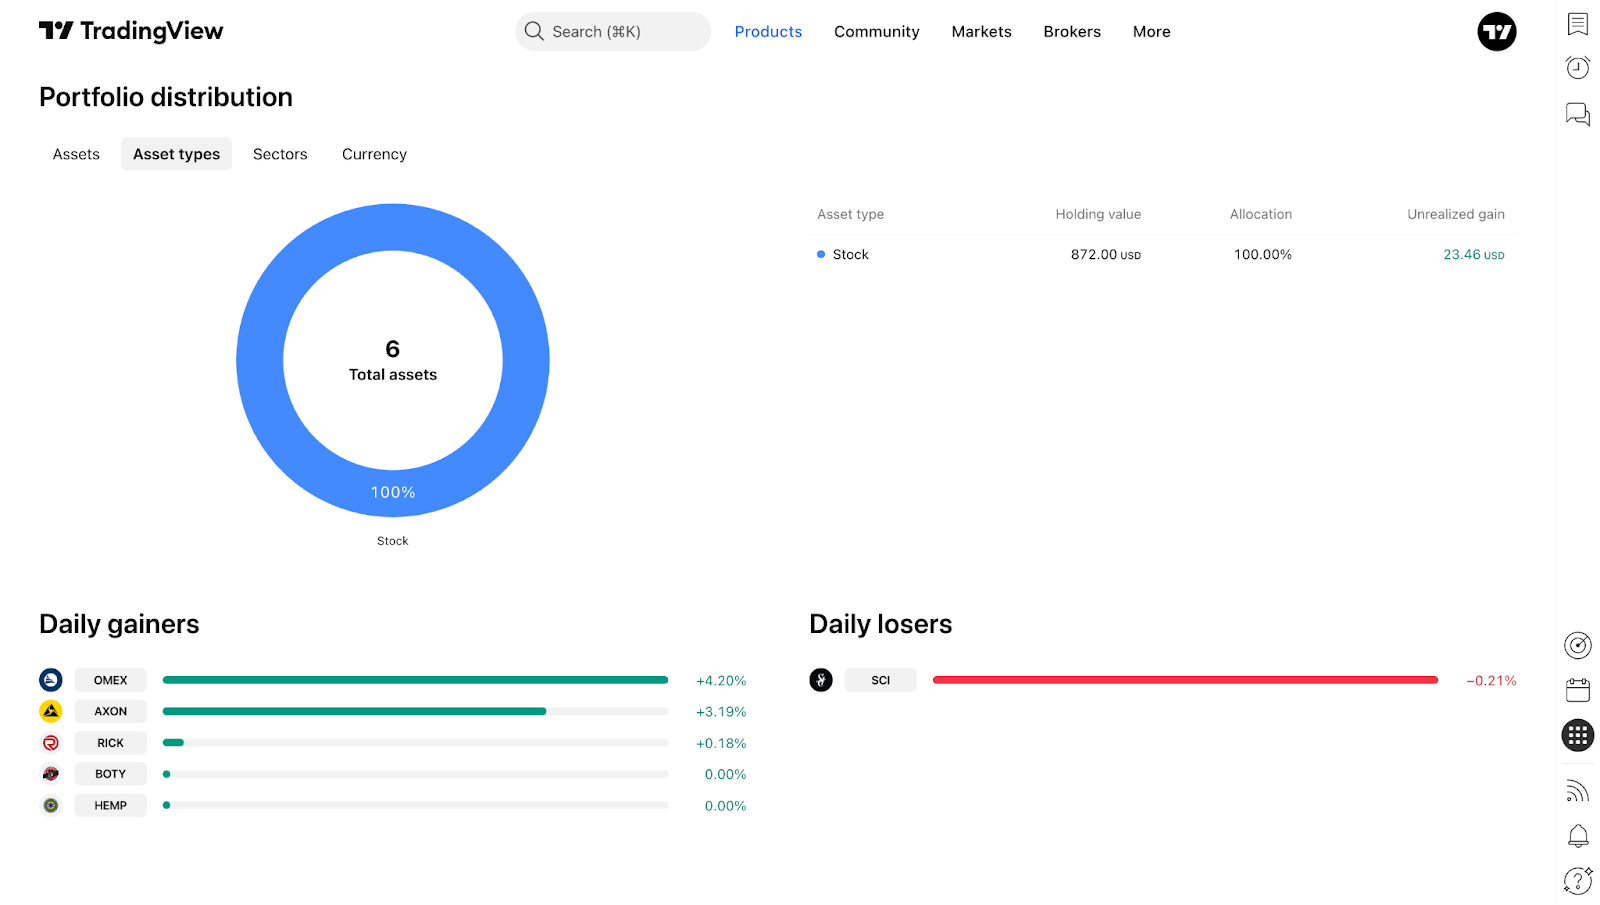
Daily gainers and losers: Highlights your best- and worst-performing assets for the day.
Upcoming earnings and dividends: If you hold stocks, upcoming earnings releases and dividend payouts are displayed in dedicated sub-tabs.
News: Displays the latest relevant market news for the assets in your portfolio.
Holdings
This tab lists all active symbols included in your portfolio. You can switch between views to inspect fundamental metrics, technical data, price information, risk parameters, and performance stats.
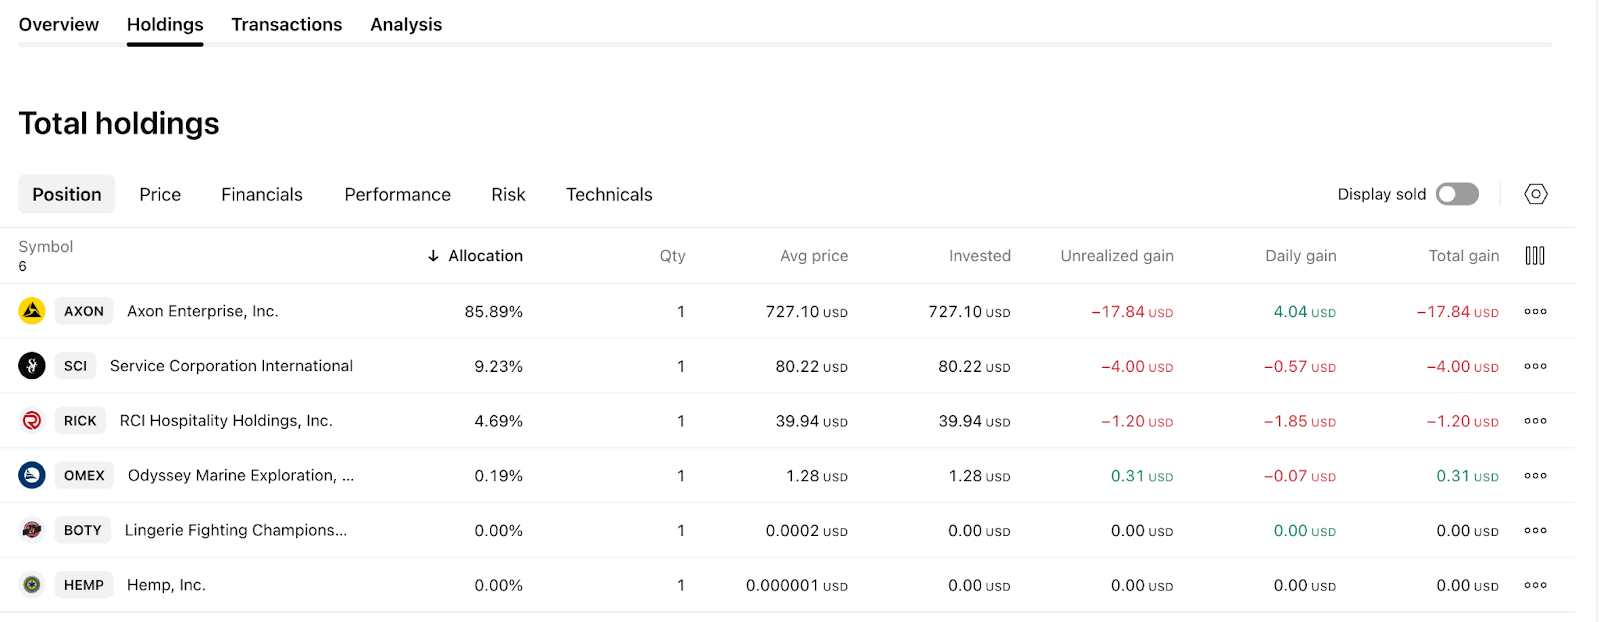
- Grouping and summaries: Group holdings by currency, symbol type, sector, or exchange, and add a summary row.
- Sold holdings: Enable the option to display sold positions for a complete historical record.
Overall, the Holdings tab offers a granular, screener-like view of your active and historical positions.
Transactions
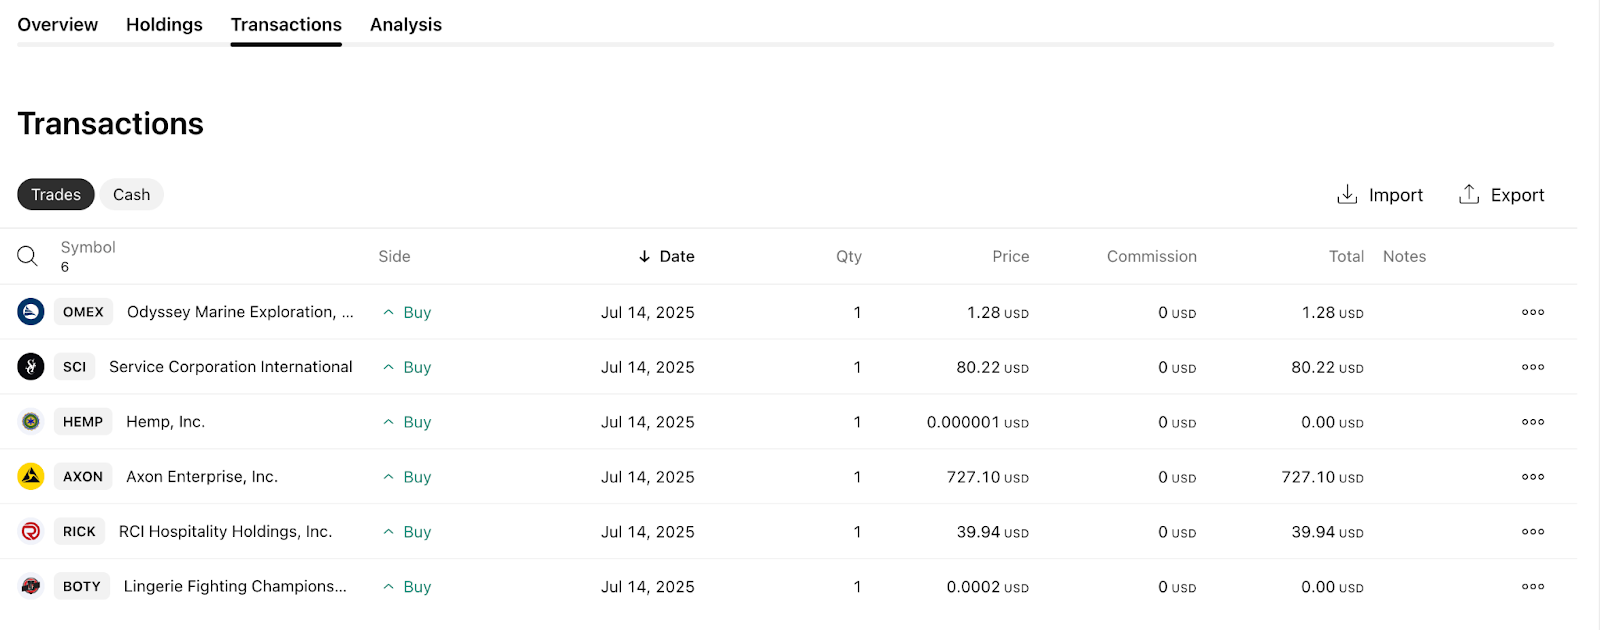
Follow your complete transaction history here. View order logs with asset purchases and sales, paid commissions, and cash deposits or withdrawals.
Analysis
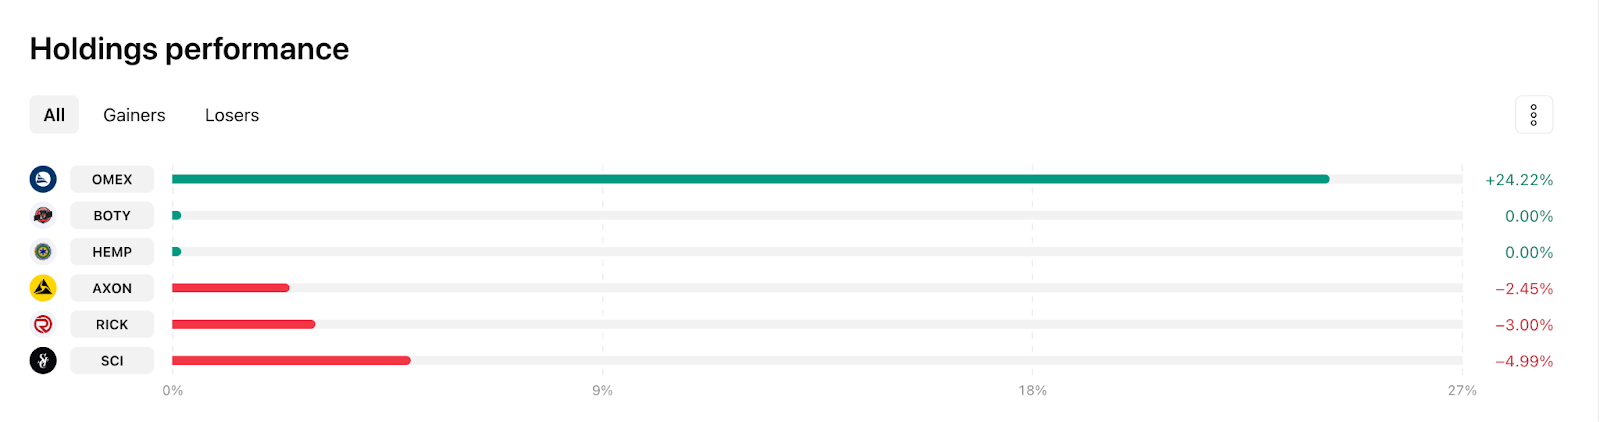
Evaluate how your portfolio has performed across various timeframes and assess your risk exposure using institutional metrics like Beta, the Sharpe ratio, or the Sortino ratio. At the bottom of this tab, you can evaluate individual holding performance relative to the rest of your portfolio.

In the bottom part, you can find your holdings performance to assess each asset relative to others.
The bottom line
Building wealth requires diligent asset tracking. TradingView Portfolios elevates your analysis with sophisticated tools to measure profitability, identify sector concentration, deliver relevant news, and ensure your real-world assets align with your trading and investment strategy.
Also read: