Disjoint channel drawing tool
Application
The Disjoint channel drawing tool allows users to draw two parallel trendlines that do not necessarily share the same starting points on the time axis. This provides greater flexibility than a standard Parallel Channel, making it easier to define trend boundaries, support, and resistance levels when the price action is slightly asymmetrical.
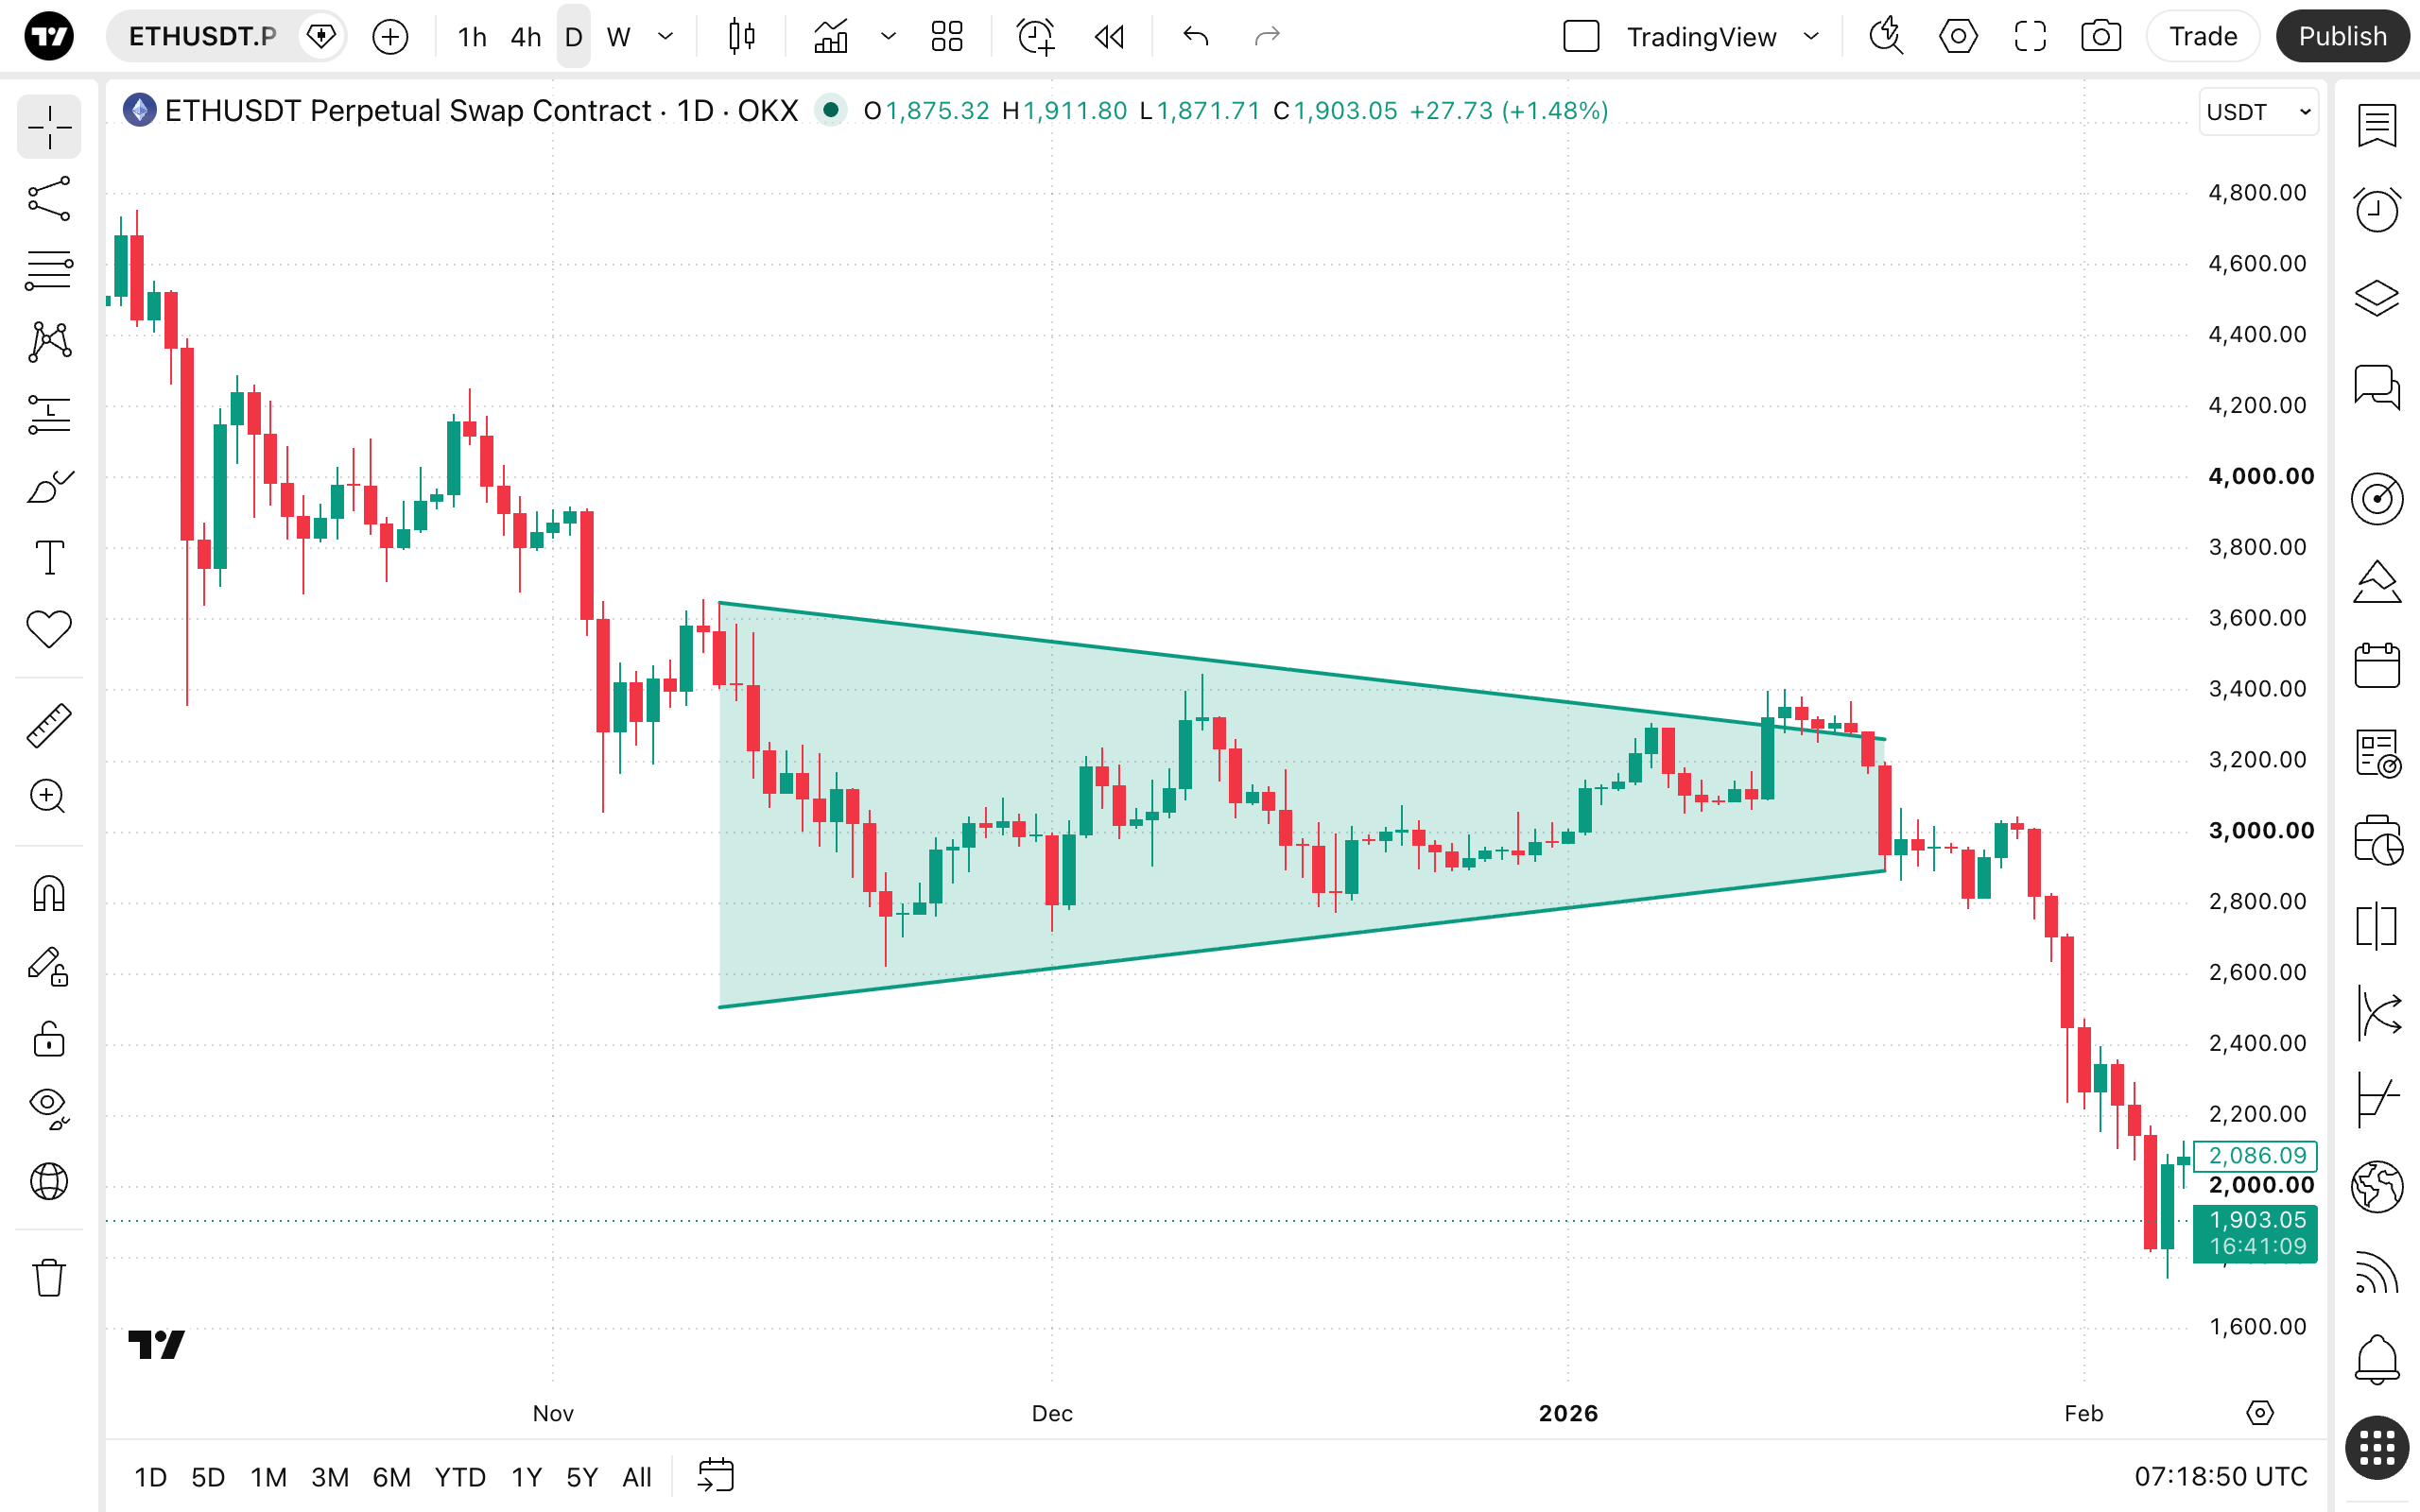
To draw a Disjoint channel, select the tool from the drawing panel. Click on the chart to set the starting point of the first trendline, drag your cursor to set the second point, and then click a third time to place the parallel boundary at the desired distance.
Style
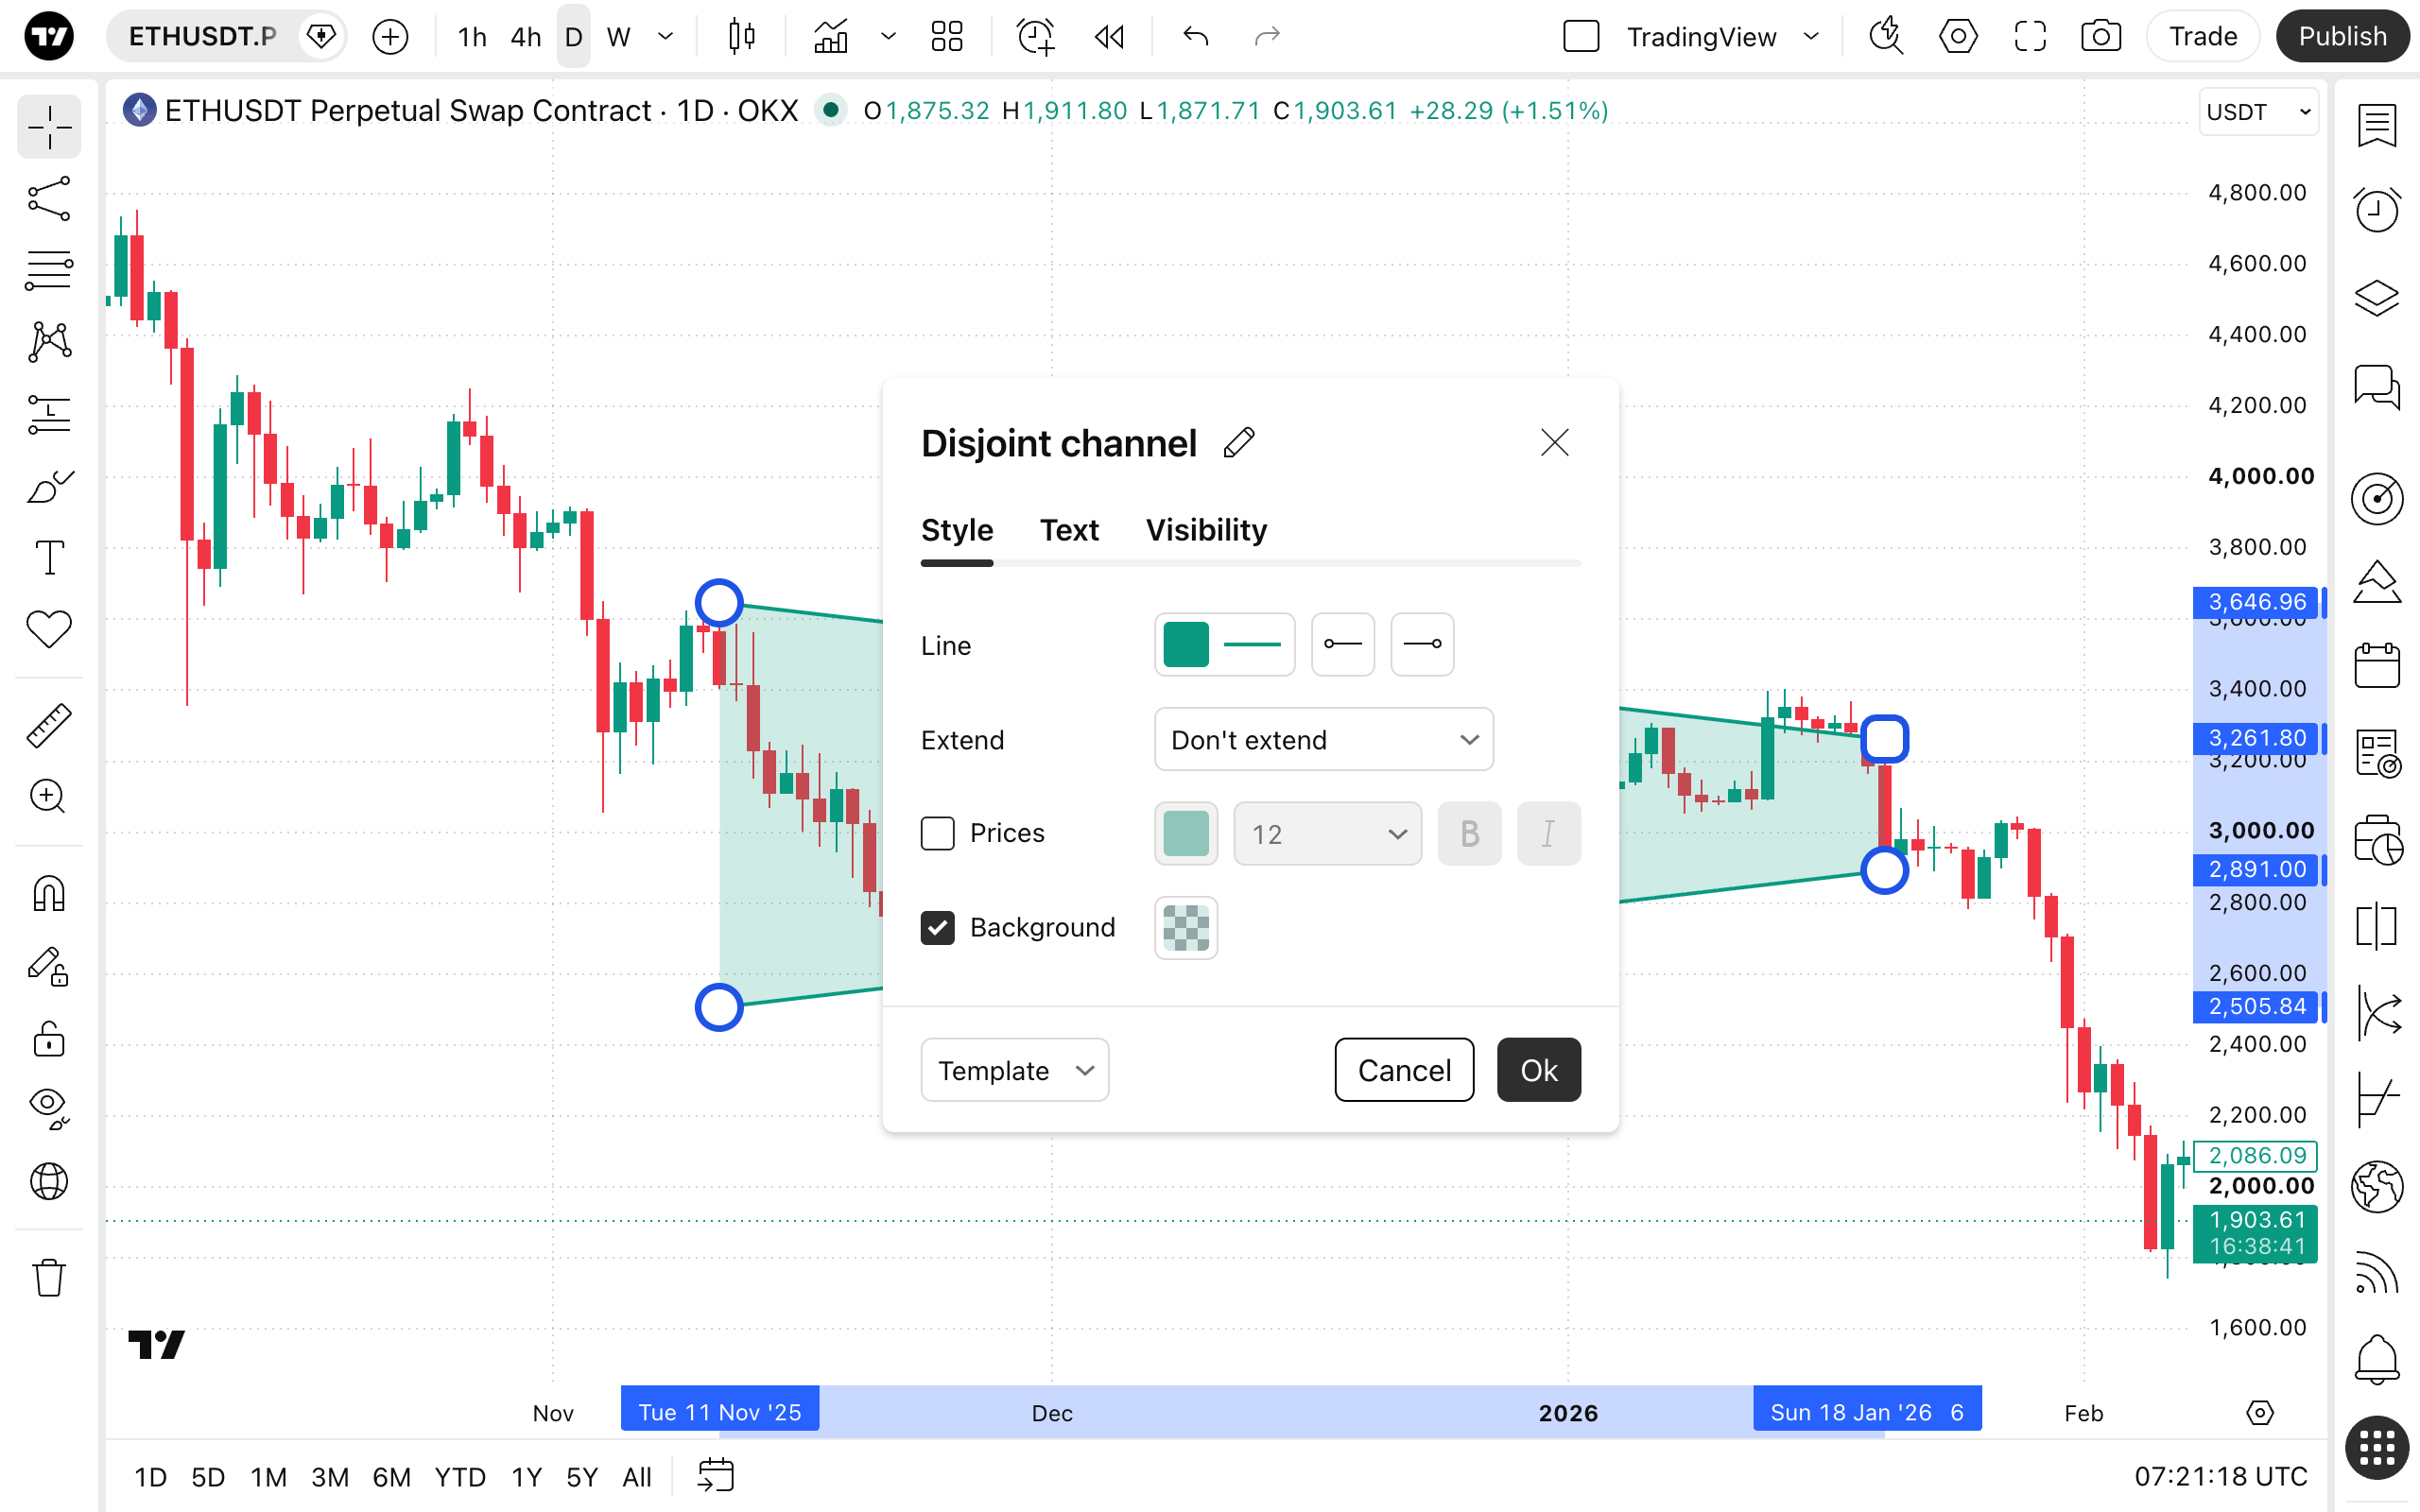
In the Style properties dialog, it is possible to change the visual appearance of the Disjoint channel tool:
- Line: Allows you to change the color, opacity, thickness, and style (solid, dashed, dotted) of the channel's borders. You can also toggle markers (such as points) at the start and end of the lines.
- Extend: Offers a dropdown menu to extend the channel lines indefinitely to the left, right, or both sides, or to not extend them at all.
- Prices: Toggles the visibility of price value labels for the tool's boundaries. You can also adjust the label's background color, font size, and apply bold and/or italic formatting.
- Background: Toggles the visibility, color, and opacity of the channel's interior background fill.
Text
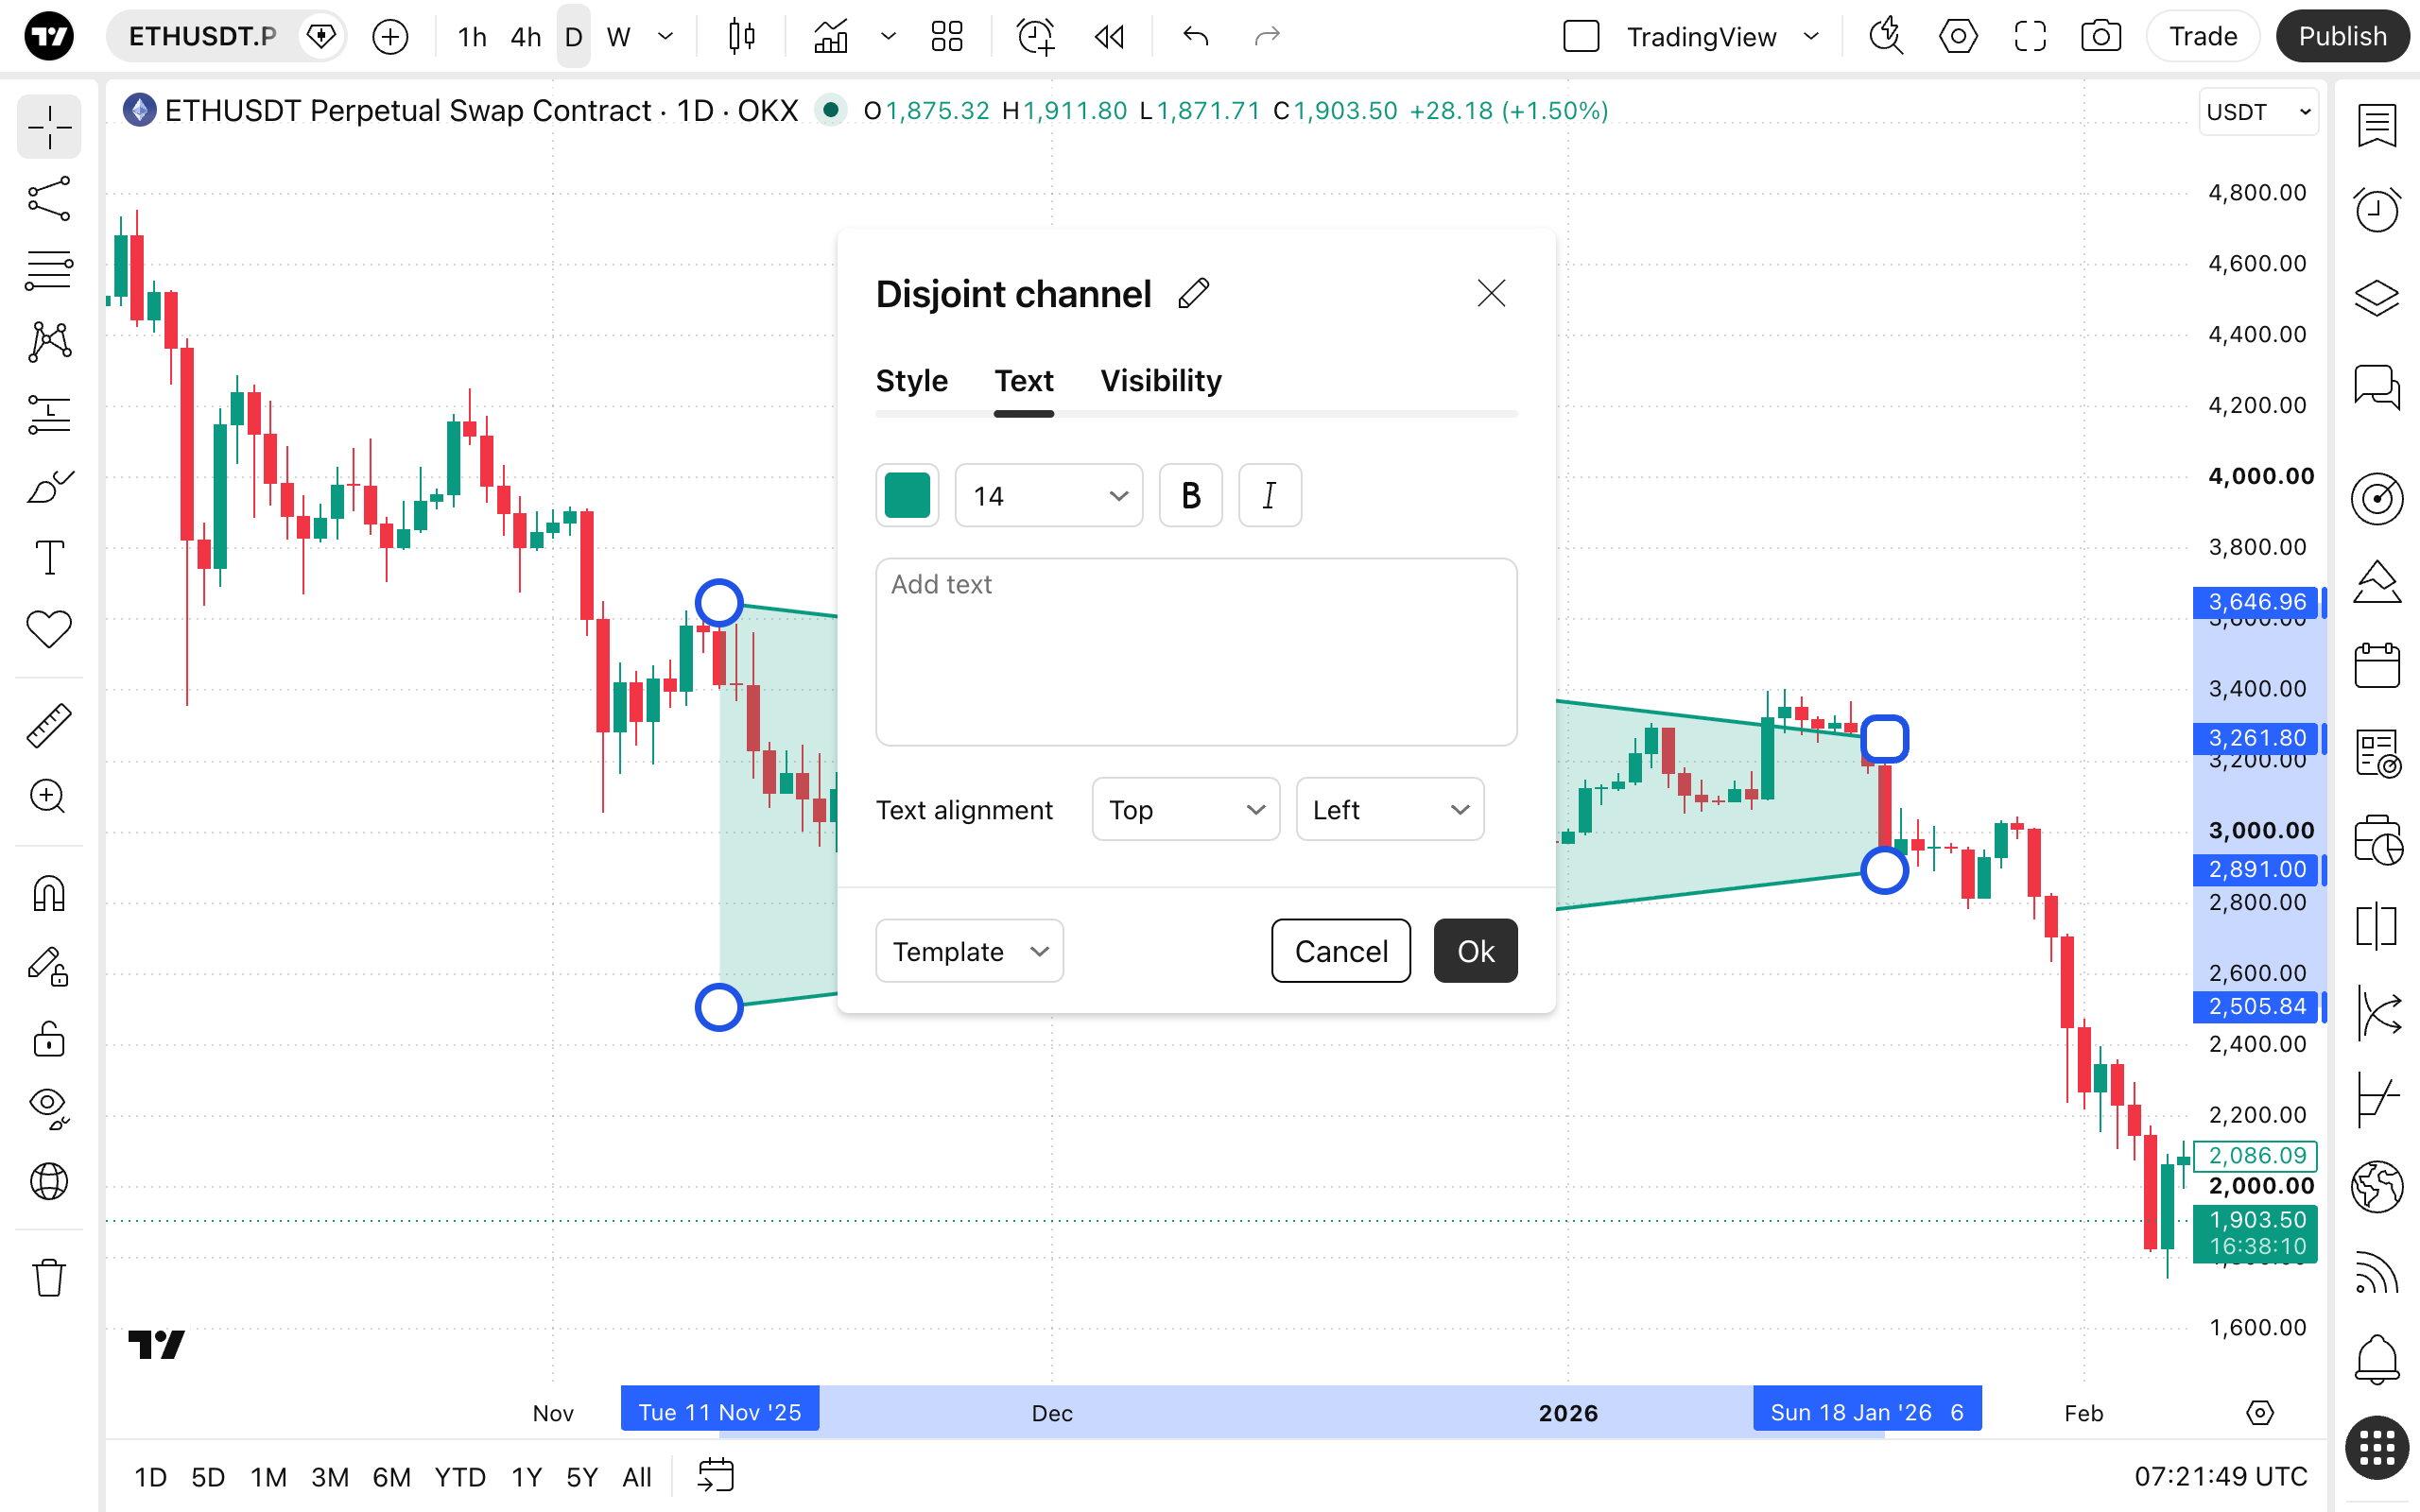
In the Text properties dialog, you can add custom text to the tool:
- Text Box: Allows you to type custom text that will be attached to the drawing.
- Text Formatting: You can modify the text color, opacity, and font size, as well as bold or italicize it.
- Alignment: Allows you to change the position and alignment of the text relative to the channel.
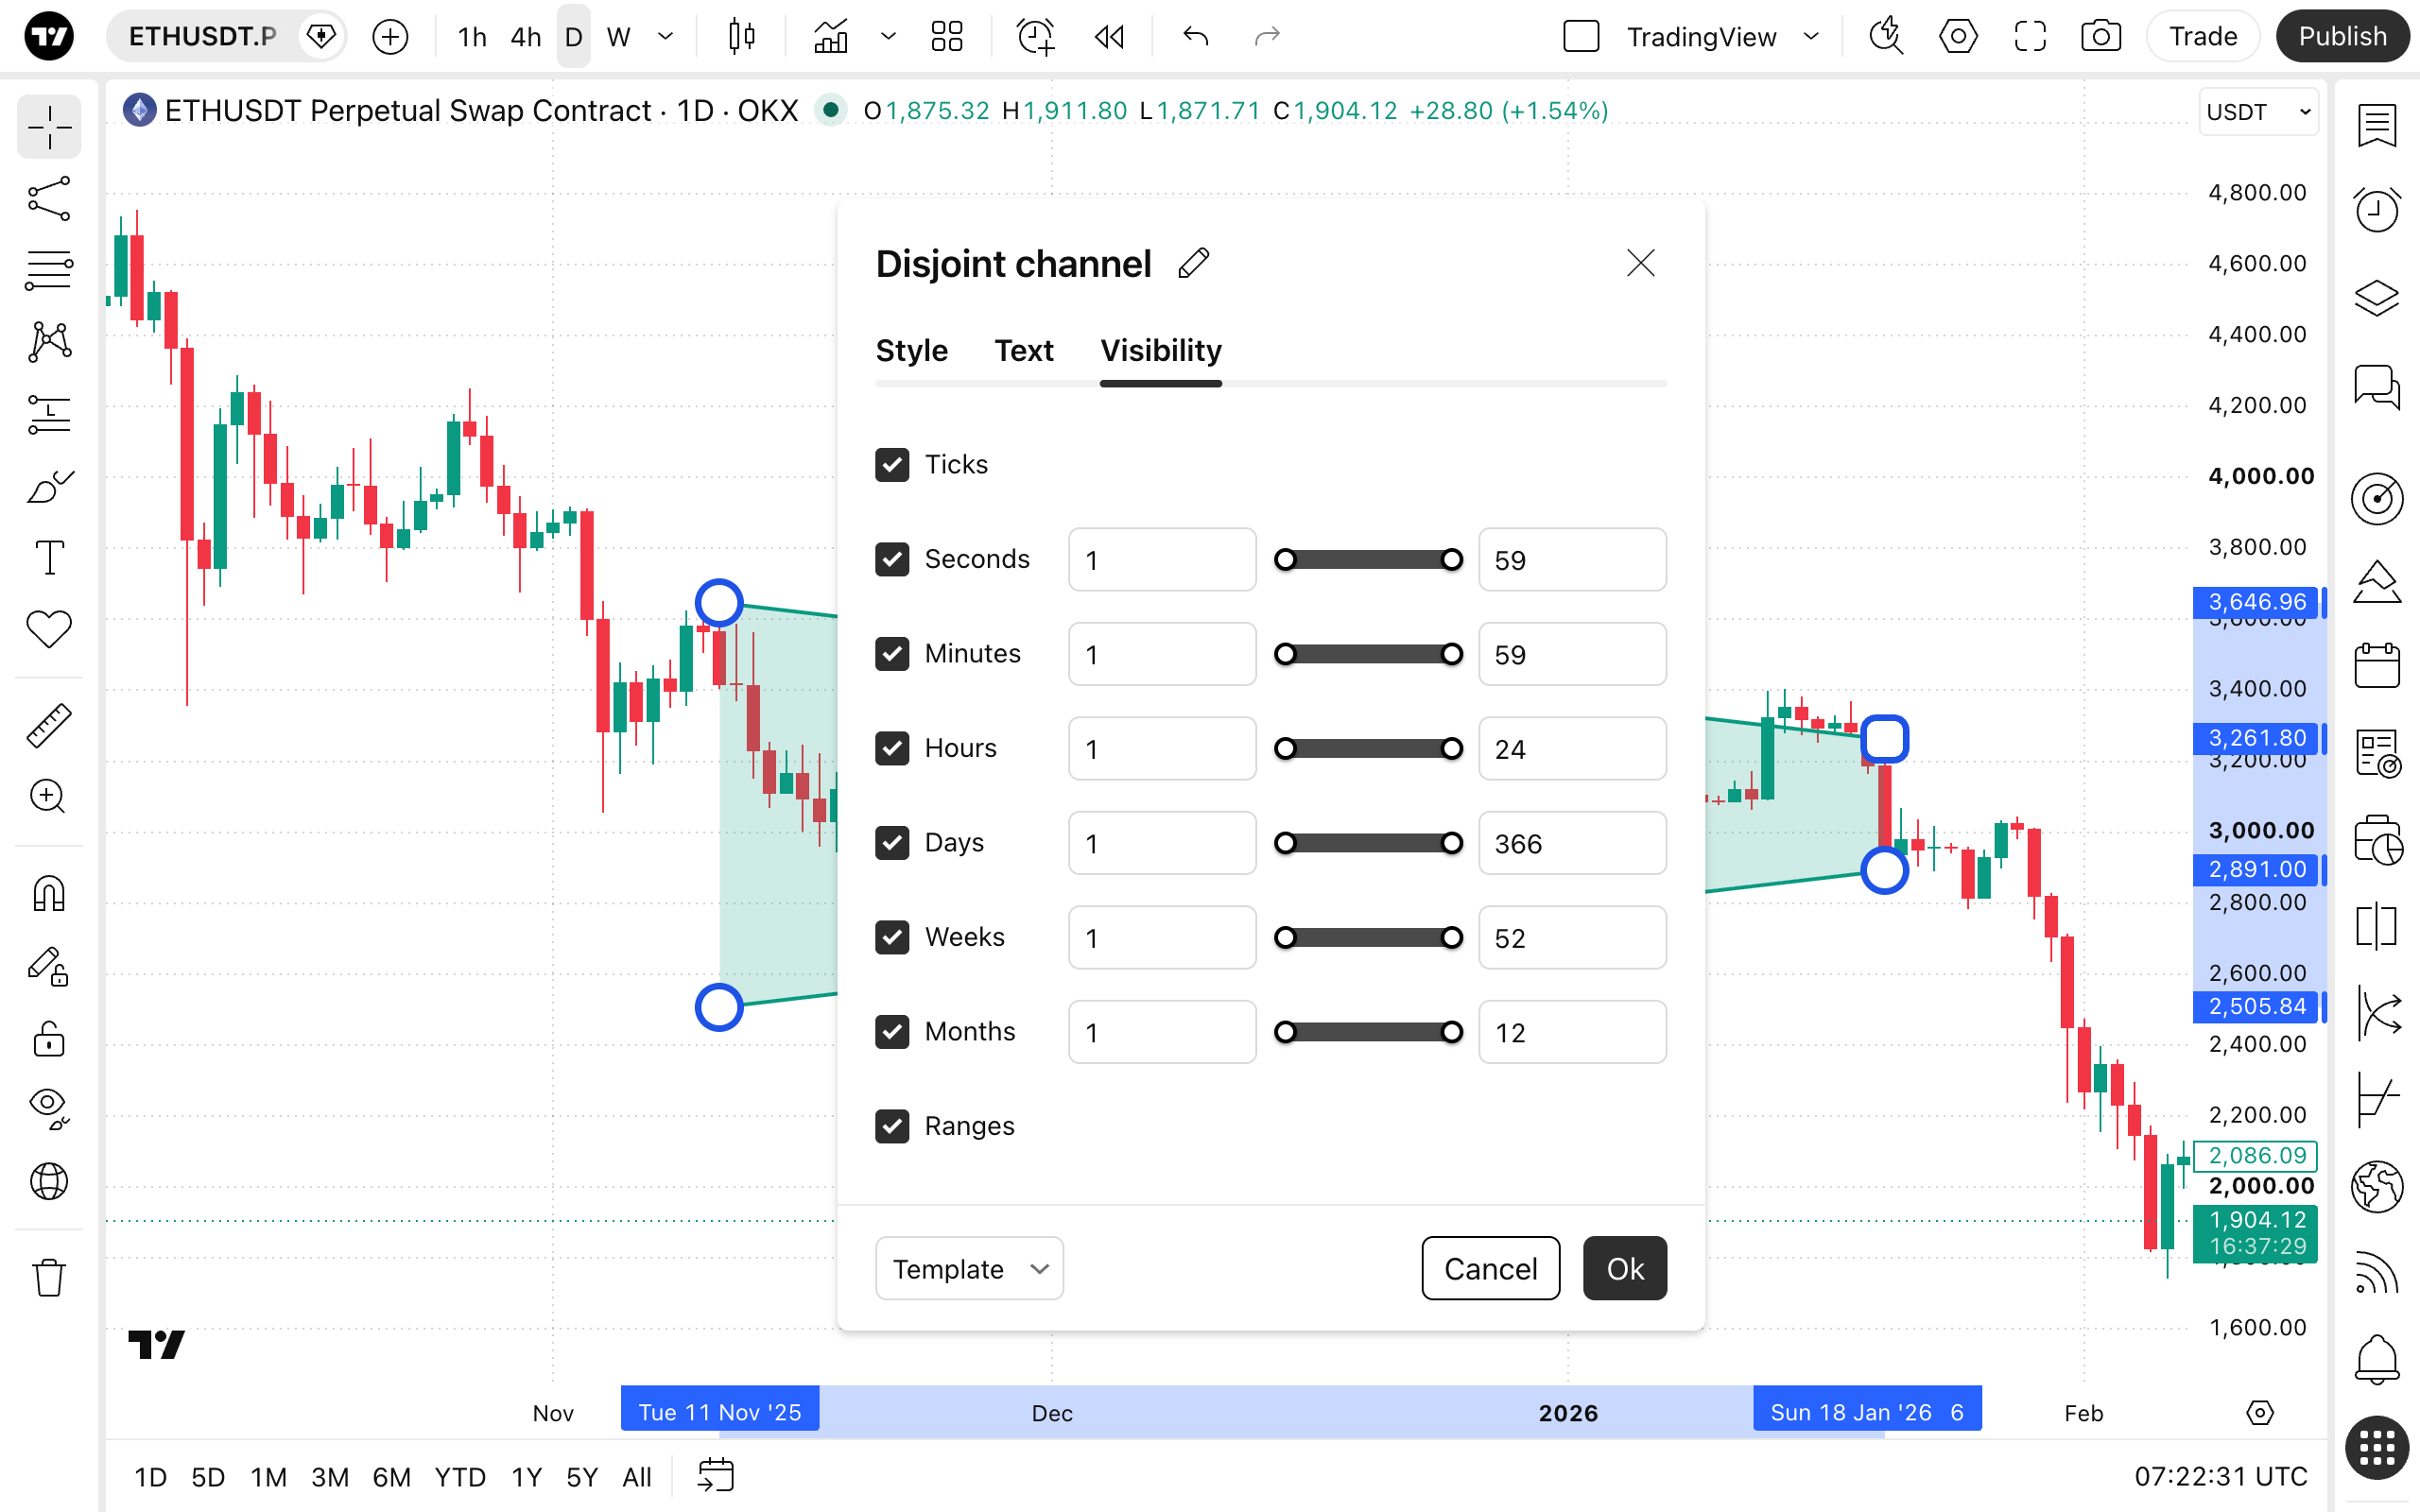
Visibility
In the Visibility properties dialog, you can switch the Disjoint channel tool displaying on charts of different chart intervals.