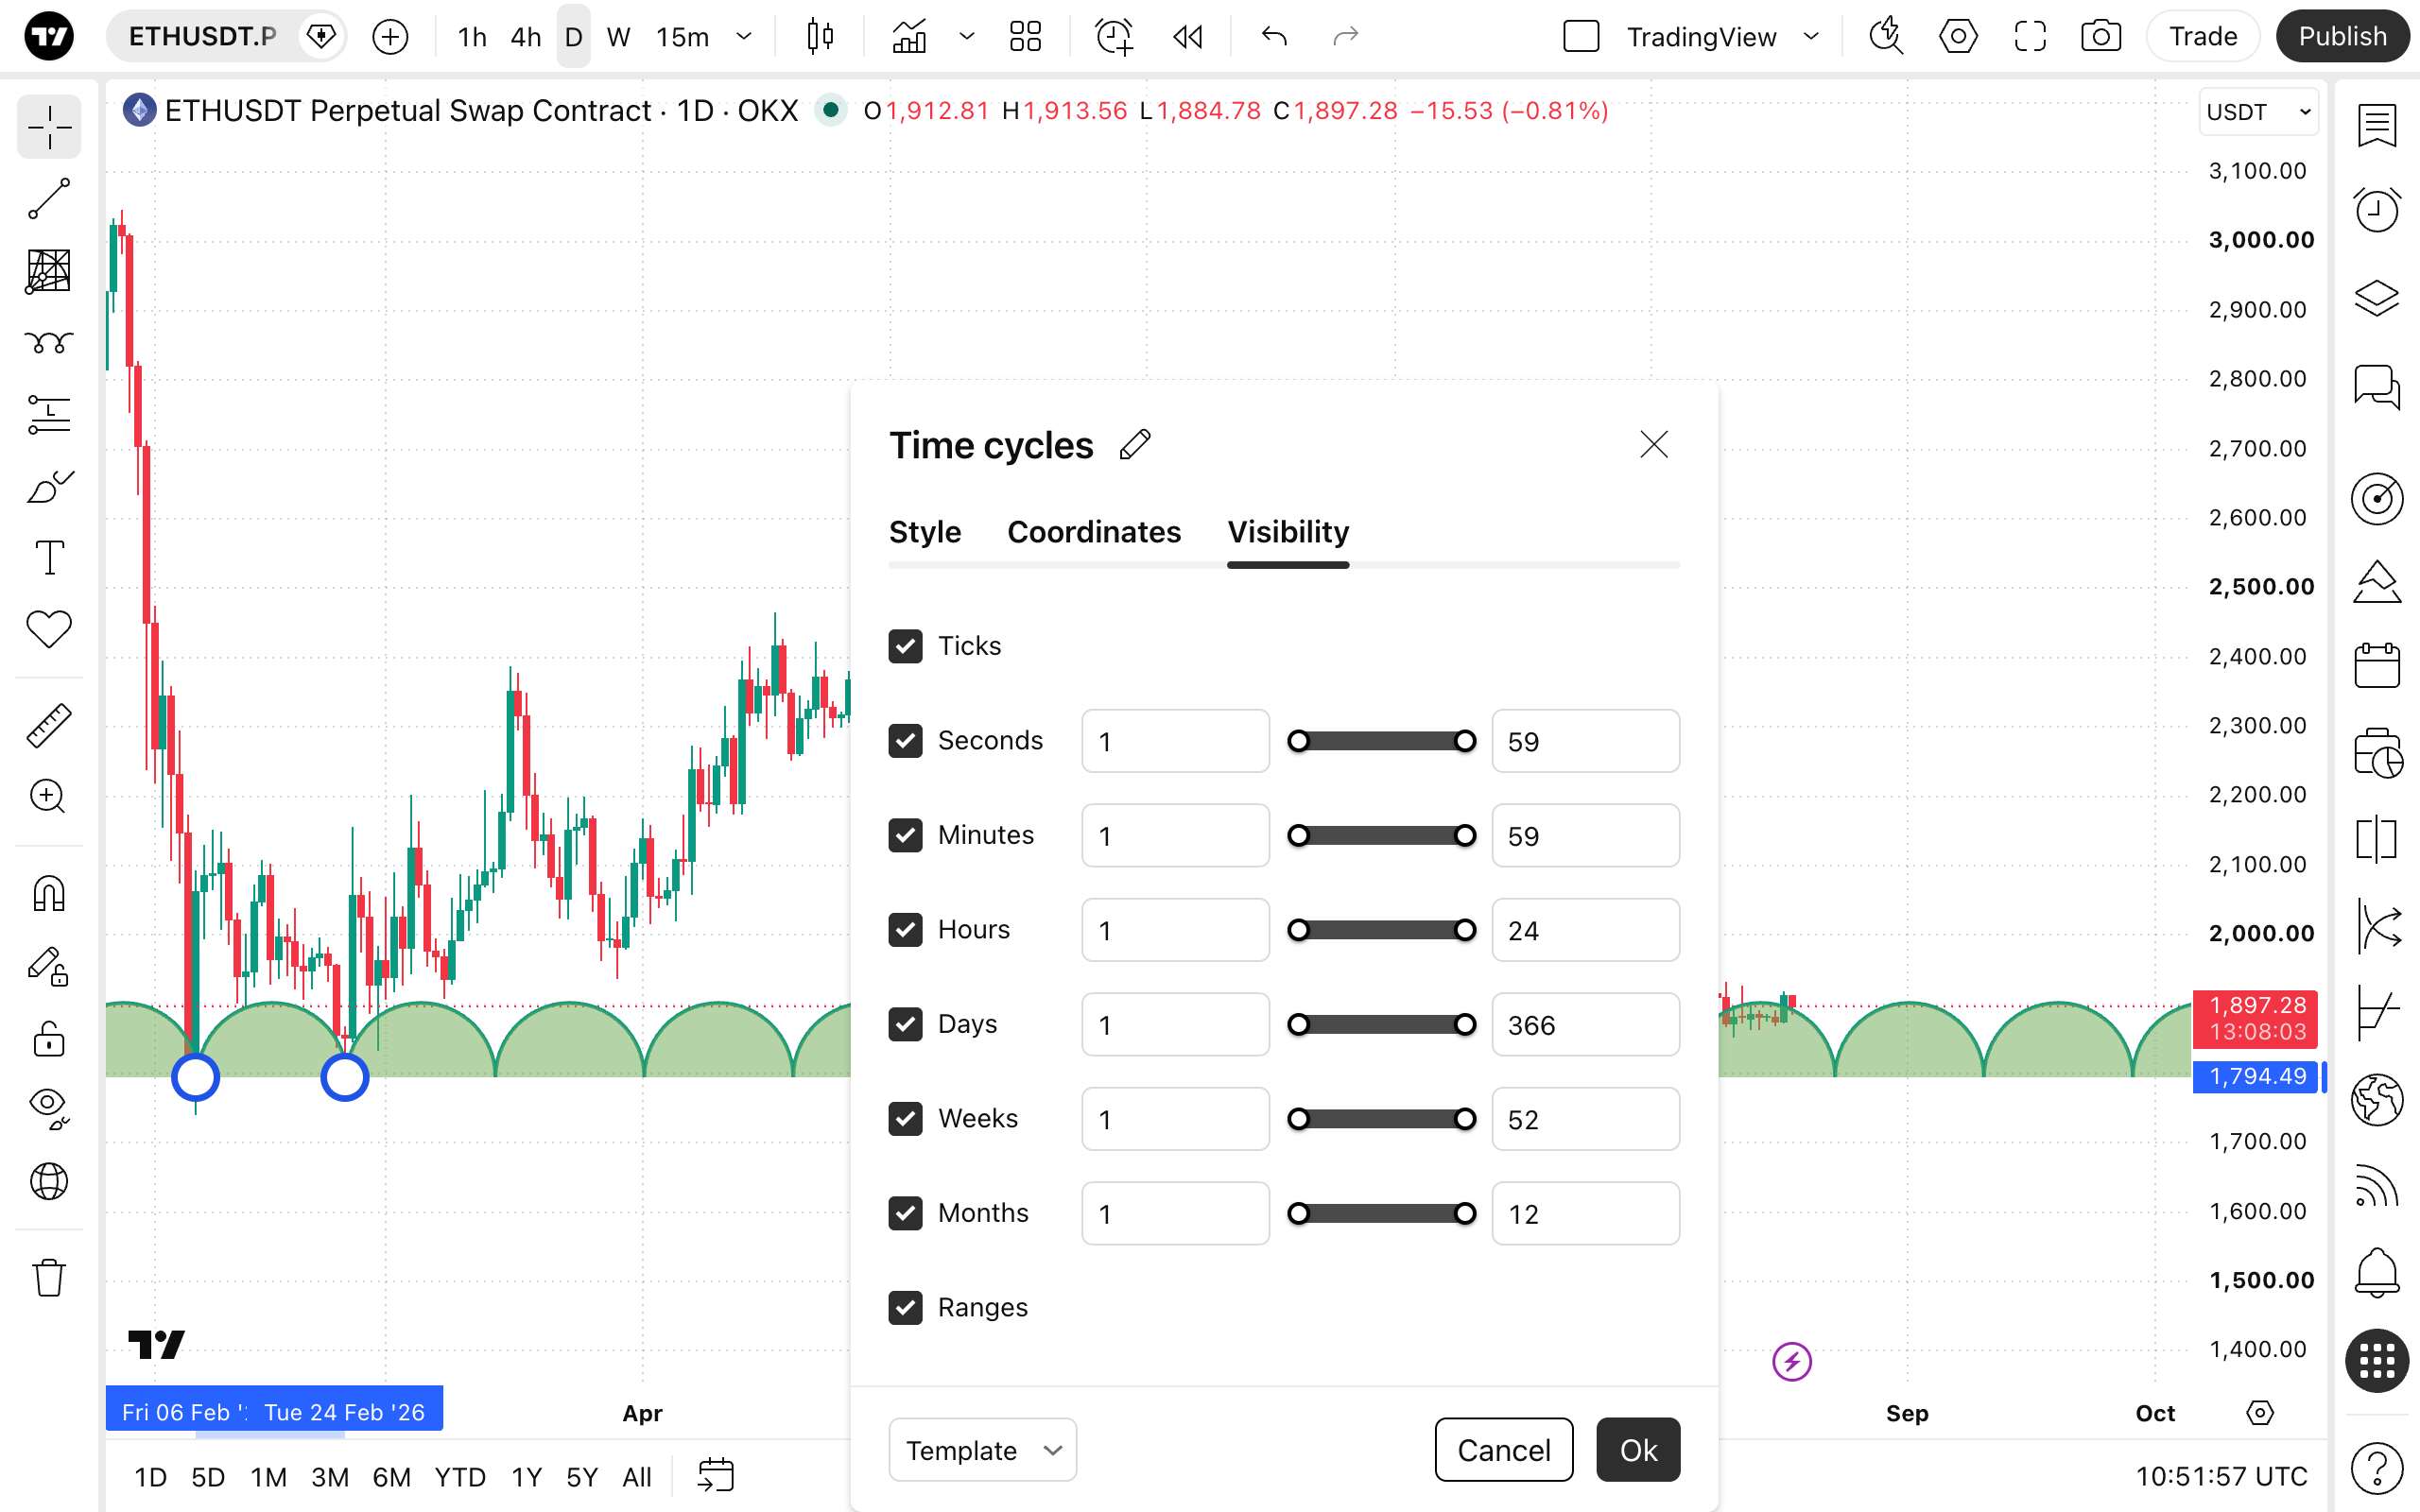
Time cycles drawing tool
The Time cycles drawing tool is used by technical analysts to identify and project recurring time intervals on a chart. By measuring the time between two significant market events (such as two consecutive peaks or troughs), traders can use this tool to anticipate potential future turning points or cyclical market behavior based on historical periodicity.
To draw Time cycles on your chart, select the tool from the drawing panel. Click once on the chart to establish the starting point of the cycle, drag your cursor horizontally to your desired second point, and click again to set the cycle's length (the interval). The tool will then automatically generate a continuous series of equidistant vertical lines projecting this exact time interval forward into the future.
Style
In the Style properties dialog, it is possible to change the visual appearance of the Time cycles tool.
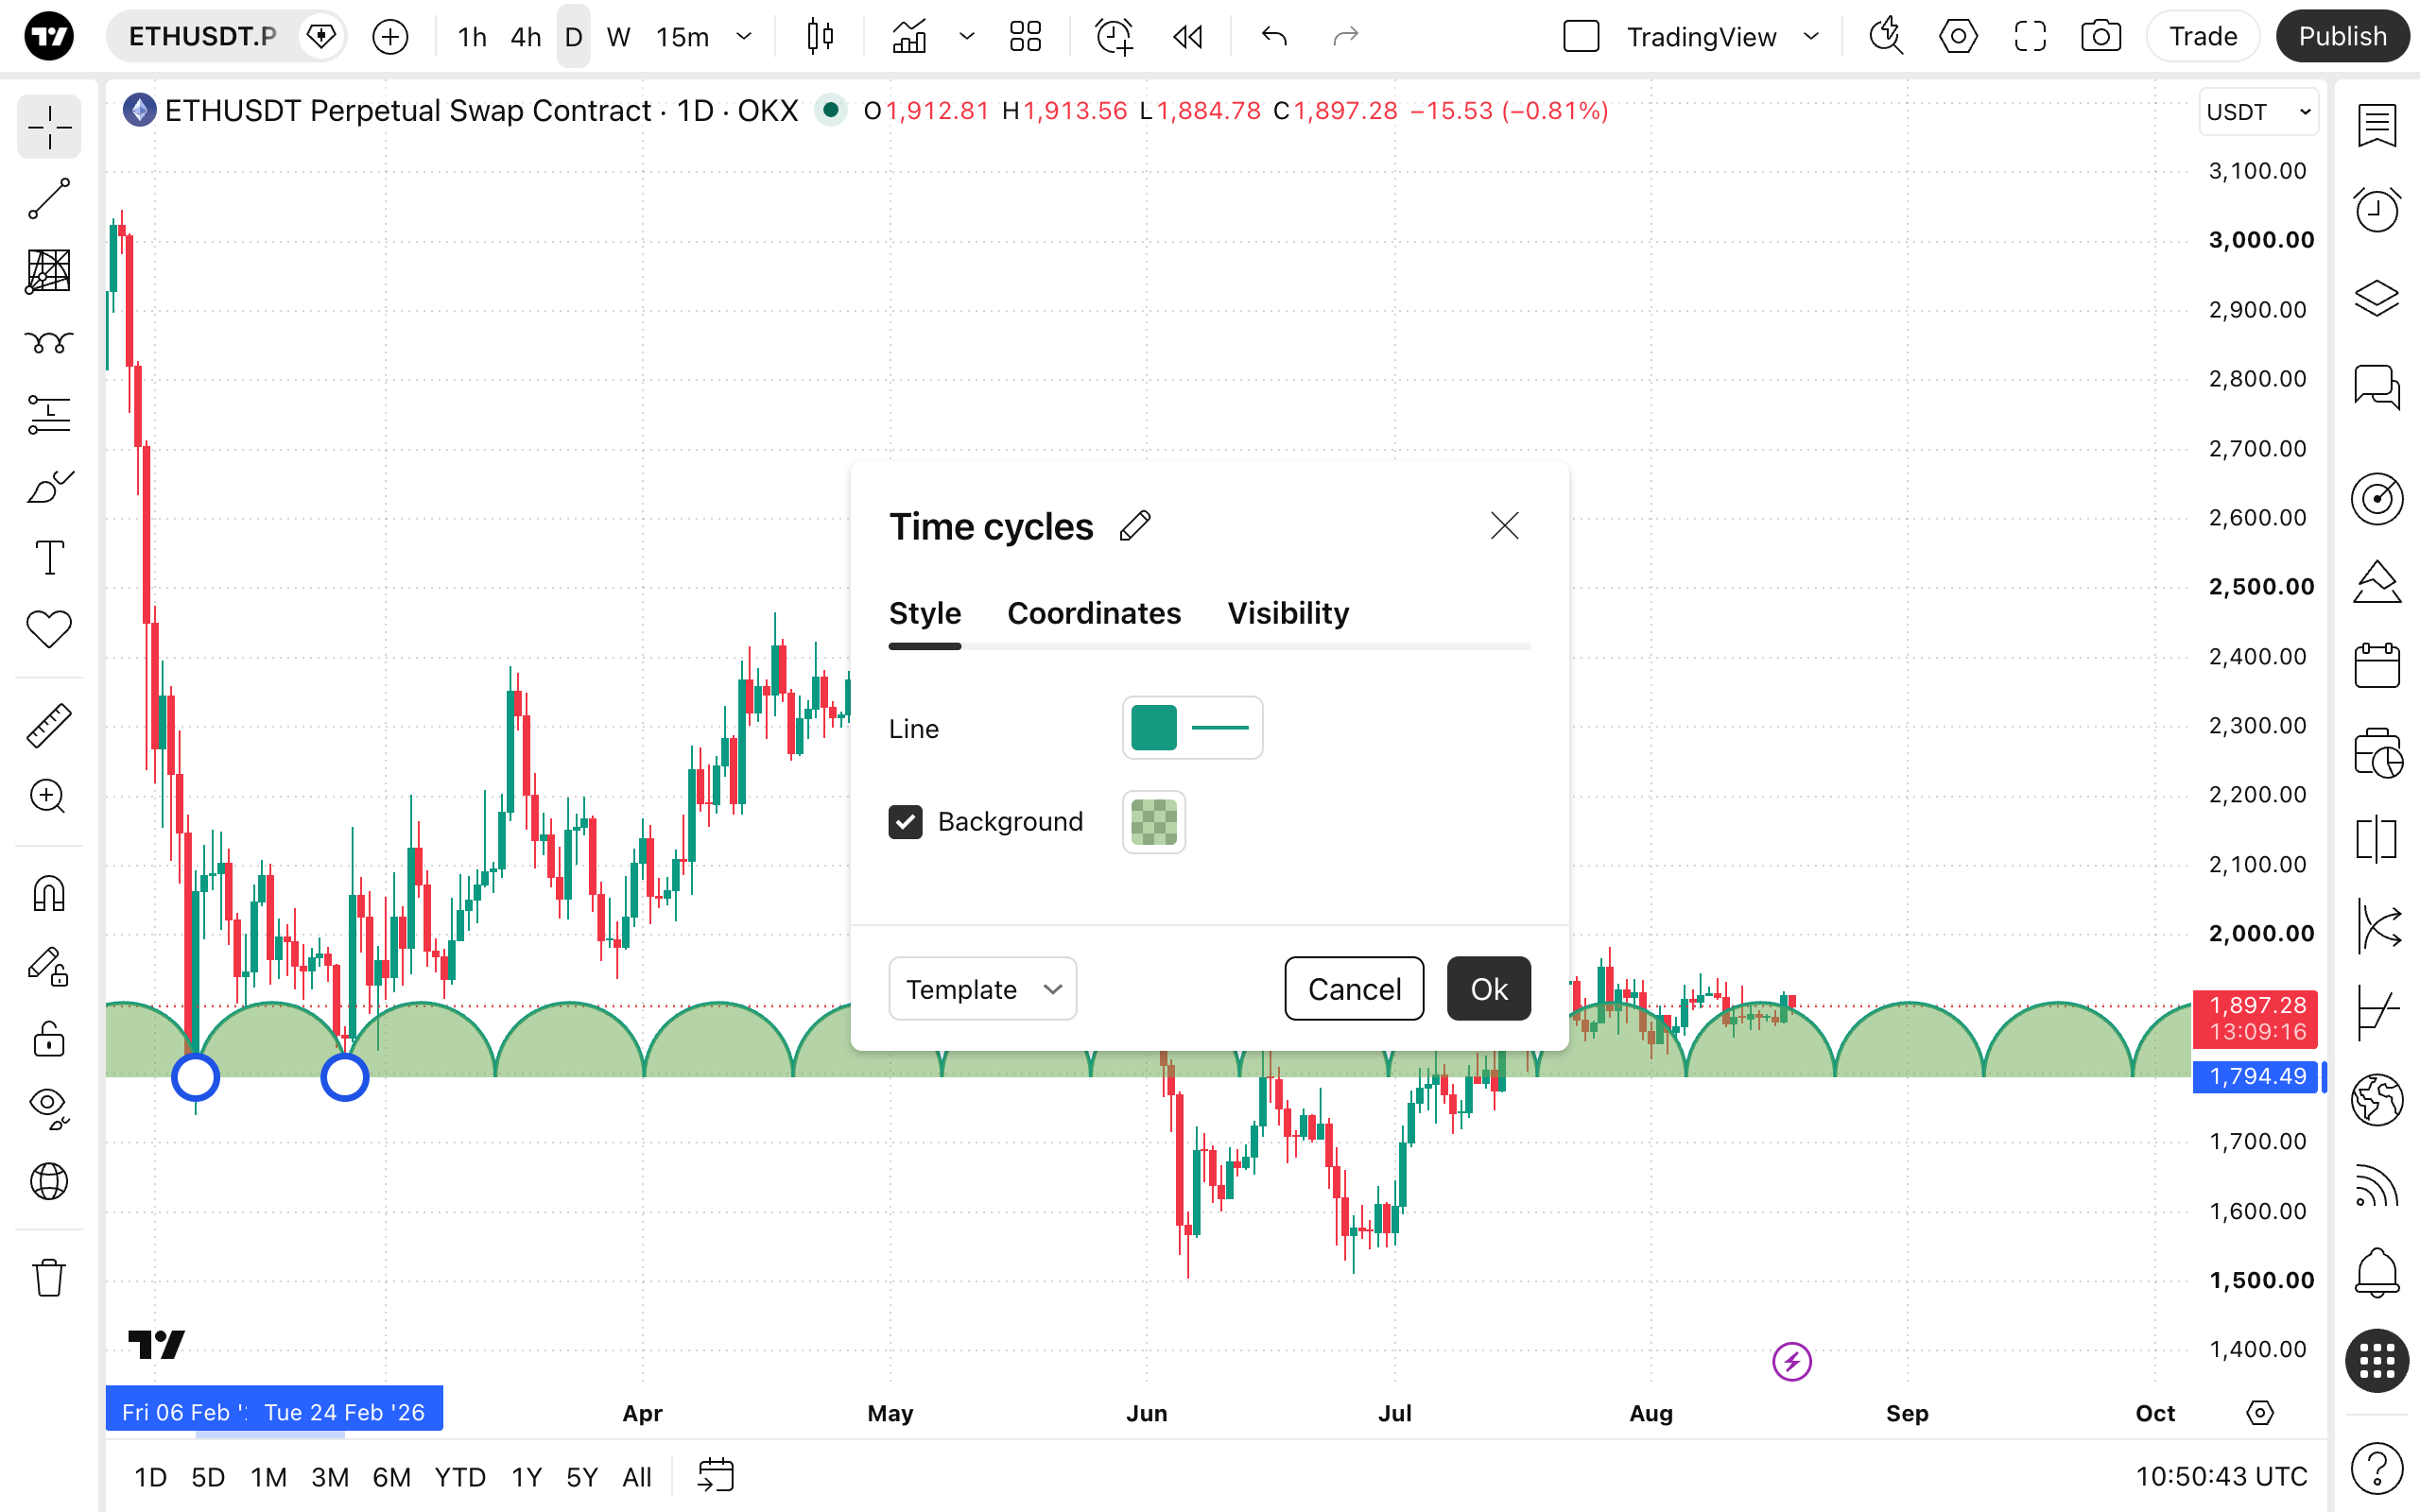
- Line: Allows you to change the color, opacity, thickness, and style (solid, dashed, or dotted) of the vertical cycle lines.
- Background: Toggles the visibility of the shaded background fill between the alternating cycle lines. You can use the adjacent color picker to adjust its color and opacity level.
Coordinates
In the Coordinates properties dialog, you can set precisely the position of the tool's anchor points on the price scale (by setting the price) and the time axis (by setting the bar number).
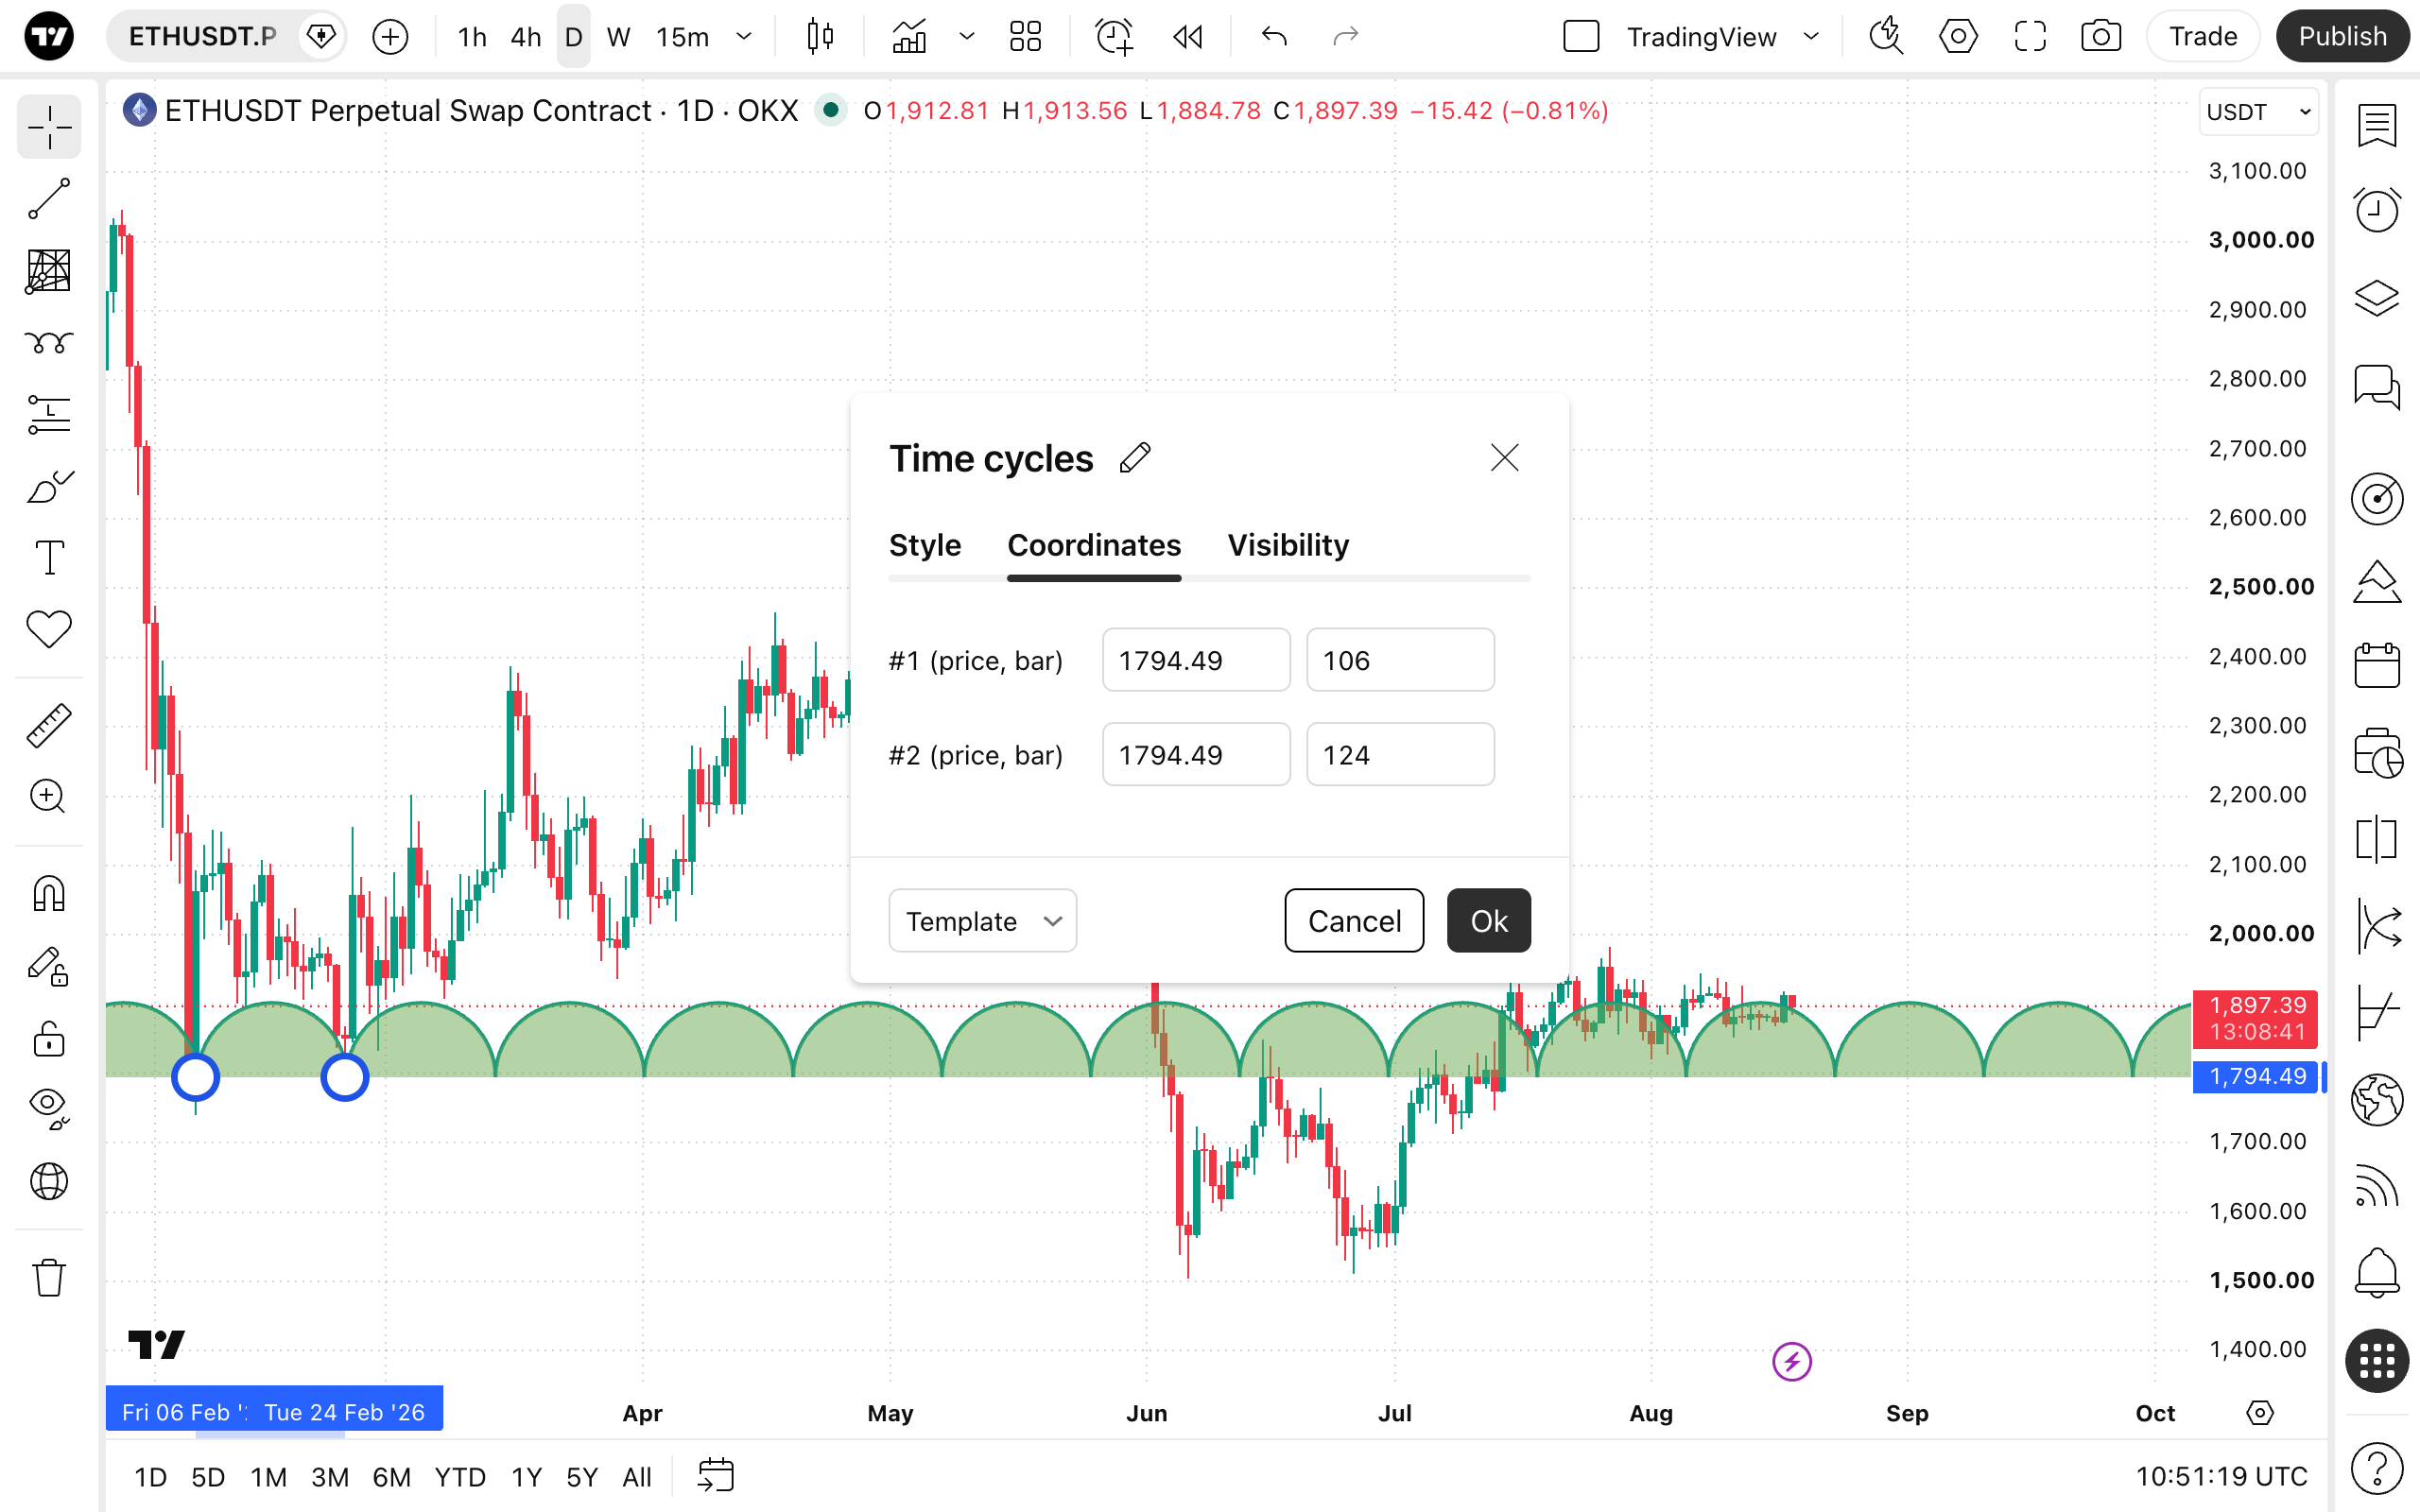
- Price 1: Allows for the precise placement of the tool's first anchor point using a bar number and price.
- Price 2: Allows for the precise placement of the tool's second anchor point, which dictates the time interval between the cycles, using a bar number and price.
Visibility
In the Visibility properties dialog, you can switch the Time cycles tool displaying on charts of different chart intervals.