Path drawing tool
Application
The Path drawing tool allows users to draw a continuous series of connected line segments to map out custom shapes, complex chart patterns, or projected future price movements. Unlike standard trendlines that only connect two points, the Path tool can have an unlimited number of pivot points, making it highly versatile for tracking intricate market structures like Elliott Waves or custom zig-zag patterns.
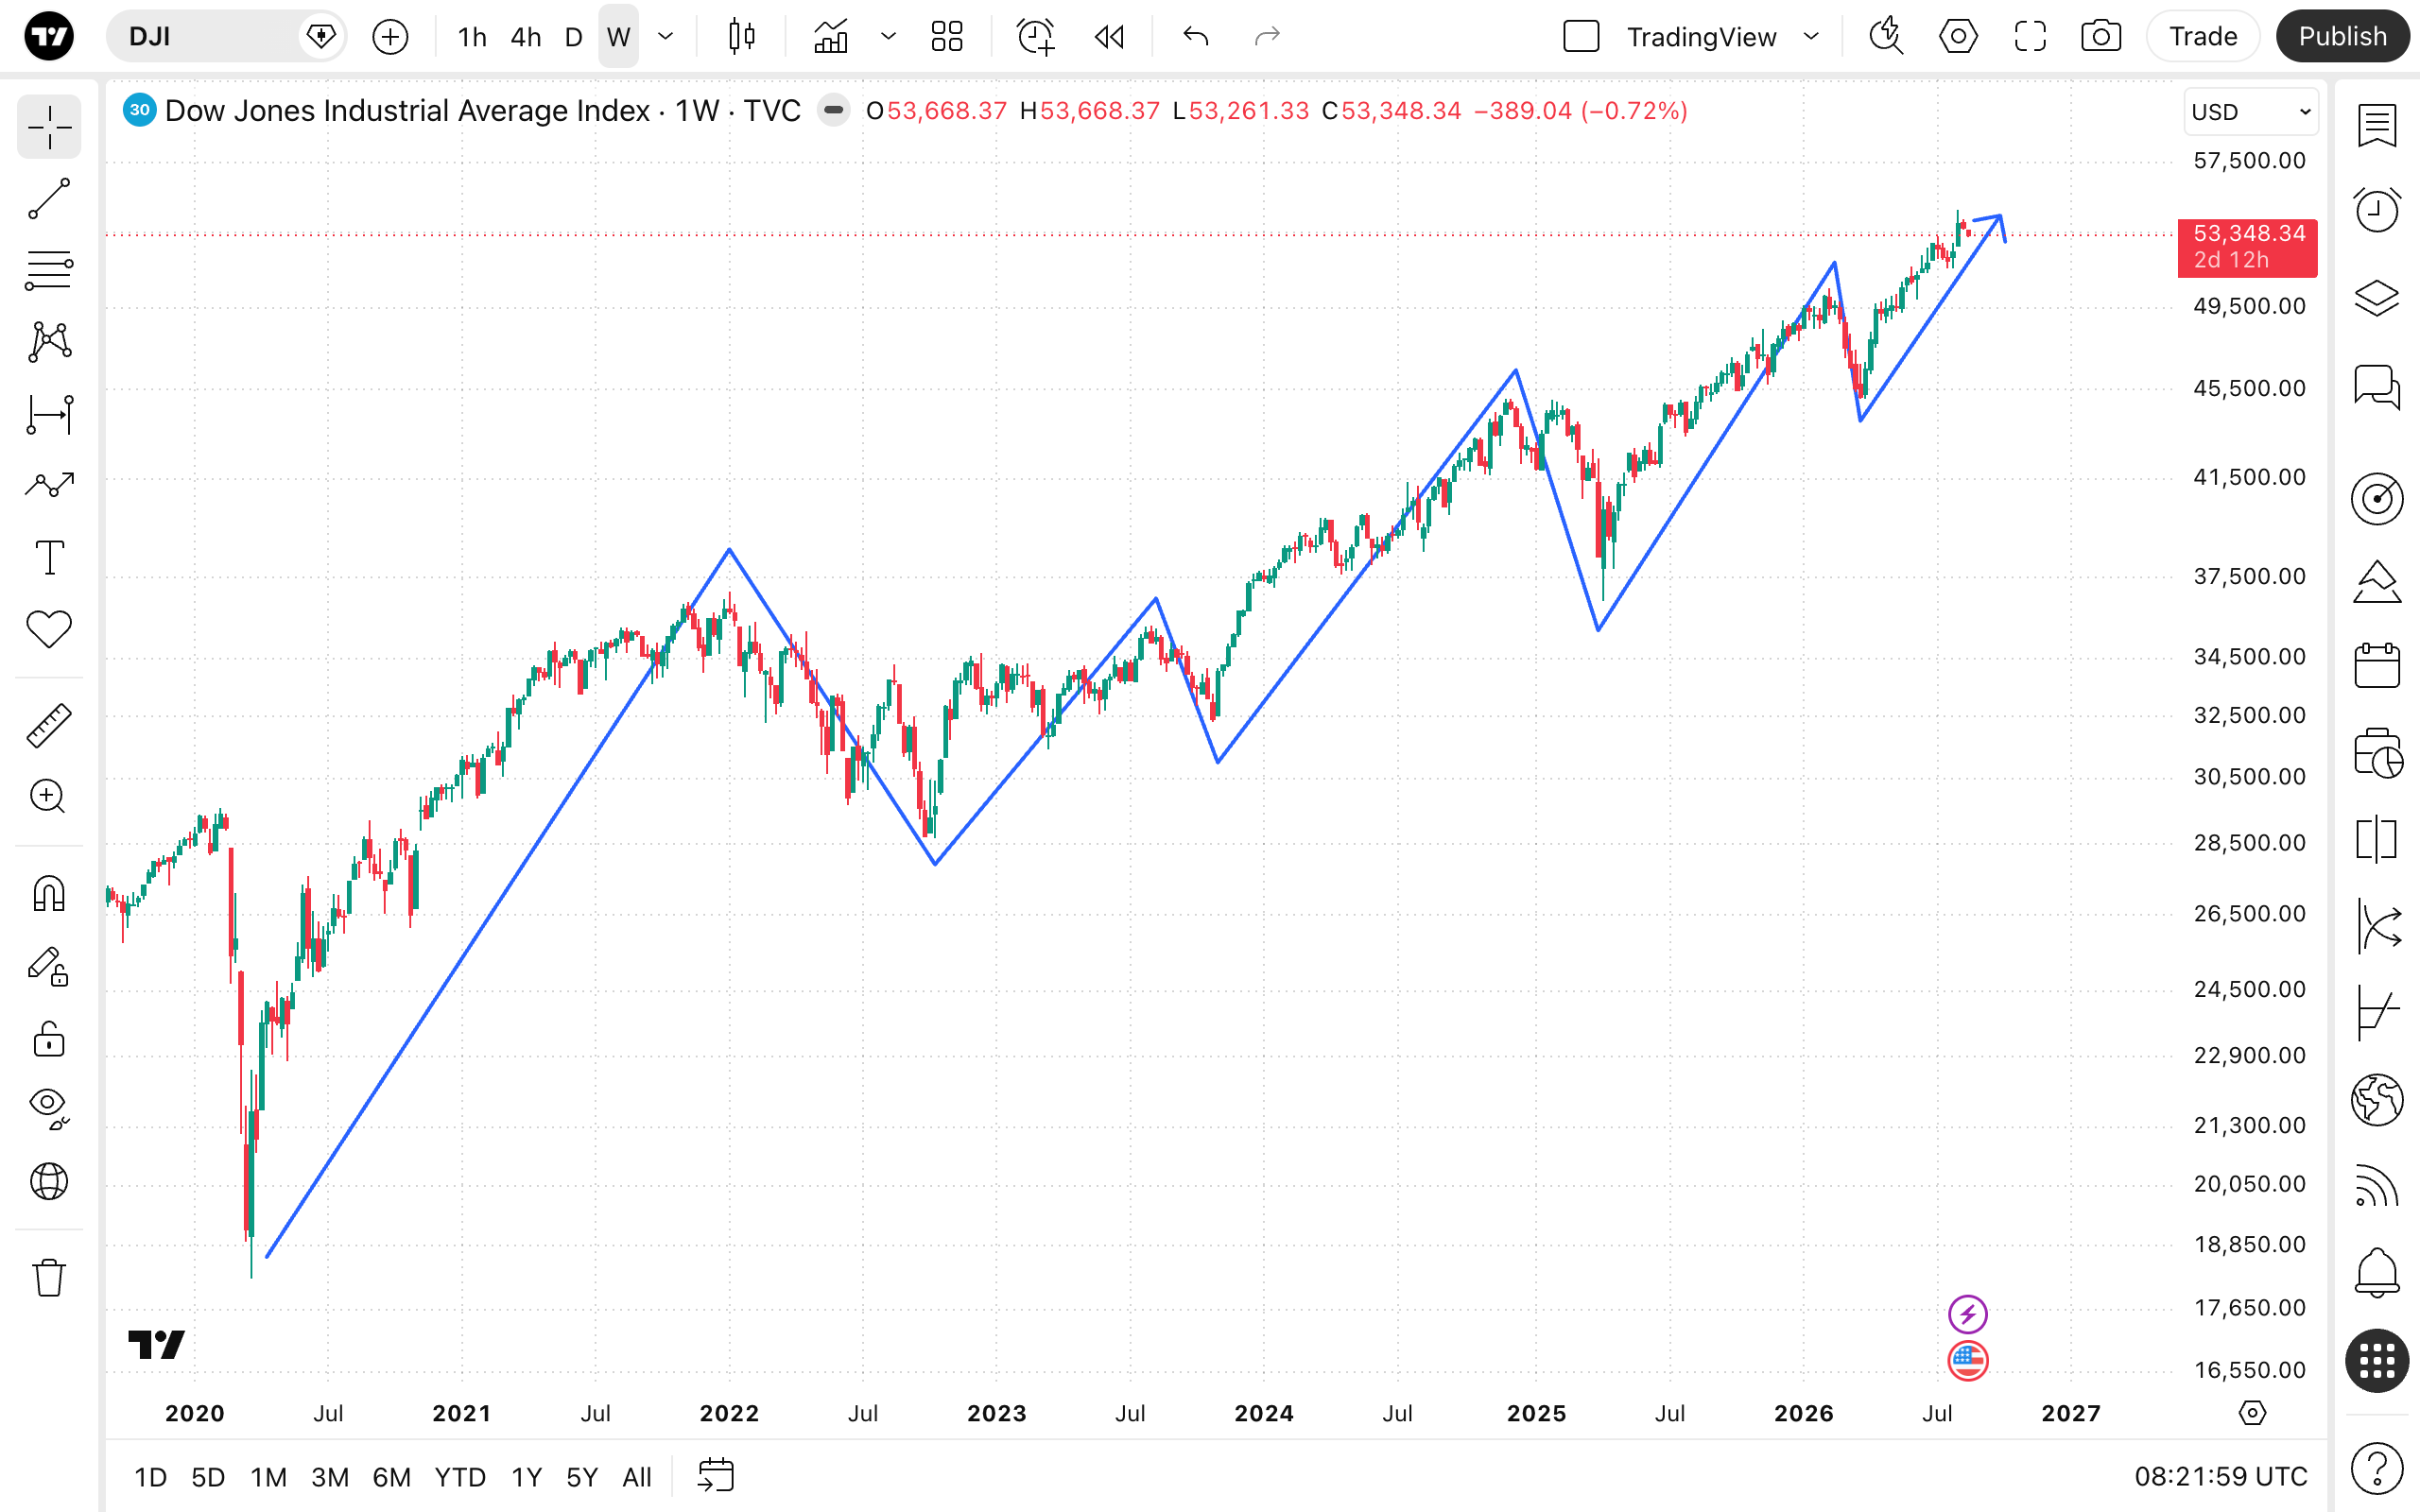
To draw a Path, select the tool from the drawing panel. Click on the chart to set your starting point, then continue clicking to place subsequent anchor points along your desired trajectory. To complete the drawing, simply double-click on the final point or press the Esc key on your keyboard.