Options Volume Profile: see call and put volume right on the chart
Options Volume Profile is an indicator for Supercharts that displays the traded volume of call and put contracts directly on the chart of the underlying asset. For each expiration, you can see how volume is distributed across strikes and where the largest concentrations of calls or puts are located.
Suppose you are watching Apple ahead of an earnings release and want to understand where options traders are positioned. Are they buying calls above the current price, or hedging with puts below it? Which strikes attract the most activity for the nearest expiration, and how does that change for expirations further out?
Options Volume Profile answers these questions without leaving the chart. It plots a volume profile for each upcoming expiration next to its date on the time scale, so you can compare options activity with the price action of the underlying asset.
Adding the indicator to the chart
- Open the chart of an underlying asset that has listed options, for example, AAPL.
- Click Indicators on the top toolbar.
- Go to the Options tab and select Options Volume Profile.
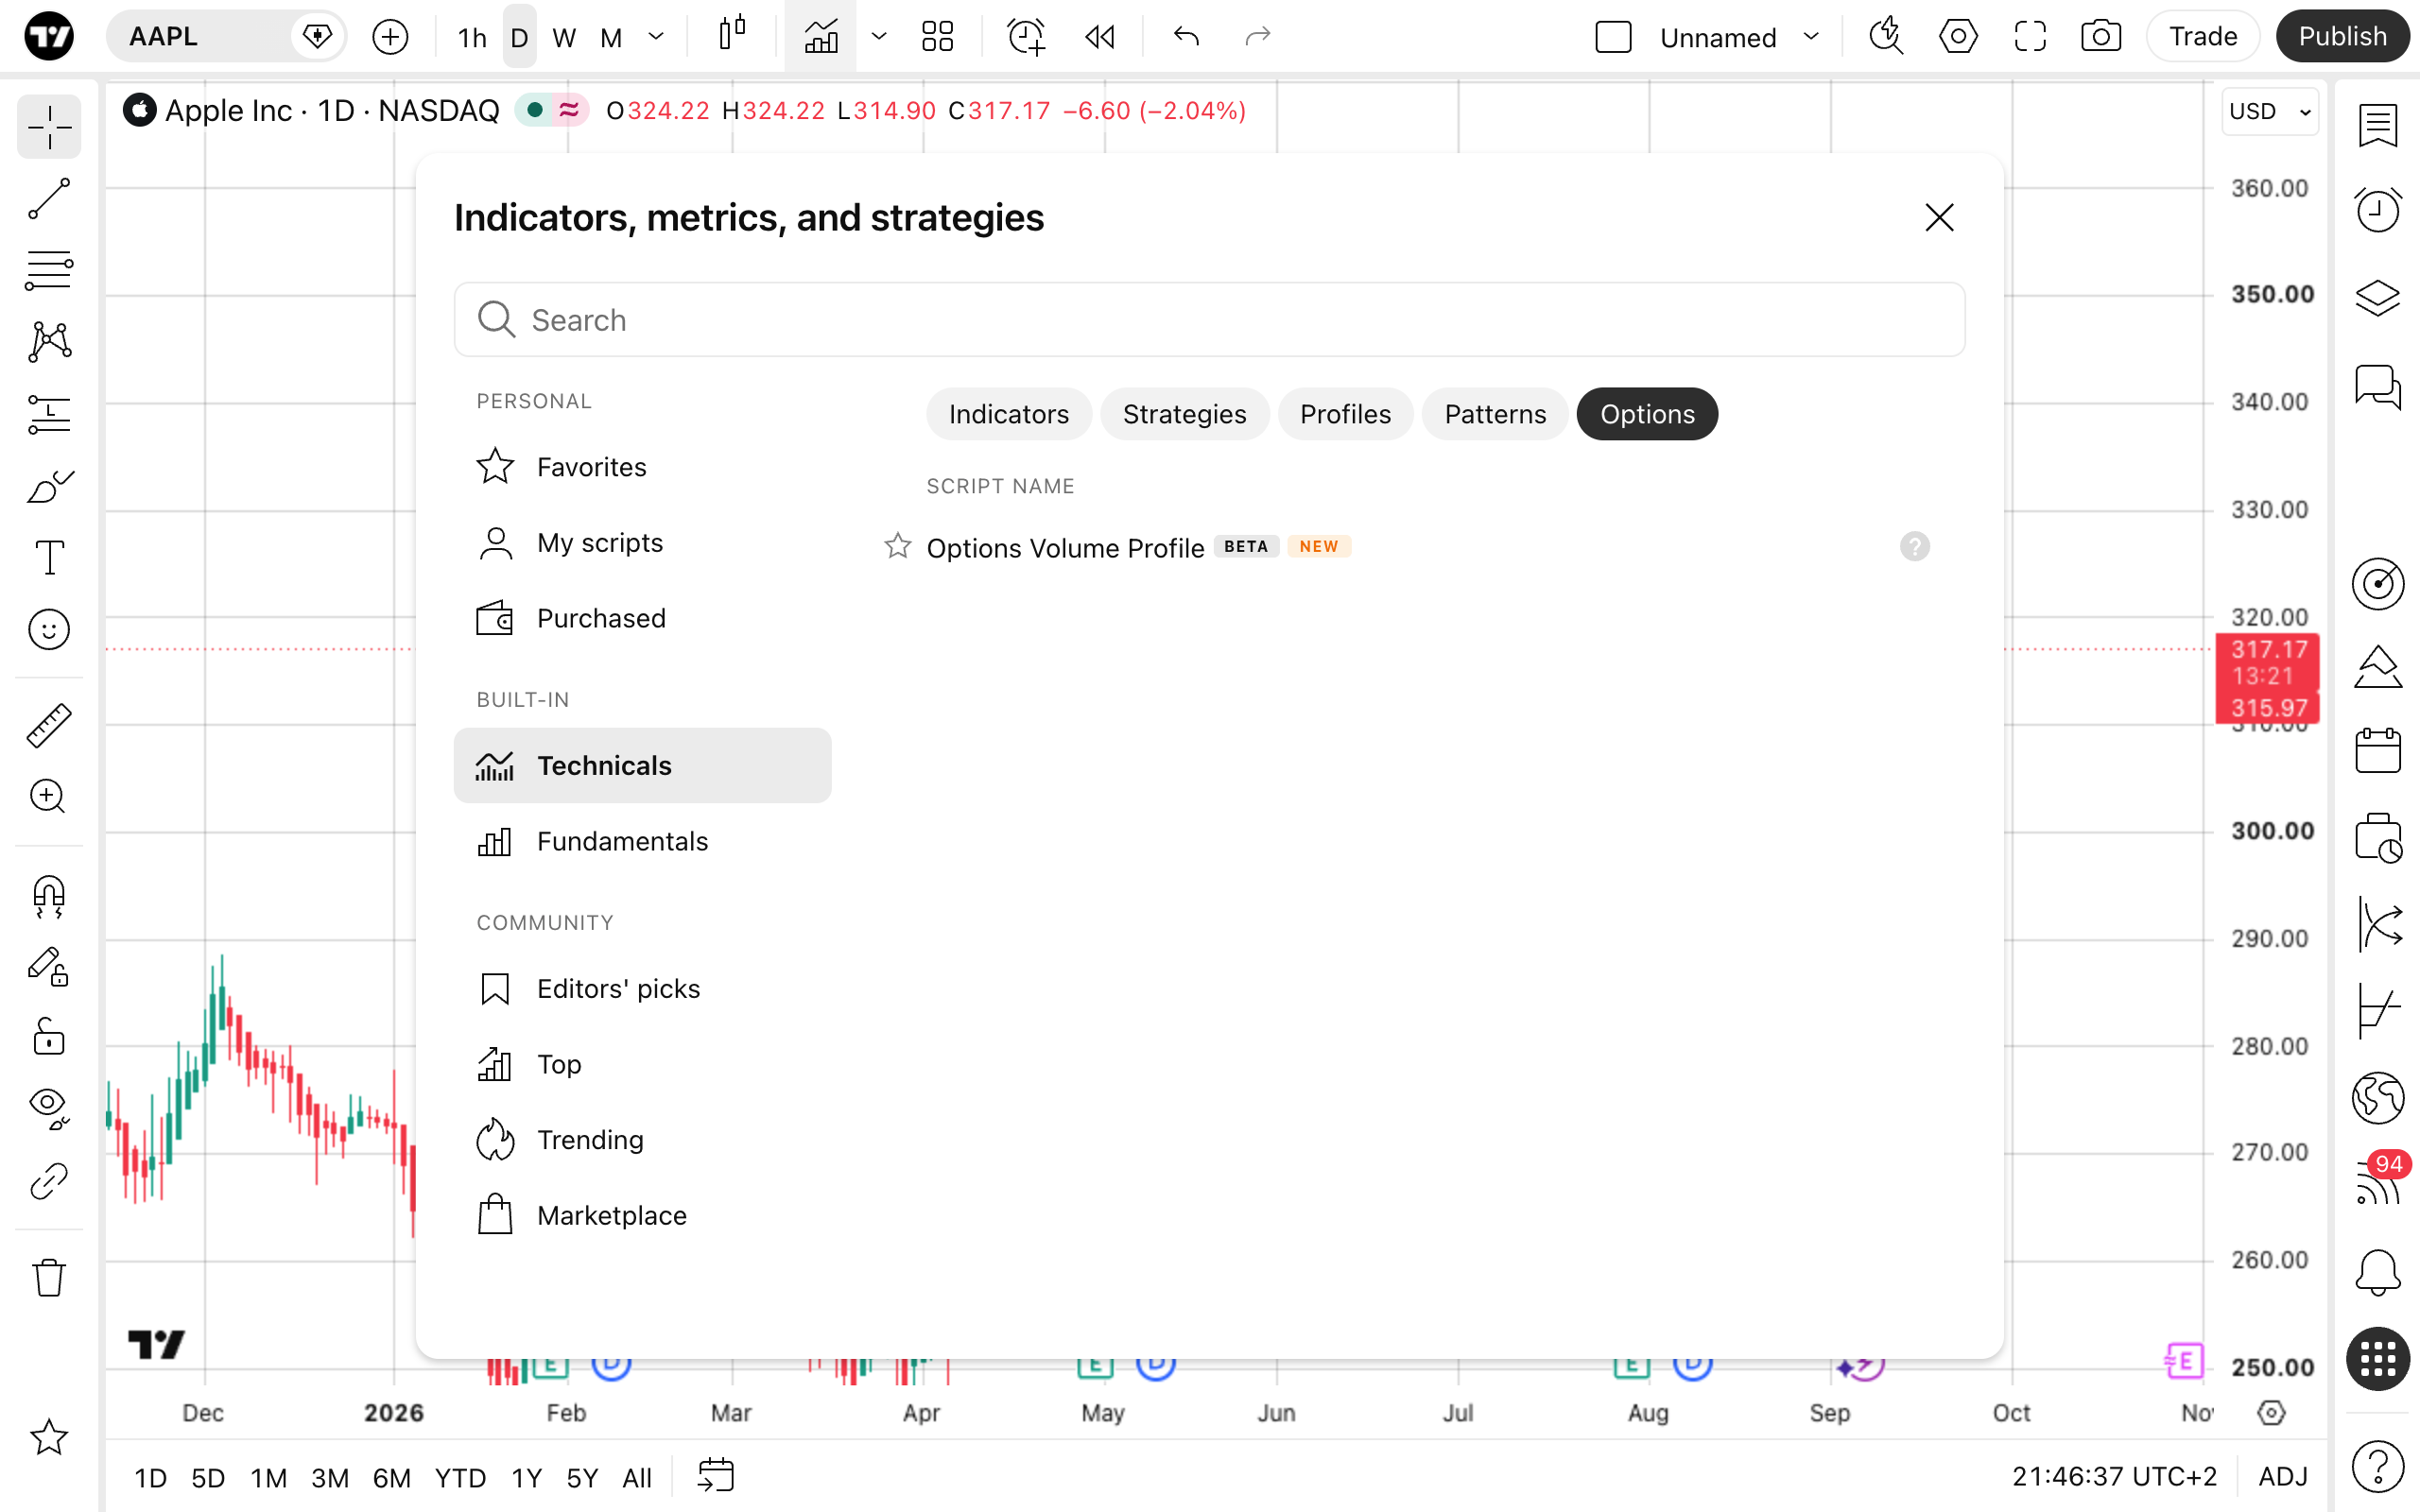
The indicator is added to the main chart pane. Its status line shows the abbreviation OVP, the current input values, and the selected display mode.
Note that the indicator works on the daily, weekly, and monthly timeframes. If you switch to an intraday interval, the profiles are not displayed.
Options Volume Profile view
Each expiration is shown as a separate profile aligned with the expiration date on the time scale. Within a profile, every horizontal bar corresponds to a strike, and the bar length reflects the traded volume at that strike.
By default, calls and puts are shown side by side: call volume is plotted in blue and put volume in red. The label next to each bar shows the exact values in the format calls x puts, for example, 42.42K x 4.53K.
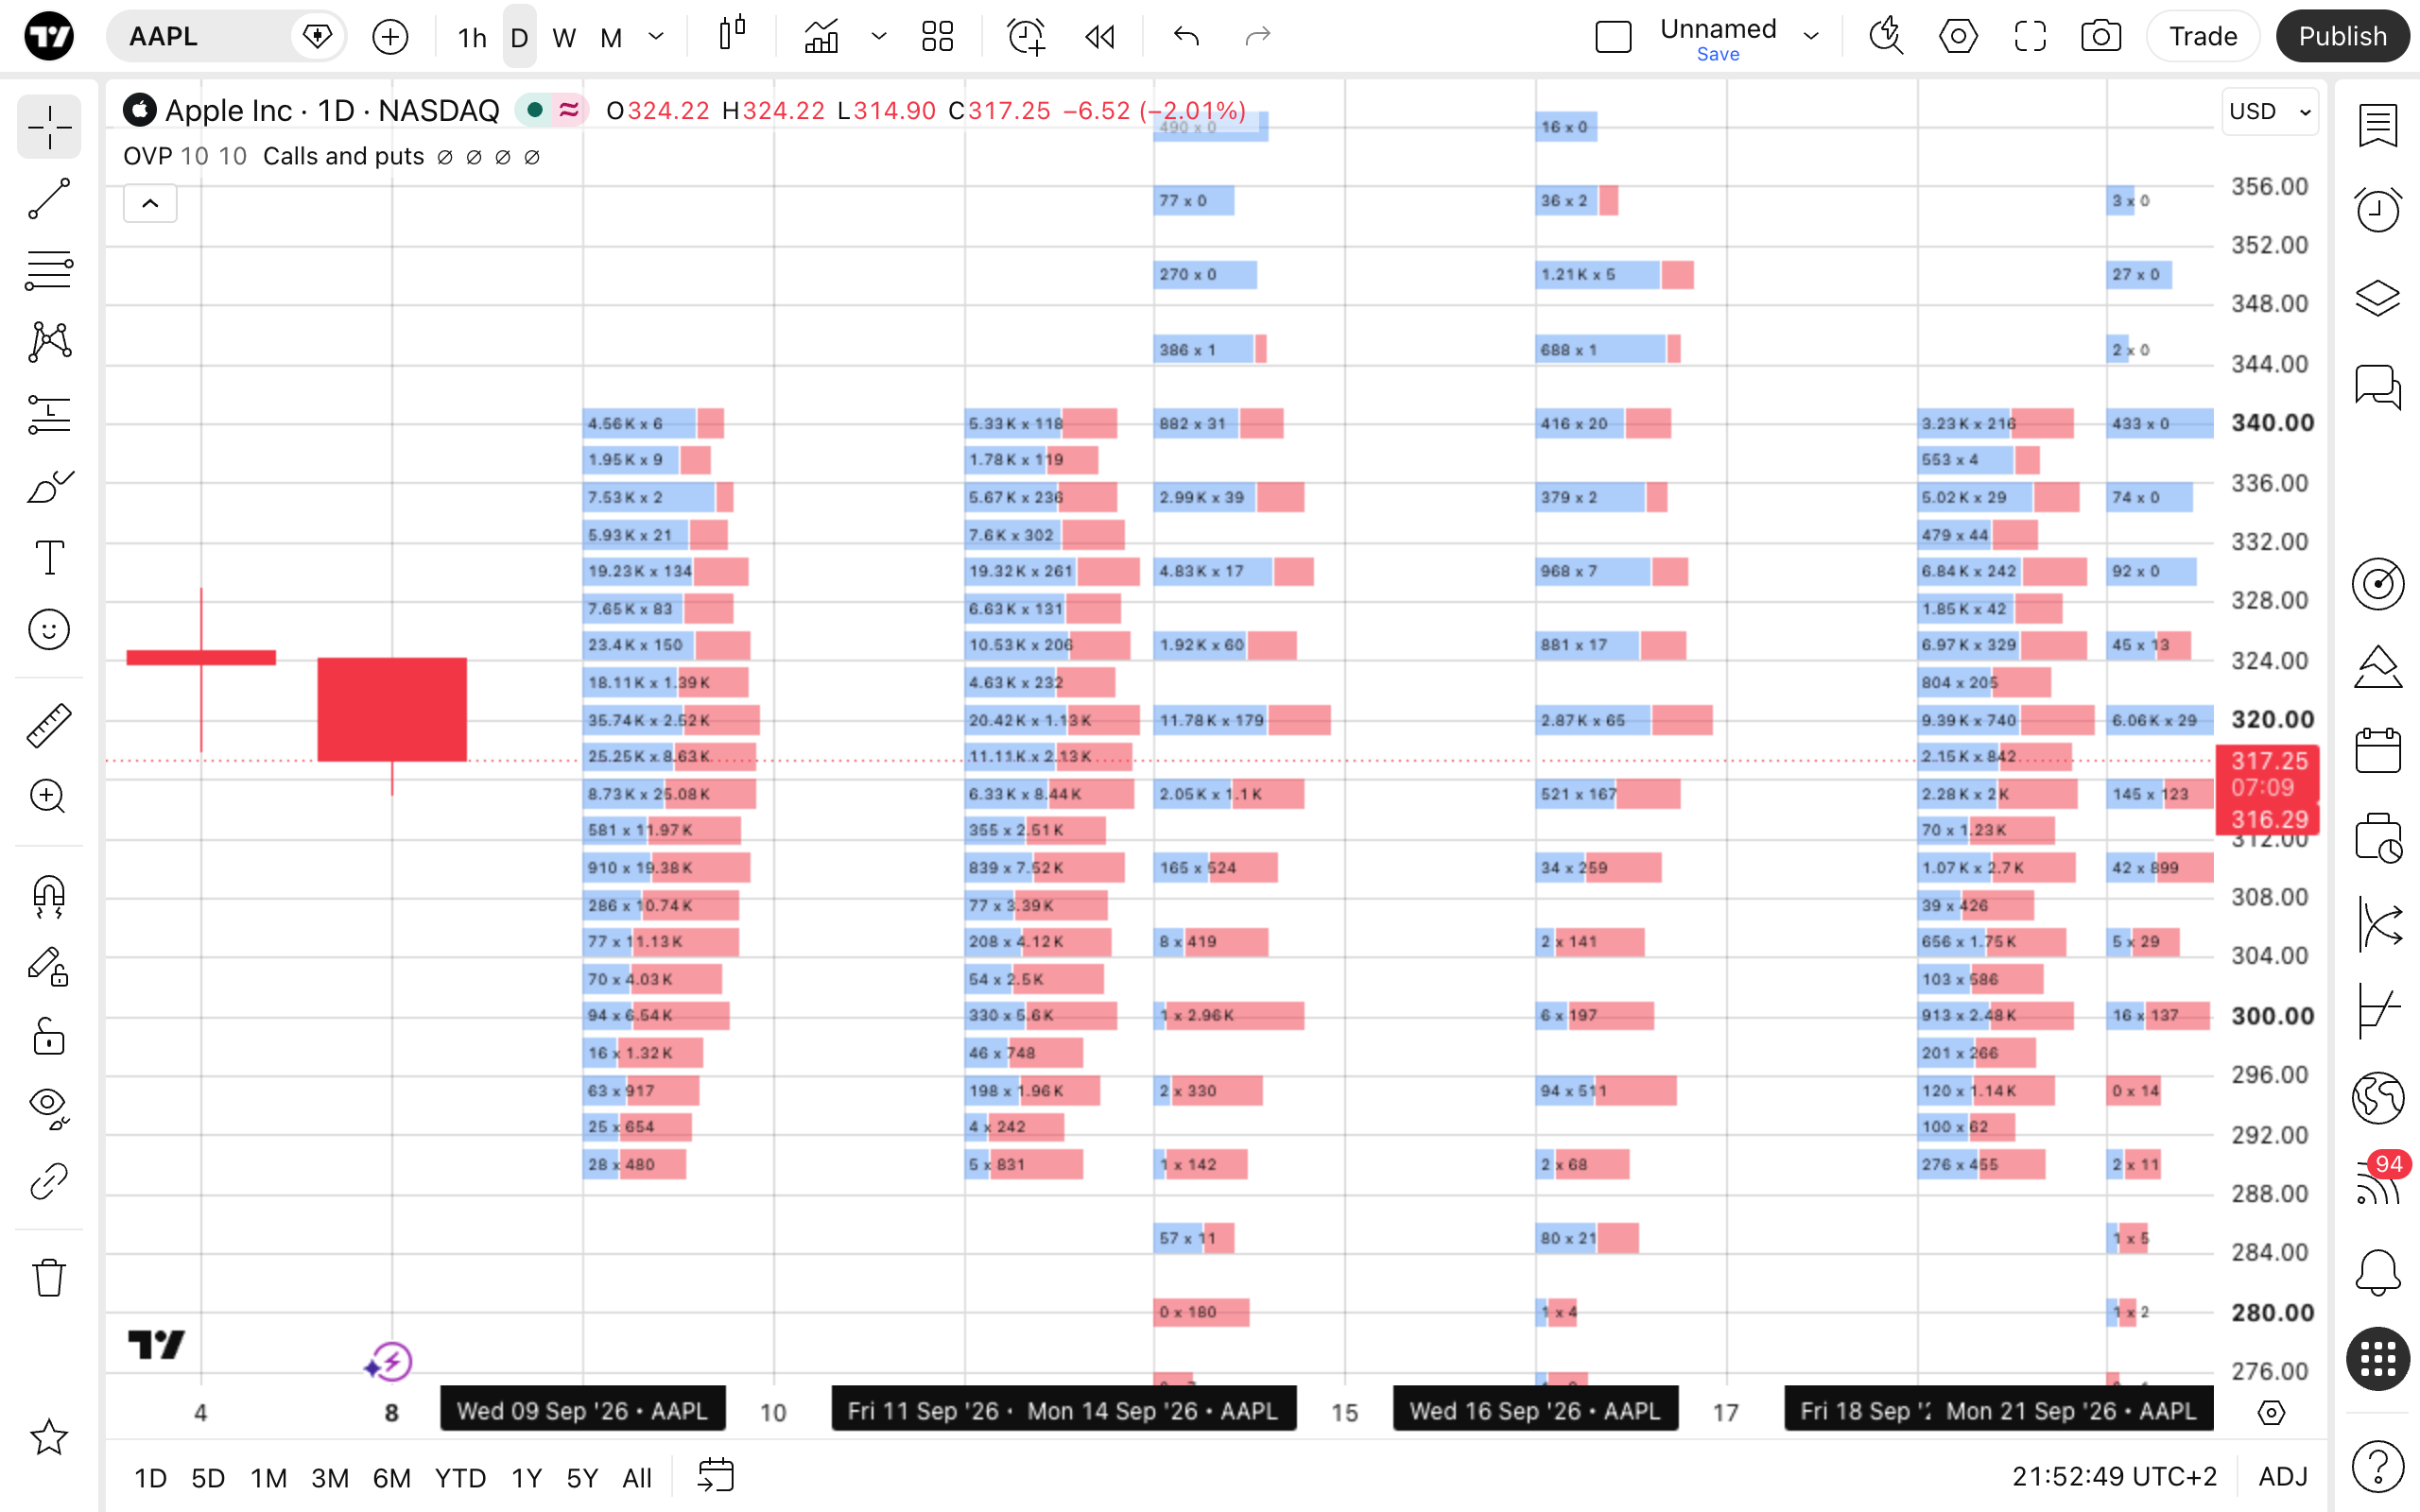
Expiration dates are marked on the time scale together with the underlying symbol, so you can quickly tell which profile belongs to which expiration. The dotted line at the current price helps you see which strikes are in the money and which are out of the money.
Inputs
Open the indicator settings by double-clicking the status line or clicking the gear icon next to it. On the Inputs tab, you can configure how much data is displayed.
- Max expirations — the number of upcoming expirations to display, counted from the nearest one. The default value is 10.
- ±Strikes around current price — how many strikes to display above and below the current price of the underlying asset. The default value is 10. Increasing this value reveals far out-of-the-money strikes, which is useful for spotting large positions far from the current price.
- Group by — groups expirations into larger periods instead of showing each one separately. When set to None, each expiration is plotted individually.
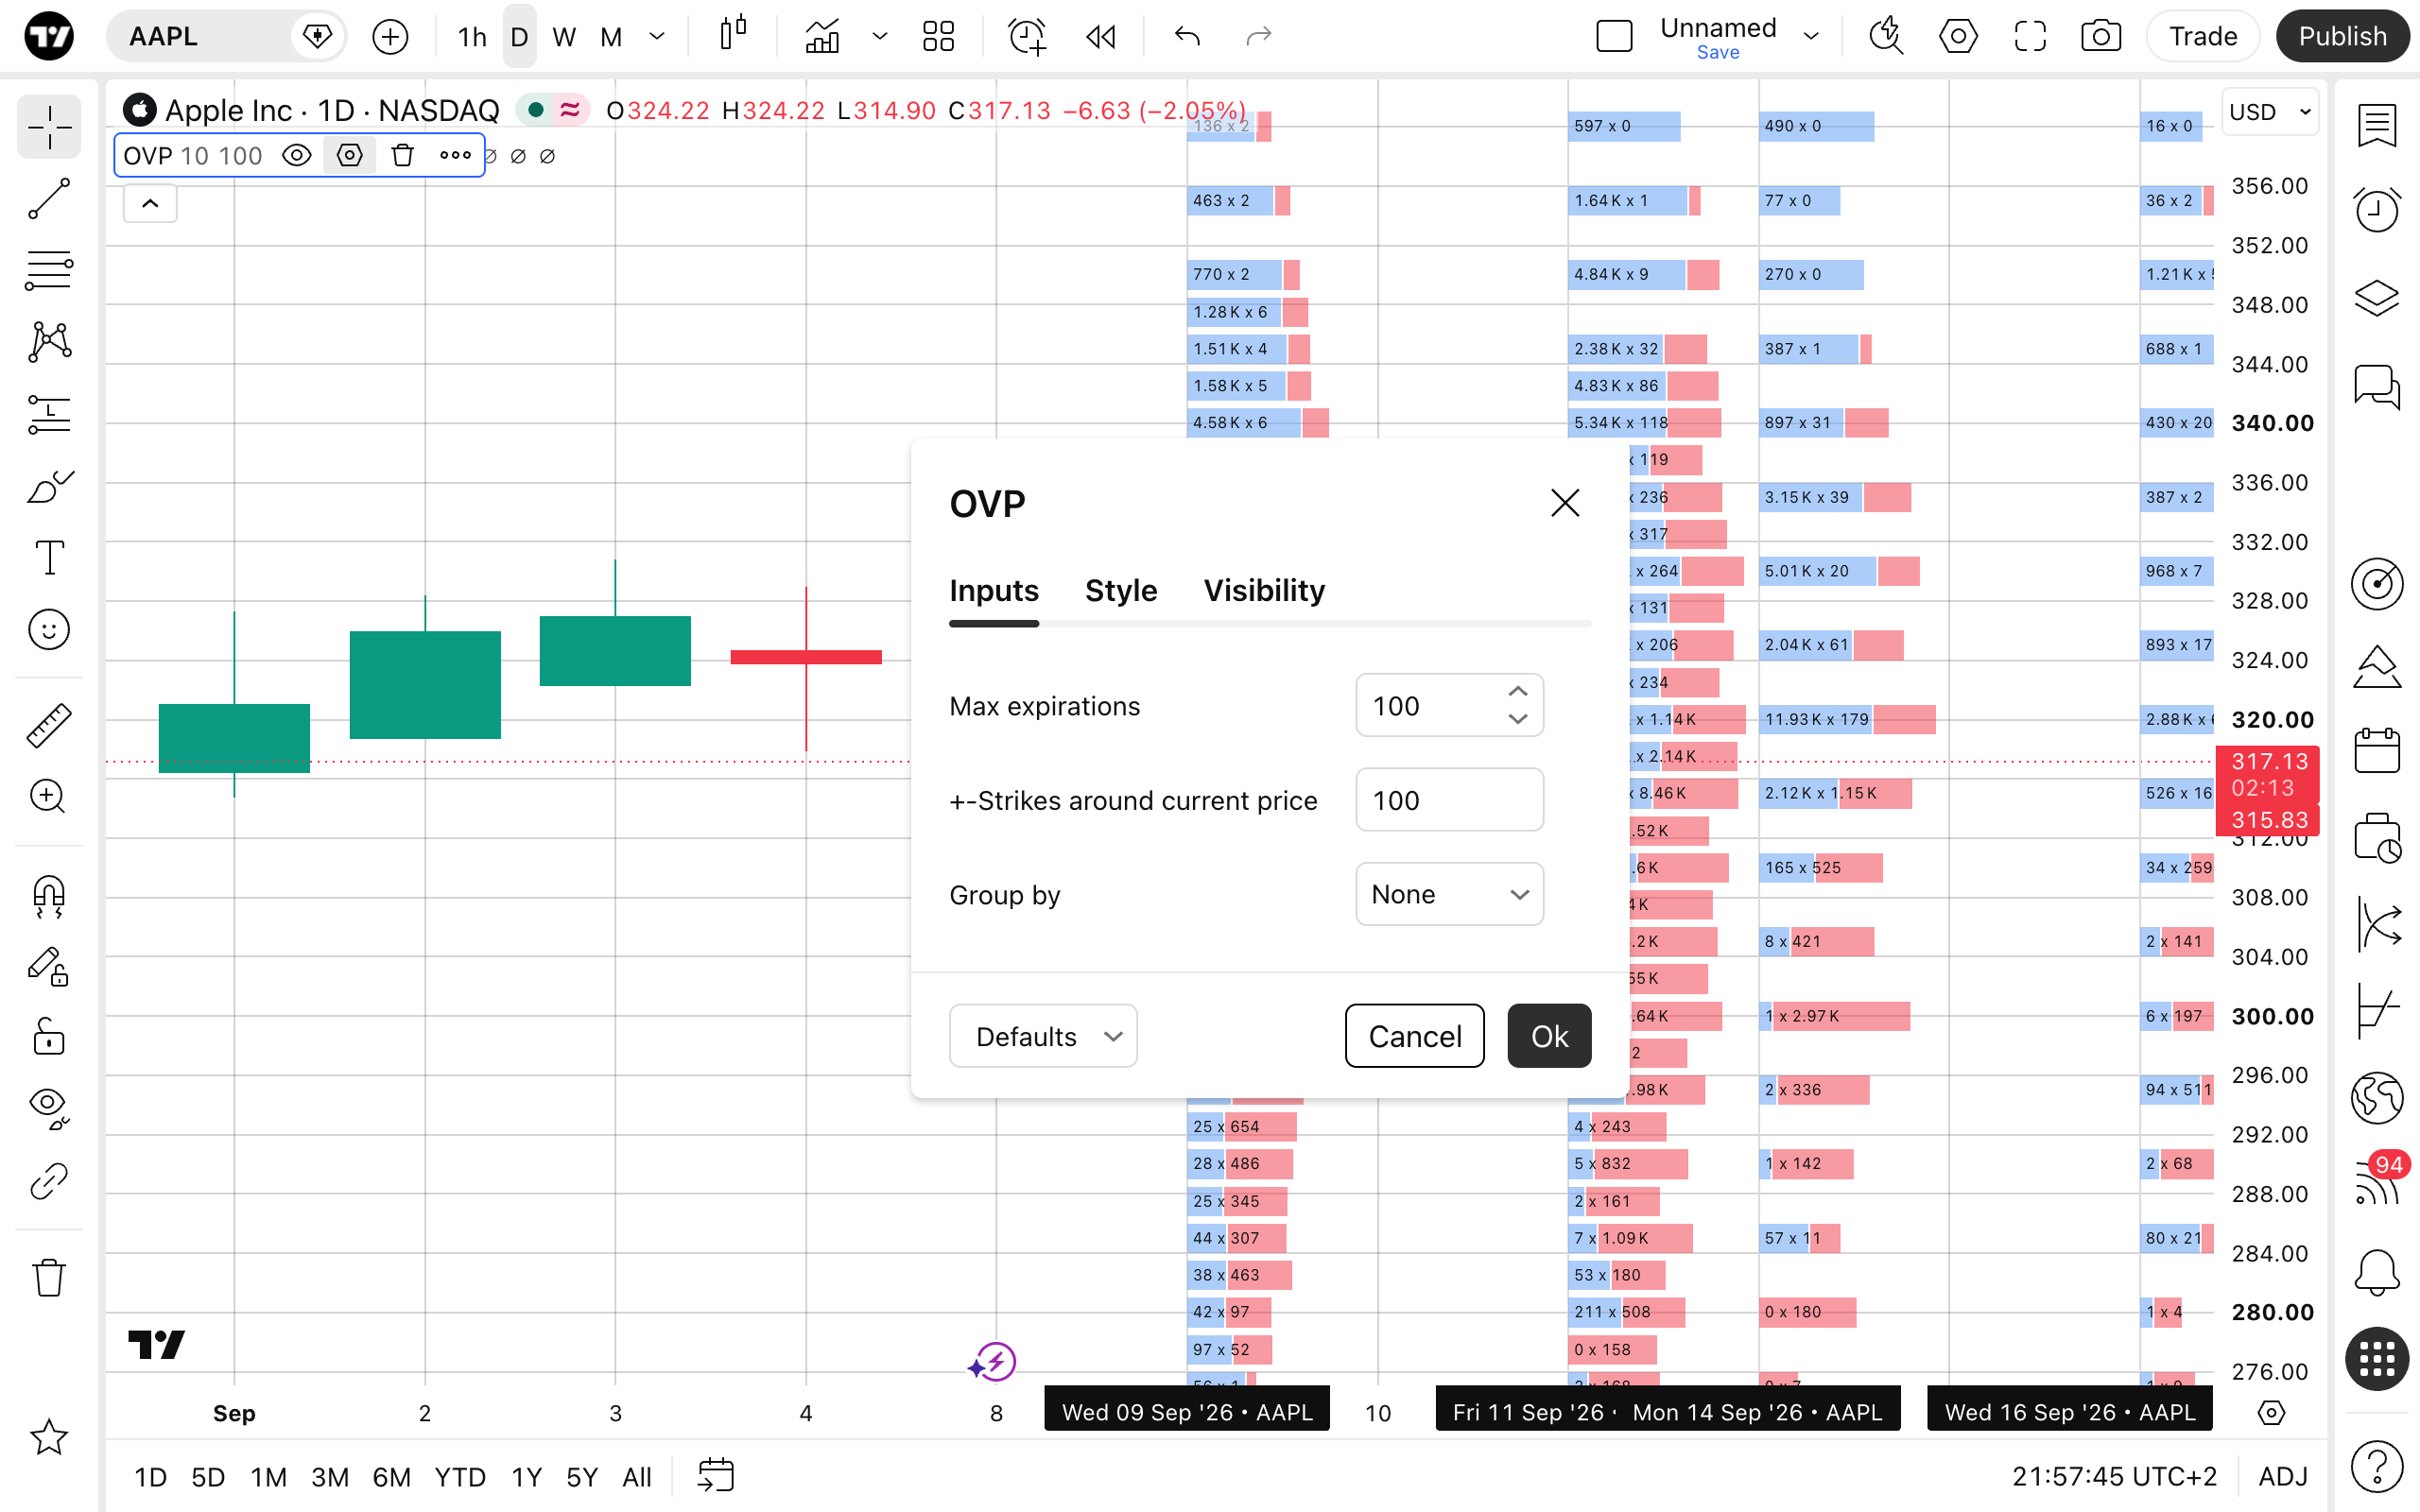
Higher values for expirations and strikes show a broader picture, but the profiles become denser. For a detailed view of the nearest expirations, keep the values low; to see the overall shape of positioning, increase them.

Style
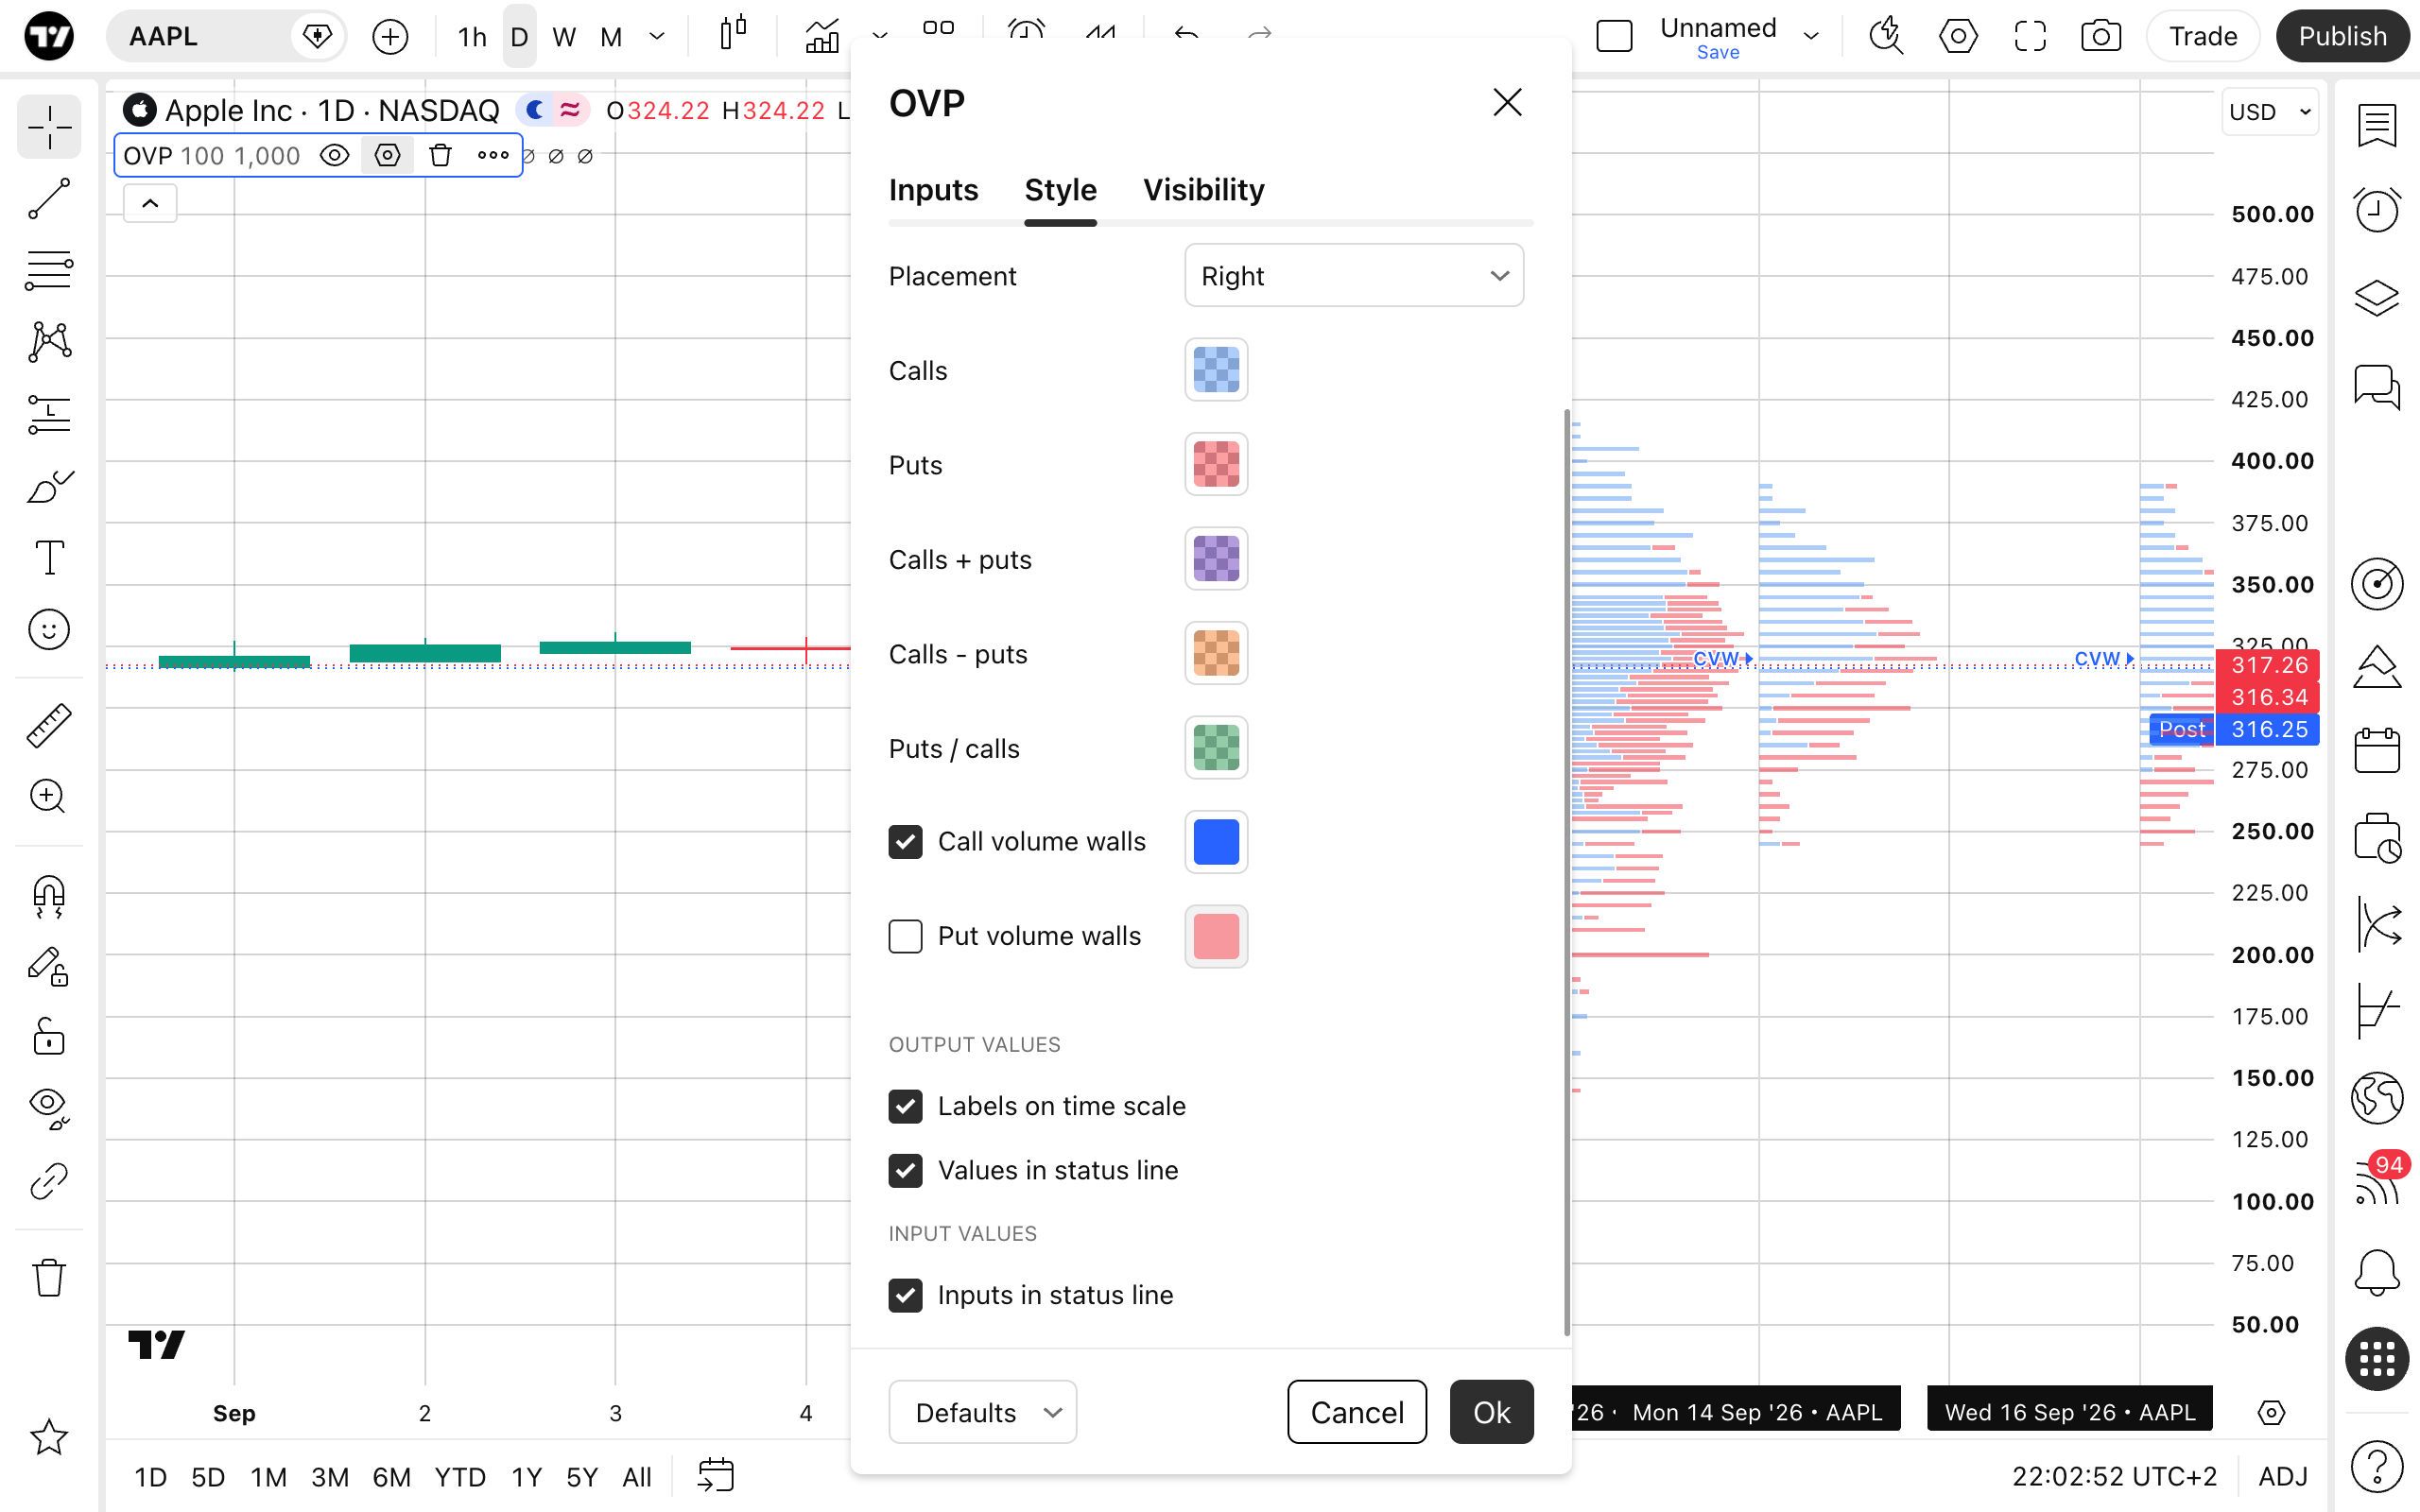
On the Style tab, you can control what the indicator shows and how it looks.
- Values — turns the numeric labels next to the bars on or off and sets their color.
- Display— selects the display mode:
- Calls and puts — call and put volume are plotted as separate bars.
- Calls + puts — total volume of calls and puts at each strike.
- Calls − puts — the difference between call and put volume, highlighting strikes where one side dominates.
- Puts / calls — the put/call ratio at each strike.
- Placement — determines on which side of the expiration date the profile is plotted.
- Calls, Puts, Calls + puts, Calls − puts, Puts / calls — colors of the bars for each display mode.
- Call volume walls and Put volume walls — highlight the strikes with the maximum volume for each expiration (see below).
In the Output values and Input values sections, you can choose whether to show expiration labels on the time scale and whether to display output values and inputs in the status line.
Call and put volume walls
A volume wall is the strike with the highest call or put volume for a given expiration. Such strikes often act as reference levels: heavy call volume above the current price may indicate where traders expect resistance or are selling covered calls, while heavy put volume below the price often marks the levels where hedges are concentrated.
To highlight these levels, enable Call volume walls and/or Put volume walls on the Style tab. For each expiration, the indicator marks the strike with the largest call volume and the strike with the largest put volume, so you can see at a glance where the bulk of activity is concentrated and how it shifts from one expiration to the next.
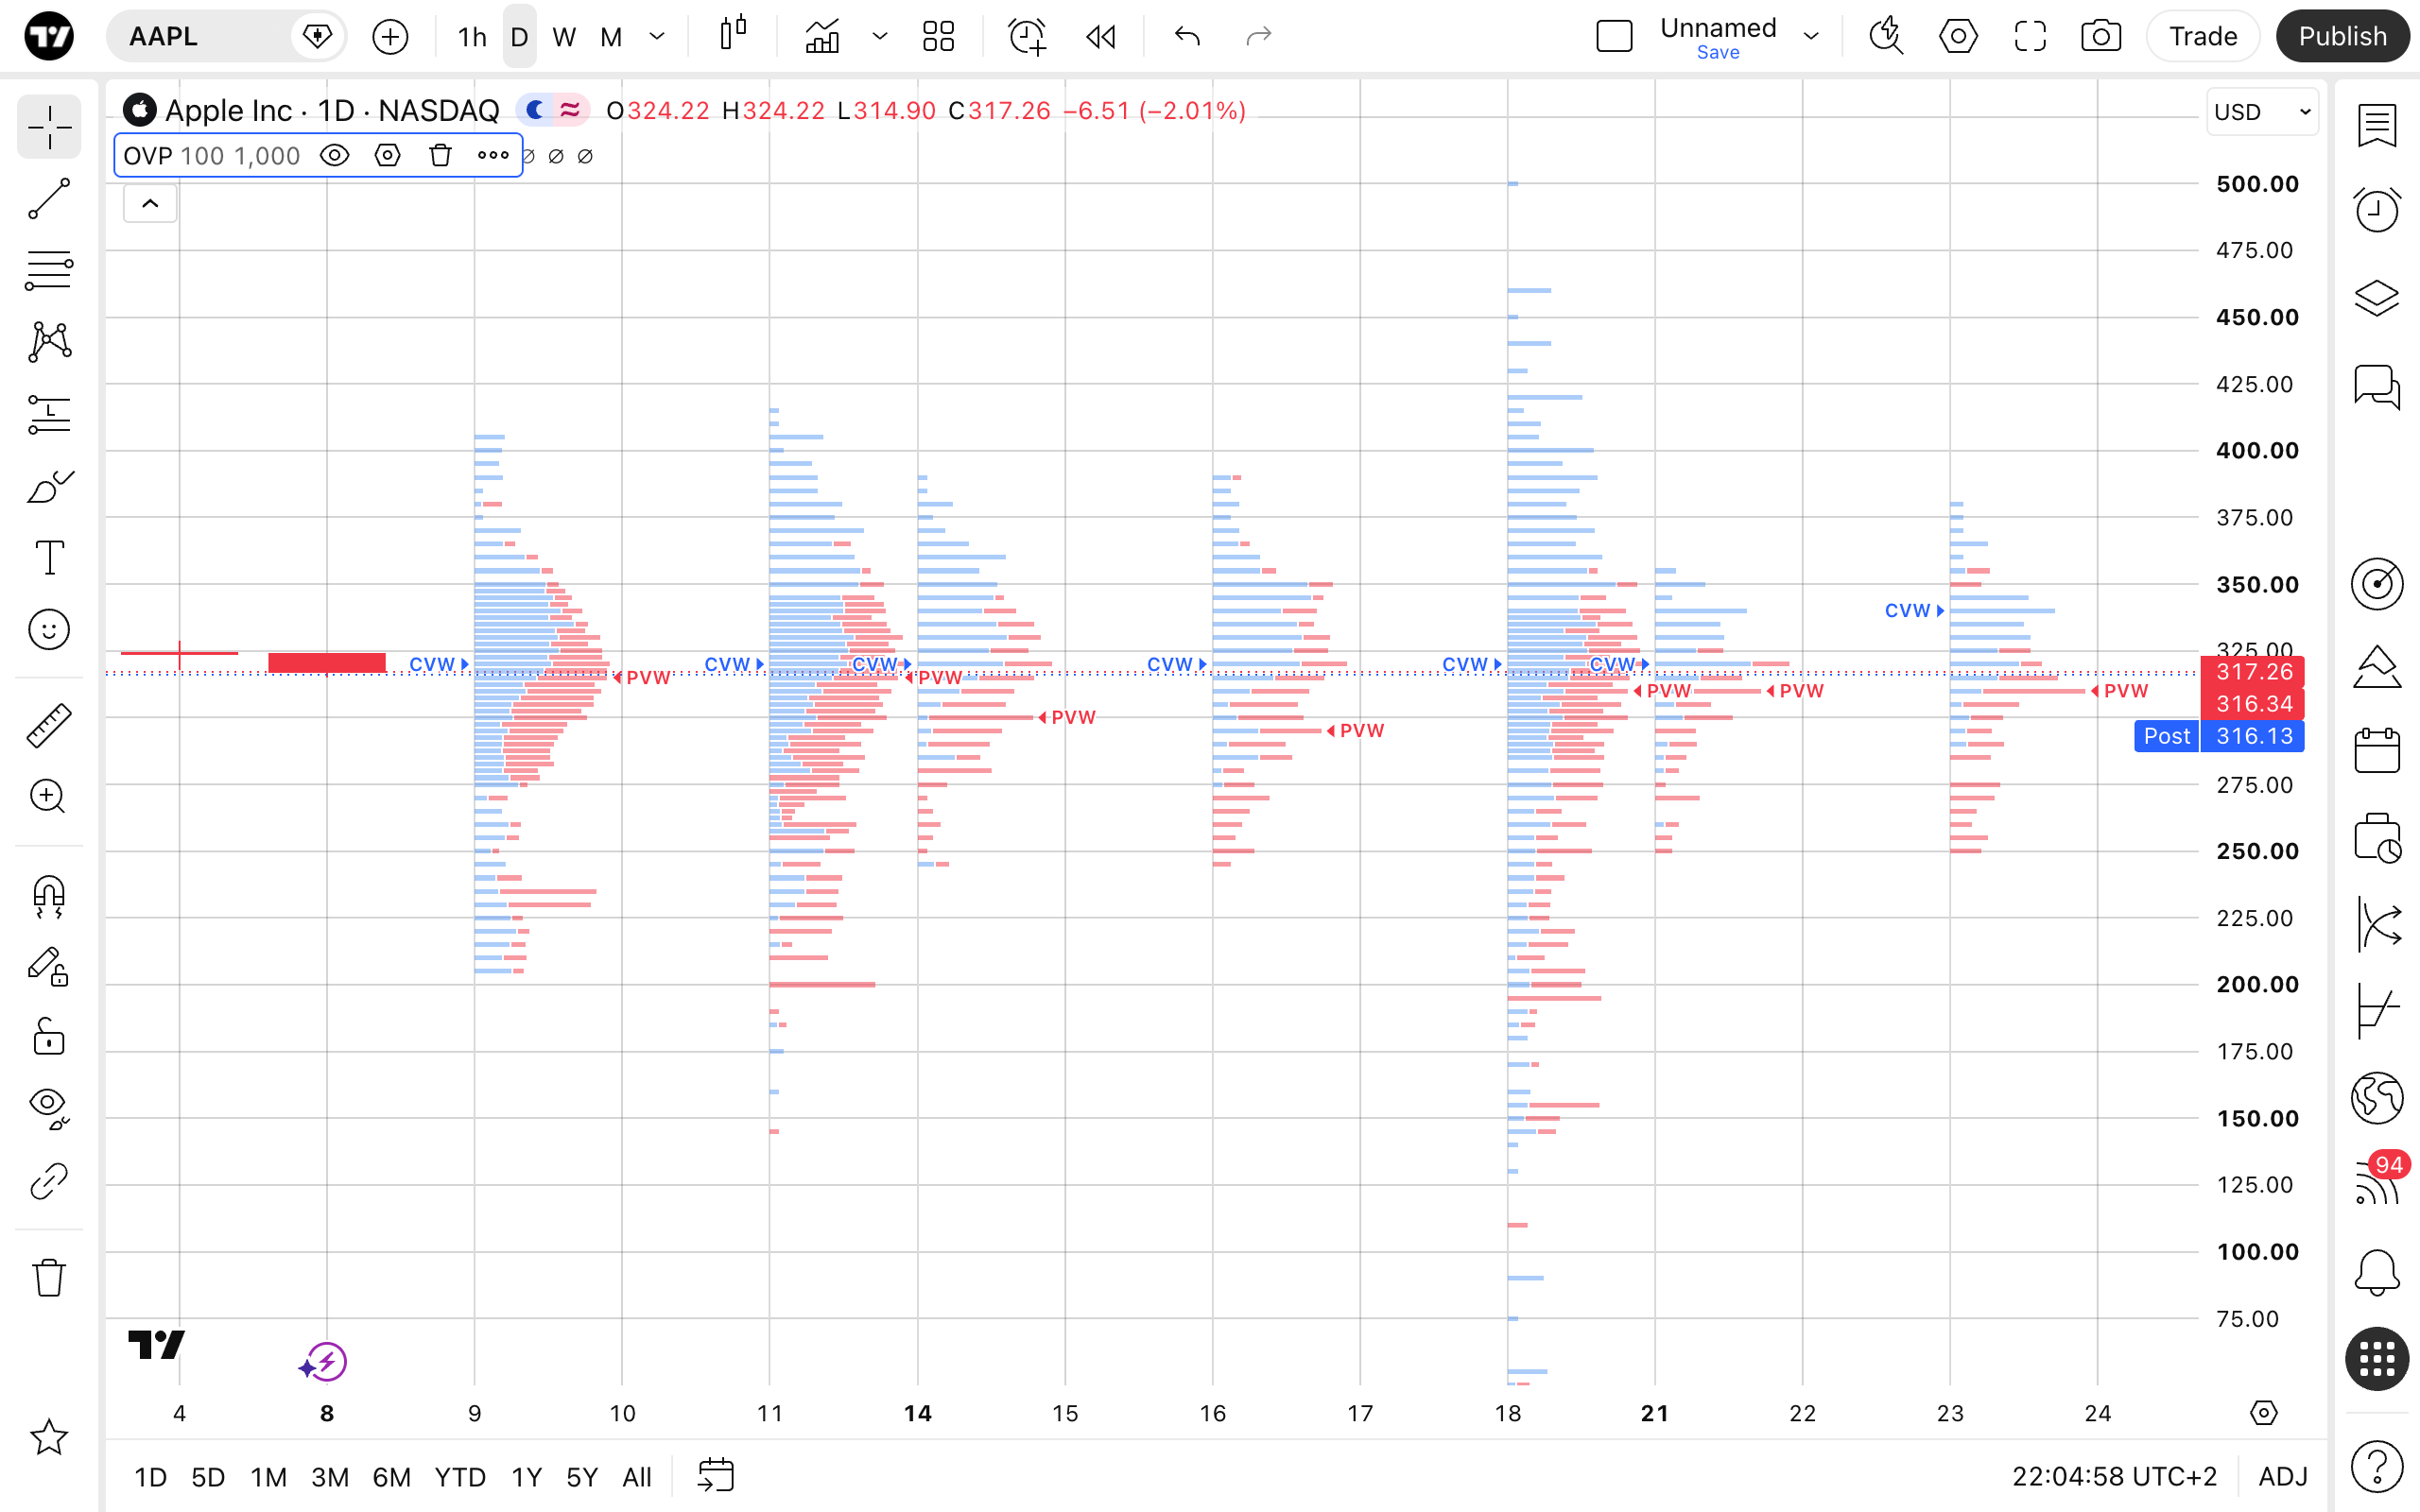
You can combine volume walls with any display mode and adjust the number of expirations and strikes to focus on the levels that matter for your trading horizon.