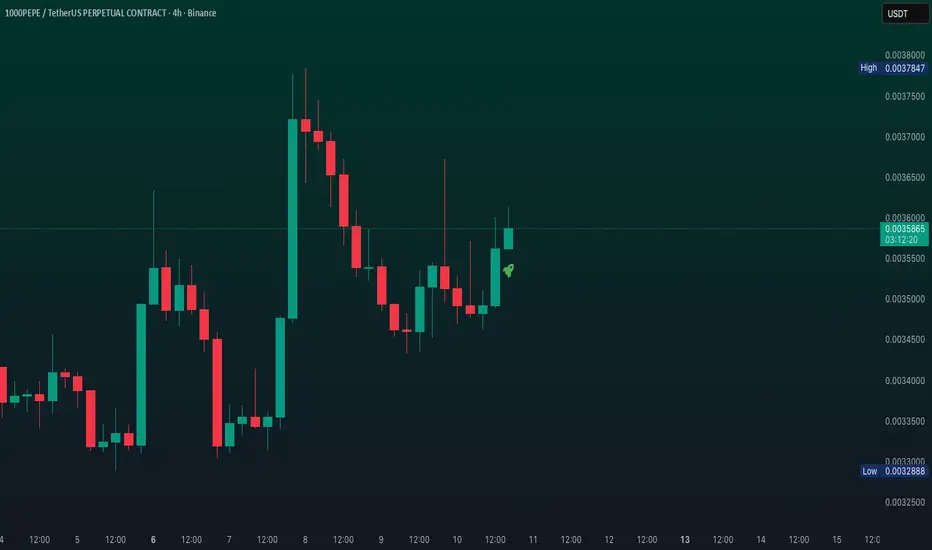
#1000PEPE Possible Scenario Medium-Term Trend: Prior to the current candle structure, price was moving within a short-term uptrend inside an ascending channel that originated from the early July low around 0.0022280.
Short-Term Trend: Bearish / Reversal. Price has recently broken below the lower trendline of the ascending cha
1000PEPE/USD TETHER PERPETUAL SWAP CONTRACT
No trades
No trades
PepeMatthew 21:42 — "Jesus saith unto them, Did ye never read in the scriptures, The stone which the builders rejected, the same is become the head of the corner: this is the Lord's doing, and it is marvellous in our eyes?"
PEPE — the jest. The meme despised by the serious ones.
The builders rejected it
PEPE Ready for Breakout? PEPE is showing signs of strength as price continues to compress beneath a key resistance level while respecting an ascending trendline, forming a classic ascending triangle on the 1-hour timeframe. This pattern typically reflects increasing buying pressure, as buyers continue stepping in at higher
PEPE IN GENERATIONAL OPPORTUNITY ZONECRYPTOCAP:PEPE Buyers are defending support aggressively, showing selling pressure is fading as price stabilizes. Momentum is quietly building near the demand zone
Bulls are slowly reclaiming control 📈🔥 A confirmed breakout above resistance could trigger fresh buying momentum and spark the next le
PEPE WILL LEAD NEXT MEMESEASON🔥 Fortune AI Radar — CRYPTOCAP:PEPE
Fresh activity detected on CRYPTOCAP:PEPE today.
Data suggests increasing market interest & buyers stepping in.
Technicals currently lean bullish, with momentum trending upward.
Whales showing hints of accumulation and hype rising among trader
Pepe (PEPE): Expecting Slight Bounce | Bullish MomentumPEPE is showing strong bullish momentum right now, with RSI pushing into the overbought zone. That usually tells us we’re getting close to either a rejection or a sideways pause, not an instant top.
The zone we’re watching sits right around the start of the previous “doomsday dip.” That area acted
#PEPE#PEPE has broken out of a falling wedge pattern and is consolidating 💡 near the breakout level. The falling wedge is a bullish pattern 🐂 that suggests a potential trend reversal. The next target for #PEPE is around 0.0036800 which is the previous high.
A breakout from a falling wedge can be a stron
Pepe (PEPE): Expecting a Bounce From SupportPEPE is sitting right on top of a strong support zone that has repeatedly acted as a key bounce area in the past. As long as this level holds, we can expect another potential bounce to play out from here.
If buyers manage to step back in and defend this region, we could see a short-term recovery mo
Pepe (PEPE): Expecting Bounce To Happen | EMAs CollidedPEPE has been ranging tightly as the 100EMA and 200EMA collided, creating strong compression in price. We’ve seen candles bouncing from one side to another, with the range narrowing further each day.
This kind of structure often leads to an explosive move, and with price sitting in the current buy
See all ideas
Summarizing what the indicators are suggesting.
Oscillators
Neutral
SellBuy
Strong sellStrong buy
Strong sellSellNeutralBuyStrong buy
Oscillators
Neutral
SellBuy
Strong sellStrong buy
Strong sellSellNeutralBuyStrong buy
Summary
Neutral
SellBuy
Strong sellStrong buy
Strong sellSellNeutralBuyStrong buy
Summary
Neutral
SellBuy
Strong sellStrong buy
Strong sellSellNeutralBuyStrong buy
Summary
Neutral
SellBuy
Strong sellStrong buy
Strong sellSellNeutralBuyStrong buy
Moving Averages
Neutral
SellBuy
Strong sellStrong buy
Strong sellSellNeutralBuyStrong buy
Moving Averages
Neutral
SellBuy
Strong sellStrong buy
Strong sellSellNeutralBuyStrong buy
Displays a symbol's price movements over previous years to identify recurring trends.