1000SATS Downtrend vs Uptrend —The Bull Market Can Last YearsThis project started trading on Binance in December 2023, 2.5 years ago. Not ever did 1000SATSUSDT closed five consecutive weeks green during the downtrend. This event happened just now, last week, and this signals a change of trend.
1000SATSUSDT is about to close six consecutive weeks green for the first time ever on extremely high volume. The second highest volume week appeared last month.
Here comes the downtrend vs an uptrend.
You can see this chart with the linear scale and gain the perspective I just shared with you on the Sleepless AI (AIUSDT) publication. It shows a bottomed out project. It shows a transition period. It shows the start of a new market cycle.
This is all I wanted to show. The market can go down for years, 2.5 years in this case; the market can grow for years to come; 2 years, 3 years or more. Prepare for long-term growth.
Namaste.
1000SATS / Tether USD PERPETUAL CONTRACT
No trades
No trades
In-depth trading ideas
Did 1000SATS BOTTOM??I can imagine a lot of folks are down bad on this coin, but the price action lately has been looking primed up for a big move. hopefully this time, to the upside. only time will tell.
Major EMAs just shifted up to the bull side for the first time in the history of the coin on this chart. In My Opinion, This market has reset.
1000sats looks primed for take offThis token has been beaten badly, down over 90%. I can see how this looks like a bad investment if you got in last year, but things look like they are turning up for a reversal here. I'm loading up and waiting out this next leg to tp 1. levels are marked but harder to show in low time frames. this will be a multi-month play
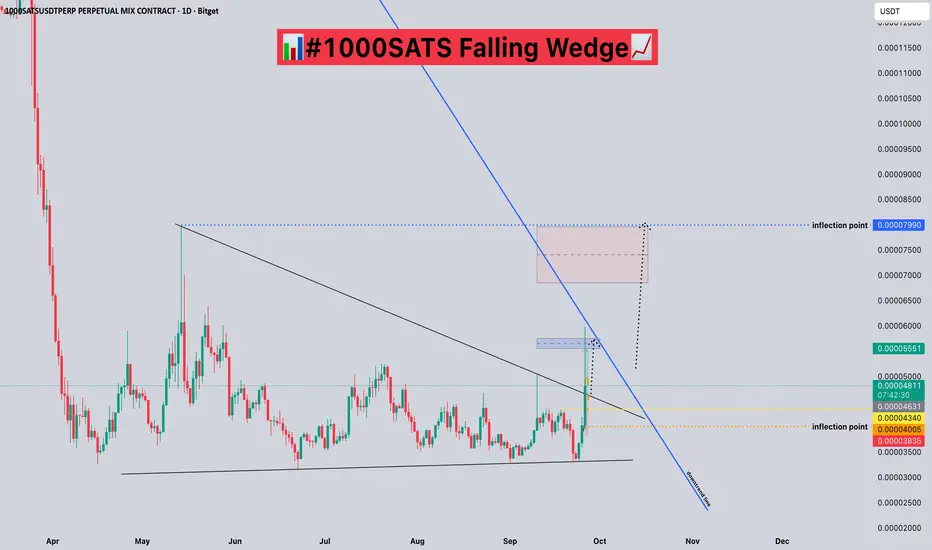
#1000SATS Falling Wedge📊#1000SATS Falling Wedge📈
🧠From a chart perspective, we've formed a falling wedge after a long period of consolidation at the bottom, a pattern we typically follow for upward movement. We've already broken through the upper edge of the wedge, and if we can hold above it, we might see a larger breakout.🚀
➡️From a structural perspective, a bullish double bottom has formed here, with the ideal target area yet to be reached, so we could experiment with some spot and futures trading.
🤜If you like my analysis, please like 💖 and share 💬
BITGET:1000SATSUSDT.P
1000SATSUSDT 1D#1000SATS has broken the descending triangle resistance with huge volume on the daily chart. It is currently trying to close the daily candle above the SMA200. Consider buying near the support zone, where the triangle may retest. The potential targets are:
🎯 $0.00006031
🎯 $0.00006850
🎯 $0.00007669
🎯 $0.00008835
🎯 $0.00010320
⚠️ Always remember to use a tight stop-loss and follow proper risk management.
1000SATSUSDT Forming Bullish Momentum1000SATSUSDT has recently shown signs of strength after breaking out of a prolonged consolidation phase. The chart pattern highlights a strong reversal structure forming, supported by healthy volume that adds weight to the bullish outlook. With technical indicators pointing toward upward momentum, this pair is shaping up for a potential breakout move. Based on the current setup, traders and investors could anticipate a gain in the range of 60% to 70%+, making it an attractive opportunity in the short to medium term.
The volume behavior further confirms investor participation, as we are seeing consistent buying pressure building up around key support levels. This kind of accumulation phase often precedes sharp upward moves, and with the breakout now in play, confidence in the trend continuation is growing. Such dynamics make 1000SATSUSDT a promising pick for those watching for undervalued setups in the crypto market.
Market sentiment is also becoming more favorable, with investors taking increasing interest in this project. If momentum continues to align with technicals, we could see significant upside potential play out in the coming weeks. The breakout structure and projected targets suggest that this coin may be gearing up for a major rally.
✅ Show your support by hitting the like button and
✅ Leaving a comment below! (What is You opinion about this Coin)
Your feedback and engagement keep me inspired to share more insightful market analysis with you!
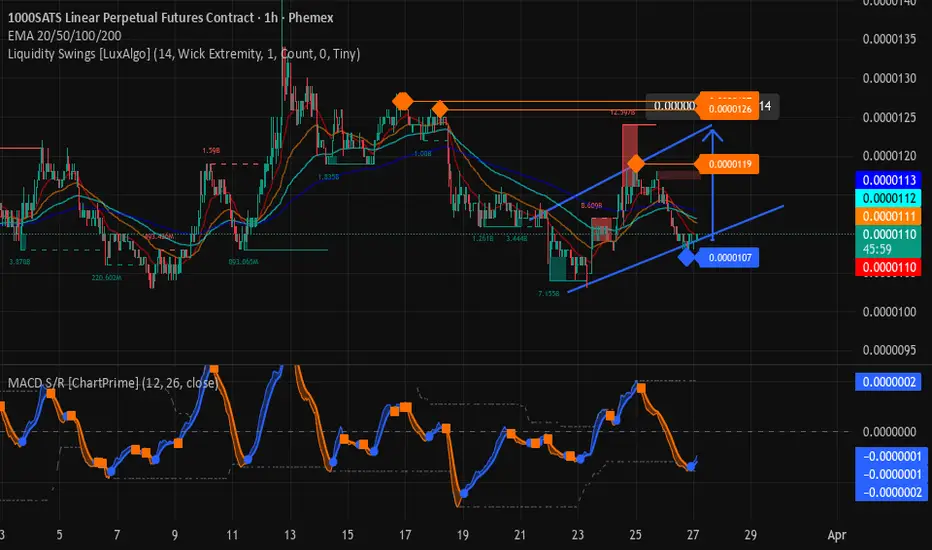
My Current Outlook on 1000SATS Price fell out of the bullish structure after a huge dump coming off of another recent lower high. So far it looks like the price respected the retest area of the raising broadening wedge, but, this asset is known to fake out traders in both directions, although, early shorts at the previous high still looks safe for a full retest of that take profit area at take profit 4, if not all the way down to take profit 5
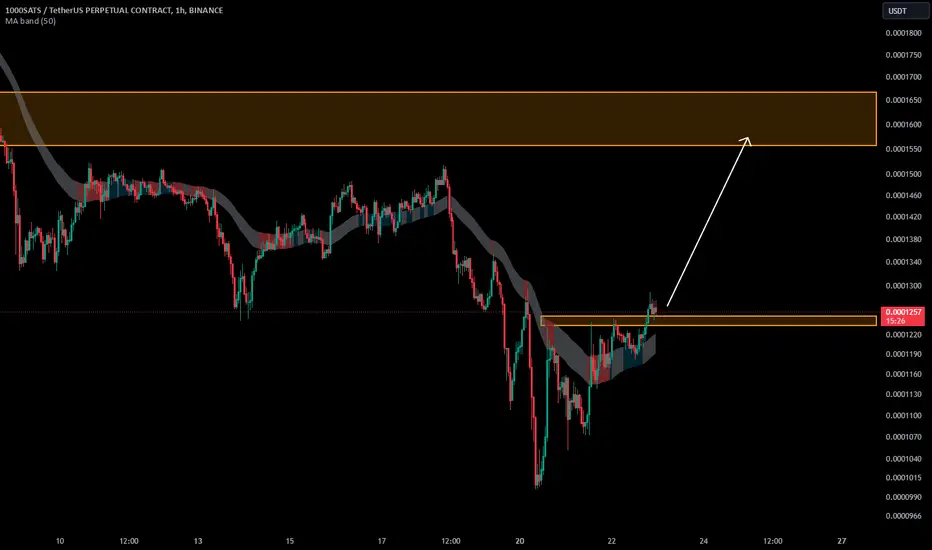
SATS Buy/Long Setup (1H)Given the bullish structure, the formation of bullish BOS (Break of Structure), the preservation of the trendline, and the absence of any significant supply zone in front of the candles, we can consider entering this setup with proper risk and capital management.
The targets are marked on the chart. If the stop-loss is hit, it will indicate the invalidation of this trade and the position should be closed accordingly.
Do not enter the position without capital management and stop setting
Comment if you have any questions
thank you
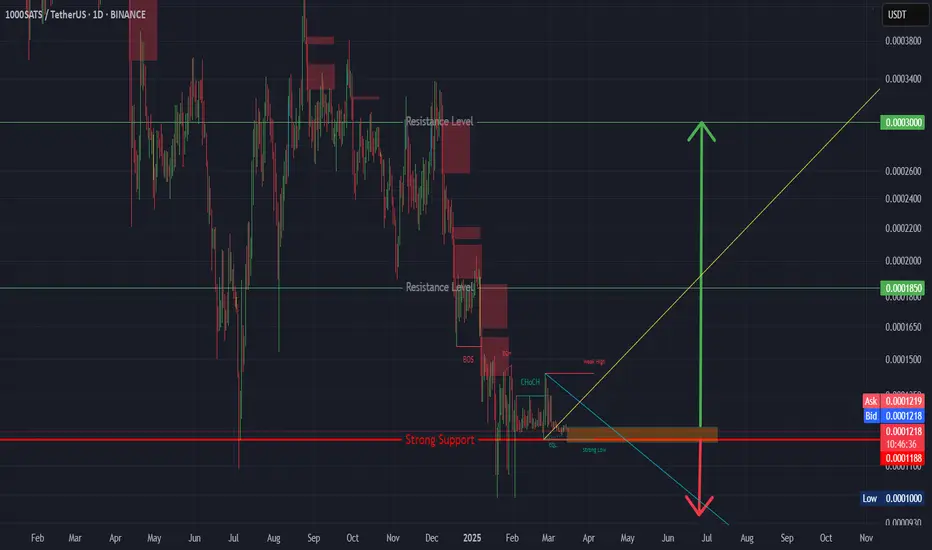
1000SATS/USDT (Binance - 1D Chart)📍 Timeframe: 1D (Binance Exchange)
📈 Current Price: 0.0001268 (+1.93%)
Key Technical Insights:
Accumulation & Breakout Setup:
Price has been consolidating at a low volatility range for several weeks.
Potential breakout setup is forming, as indicated by the bullish structure.
Support & Resistance Levels:
Support: 0.0000950 (Stop-loss region)
Current Resistance: 0.0001271 (Breakout Level)
Major Target: 0.0004000 (Upside target)
Risk-to-Reward Setup:
A clear risk-to-reward setup is visible on the chart.
Stop-loss placed below 0.0000950, targeting 0.0004000.
Risk/Reward Ratio: ~3.5:1 (High reward potential).
Open Interest Analysis:
Open Interest (OI) surged significantly before showing a slight decline.
A decline in OI while price remains stable suggests short liquidations or weak hands exiting before a potential move.
Trading Strategy:
Bullish Entry: Long positions above 0.0001271 with a stop below 0.0000950.
Breakout Confirmation: A daily close above 0.0001300 strengthens bullish sentiment.
Profit Targets:
First Target: 0.0002500
Second Target: 0.0004000
1000SATS1000SATS / USDT
1D time frame
analysis tools
____________
SMC
FVG
Trend lines
Fibonacci
Support & resistance
MACD Cross
EMA Cross
______________________________________________________________
Golden Advices.
********************
* Please calculate your losses before any entry.
* Do not enter any trade you find it not suitable for you.
* No FOMO - No Rush , it is a long journey.
Useful Tags.
****************
My total posts
www.tradingview.com
1000SATS/USDTKey Level Zone: 0.0001235 - 0.0001250
HMT v4.1 detected. The setup looks promising, supported by a previous upward/downward trend with increasing volume and momentum, presenting an excellent reward-to-risk opportunity.
HMT (High Momentum Trending):
HMT is based on trend, momentum, volume, and market structure across multiple timeframes. It highlights setups with strong potential for upward movement and higher rewards.
Whenever I spot a signal for my own trading, I’ll share it. Please note that conducting a comprehensive analysis on a single timeframe chart can be quite challenging and sometimes confusing. I appreciate your understanding of the effort involved.
Important Note :
Role of Key Levels:
- These zones are critical for analyzing price trends. If the key level zone holds, the price may continue trending in the expected direction. However, momentum may increase or decrease based on subsequent patterns.
- Breakouts: If the key level zone breaks, it signals a stop-out. For reversal traders, this presents an opportunity to consider switching direction, as the price often retests these zones, which may act as strong support-turned-resistance (or vice versa).
My Trading Rules
Risk Management
- Maximum risk per trade: 2.5%.
- Leverage: 5x.
Exit Strategy
Profit-Taking:
- Sell at least 70% on the 3rd wave up (LTF Wave 5).
- Typically, sell 50% during a high-volume spike.
- Adjust stop-loss to breakeven once the trade achieves a 1.5:1 reward-to-risk ratio.
- If the market shows signs of losing momentum or divergence, ill will exit at breakeven.
The market is highly dynamic and constantly changing. HMT signals and target profit (TP) levels are based on the current price and movement, but market conditions can shift instantly, so it is crucial to remain adaptable and follow the market's movement.
If you find this signal/analysis meaningful, kindly like and share it.
Thank you for your support~
Sharing this with love!
HMT v2.0:
- Major update to the Momentum indicator
- Reduced false signals from inaccurate momentum detection
- New screener with improved accuracy and fewer signals
HMT v3.0:
- Added liquidity factor to enhance trend continuation
- Improved potential for momentum-based plays
- Increased winning probability by reducing entries during peaks
HMT v3.1:
- Enhanced entry confirmation for improved reward-to-risk ratios
HMT v4.0:
- Incorporated buying and selling pressure in lower timeframes to enhance the probability of trending moves while optimizing entry timing and scaling
HMT v4.1:
- Enhanced take-profit (TP) target by incorporating market structure analysis
1000SATS/USDTKey Level Zone: 0.0001205 - 0.0001215
HMT v4.1 detected. The setup looks promising, supported by a previous upward/downward trend with increasing volume and momentum, presenting an excellent reward-to-risk opportunity.
HMT (High Momentum Trending):
HMT is based on trend, momentum, volume, and market structure across multiple timeframes. It highlights setups with strong potential for upward movement and higher rewards.
Whenever I spot a signal for my own trading, I’ll share it. Please note that conducting a comprehensive analysis on a single timeframe chart can be quite challenging and sometimes confusing. I appreciate your understanding of the effort involved.
Important Note :
Role of Key Levels:
- These zones are critical for analyzing price trends. If the key level zone holds, the price may continue trending in the expected direction. However, momentum may increase or decrease based on subsequent patterns.
- Breakouts: If the key level zone breaks, it signals a stop-out. For reversal traders, this presents an opportunity to consider switching direction, as the price often retests these zones, which may act as strong support-turned-resistance (or vice versa).
My Trading Rules
Risk Management
- Maximum risk per trade: 2.5%.
- Leverage: 5x.
Exit Strategy
Profit-Taking:
- Sell at least 70% on the 3rd wave up (LTF Wave 5).
- Typically, sell 50% during a high-volume spike.
- Adjust stop-loss to breakeven once the trade achieves a 1.5:1 reward-to-risk ratio.
- If the market shows signs of losing momentum or divergence, ill will exit at breakeven.
The market is highly dynamic and constantly changing. HMT signals and target profit (TP) levels are based on the current price and movement, but market conditions can shift instantly, so it is crucial to remain adaptable and follow the market's movement.
If you find this signal/analysis meaningful, kindly like and share it.
Thank you for your support~
Sharing this with love!
HMT v2.0:
- Major update to the Momentum indicator
- Reduced false signals from inaccurate momentum detection
- New screener with improved accuracy and fewer signals
HMT v3.0:
- Added liquidity factor to enhance trend continuation
- Improved potential for momentum-based plays
- Increased winning probability by reducing entries during peaks
HMT v3.1:
- Enhanced entry confirmation for improved reward-to-risk ratios
HMT v4.0:
- Incorporated buying and selling pressure in lower timeframes to enhance the probability of trending moves while optimizing entry timing and scaling
HMT v4.1:
- Enhanced take-profit (TP) target by incorporating market structure analysis
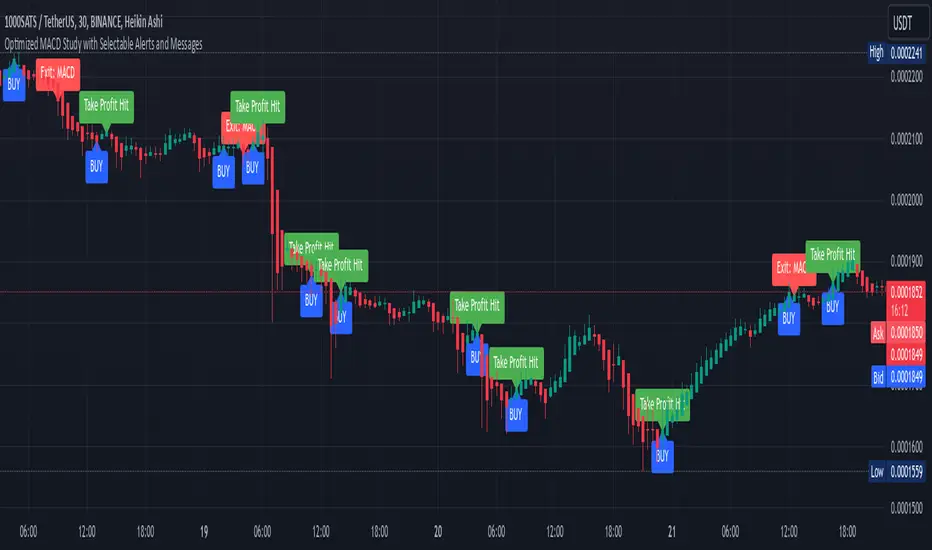
Optimized MACD Study with AlertsThis Pine Script study enhances the classic MACD indicator with additional functionality, making it a powerful tool for traders who want actionable and visually intuitive signals on their charts. It is designed to help traders identify BUY and SELL opportunities with customizable alerts, along with visual labels for better chart interpretation.
Key Features:
Customizable MACD Settings:
Users can adjust the Fast EMA, Slow EMA, and Signal Smoothing parameters to fit their specific trading strategies and preferences.
Take Profit Logic:
The script includes a take profit mechanism that tracks price movement after a BUY signal and highlights when the target is achieved.
Visual labels ("Take Profit Hit") make it easier to track price performance directly on the chart.
Visual Signals:
BUY signals are labeled clearly on the chart when the MACD line crosses above the Signal line.
SELL signals appear either when the take profit is hit or when the MACD line crosses below the Signal line, making it easy to interpret market conditions at a glance.
Dynamic Alerts:
Selectable alerts are included for both BUY and SELL signals, allowing traders to stay informed in real-time without constant monitoring.
Alerts dynamically display the symbol, time, price, and reason for the alert (e.g., BUY Signal or SELL Signal due to Take Profit or MACD Exit).
User-Friendly and Flexible:
This study is versatile and suitable for different asset classes and timeframes, from cryptocurrencies to stocks or forex.
Clear visual annotations and dynamic alert messages make it beginner-friendly yet powerful enough for experienced traders.
How to Use:
Attach the script to your preferred chart and timeframe, adjust the MACD settings as needed, and set up alerts using the "BUY Alert" and "SELL Alert" conditions in the TradingView alert system. The custom alert messages provide key details, such as the symbol, time, and current price, helping traders respond quickly to opportunities.
This script is ideal for those looking to enhance their trading strategy with actionable insights and automated notifications. Whether you're day trading or swing trading, the Optimized MACD Study provides a robust framework for informed decision-making.
1000Sats / USDT : Poised for a breakout from middle support 1000SATS/USDT: Poised for a Breakout from Middle Support
1000SATS/USDT is showing promising signs 📈 as it holds firmly at a key middle support zone 📊. The pair is building momentum, creating an ideal setup for a potential breakout 💥. If confirmed, this move could trigger a strong bullish rally 🚀. Stay vigilant 👀 and wait for the breakout confirmation before entering.
Key insights:
1. Middle support: 1000SATS/USDT is holding steady at this critical zone, showing resilience against further downside.
2. Volume watch: A significant surge in trading volume during the breakout will confirm the buyers’ strength 🔥.
3. Bullish indicators: Positive trends in RSI and MACD ⚡ support the likelihood of an upward breakout.
Steps to confirm the breakout:
Wait for a clear 4H or daily candle to close above the resistance level 📍.
Look for a noticeable volume spike, signaling strong buying interest 📊.
A successful retest of the resistance-turned-support will solidify the move ✅.
Be cautious of fakeouts, such as quick reversals or wicks ⚠️.
Risk management strategies:
Use stop-loss orders to protect your position 🔒.
Align position sizing with your overall risk strategy 🎯.
This analysis is for educational purposes only and not financial advice. Always DYOR 🔍 before making any trading decisions.