1000XEC | Downtrend Exhaustion → Accumulation → Expansion1000XEC | Downtrend Exhaustion → Accumulation → Expansion Potential 🚀
After a prolonged bearish phase marked by a clear descending trendline, price has finally shown signs of trend exhaustion and is transitioning into a potential reversal structure.
━━━━━━━━━━━━━━━
📊 Market Structure Breakdown
• Extended downtrend with consistent lower highs
• Strong respect of descending trendline resistance
• Price now forming a base near lows → signs of accumulation
• Early breakout attempt from compression zone
This behavior typically indicates:
→ Seller exhaustion
→ Liquidity absorption at lows
→ Early-stage reversal structure
━━━━━━━━━━━━━━━
💡 Key Levels to Watch
🔹 Breakout Level: 0.0086
→ First confirmation of strength
🔹 Mid Liquidity Zone: 0.0146
→ Previous structure / reaction level
🔹 Major Target Zone: 0.0324
→ High liquidity & strong resistance
━━━━━━━━━━━━━━━
🚀 Scenario Outlook
The projected path reflects a classic reversal expansion:
1. Reclaim and hold above breakout level
2. Build momentum toward mid-range liquidity
3. Accelerate into higher resistance zones
If momentum sustains, price could transition into a high-velocity expansion move .
━━━━━━━━━━━━━━━
⚠️ Invalidation
• Failure to hold above breakout level
• Breakdown below accumulation base
This would suggest continuation of the broader bearish structure.
━━━━━━━━━━━━━━━
🧠 Key Insight
This is not just a bounce — it’s a potential shift from:
Distribution → Accumulation → Expansion
Early breakout structures after prolonged downtrends often provide strong opportunities when confirmed.
━━━━━━━━━━━━━━━
📌 Conclusion
1000XEC is showing early signs of bottom formation and structural shift .
A confirmed breakout could unlock significant upside toward higher liquidity zones.
Watch the breakout — the move can be aggressive once confirmed.
1000XEC / TetherUS PERPETUAL CONTRACT
No trades
No trades
In-depth trading ideas
1000XEC/USDT 15m SETUP. 1000XEC/USDT | 15min Setup
Price broke structure to the upside and created a Bullish Order Block + FVG as Point of Interest (POI).
Currently retracing toward demand zone at 0.01980–0.01995.
🟢 Plan:
Wait for price to tap POI → look for bullish confirmation (engulfing or CHoCH) to enter long.
📌 Textbook Smart Money entry setup.
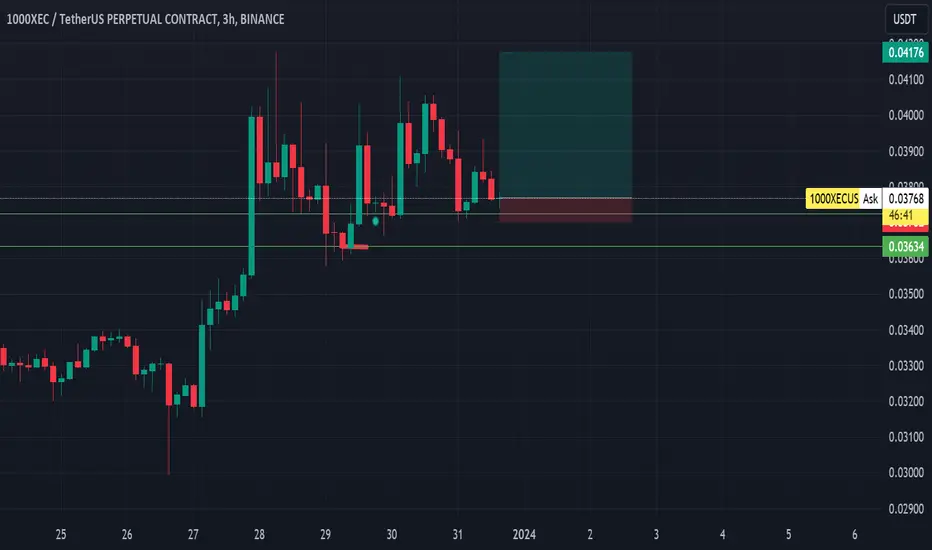
XEC pump over?We've got a late aggressive Fbuy which couldn't do the trend continuation. the Fbuy trigger is peak activity happening in volatile crypto. After the Fbuy you have either the trend continuation or the reversal.
As we have seen the sell print, it's time for short and we can go till 0.037 area.
Any reversal breaking our sell point will be trend continuation
DYOR
For indicator access, you can drop a message
XEC sell/short setupWe have a bearish QM on the chart.
The price is approaching a valuable range. We have the overlap of the qm level with a strong OB.
We are looking for sell/short positions in the red range.
Closing a daily candle above the invalidation level will violate the analysis.
For risk management, please don't forget stop loss and capital management
Comment if you have any questions
Thank You
XEC sell/short setupThe big XEC structure is bearish.
Looks like it's creating an internal pullback now.
By reaching the swap range, you can enter the sell/short position.
Closing a 4-hour candle above the invalidation level will violate the analysis
Note that the financial market is risky, so:
Do not enter a position without setting a stop and capital management and confirmation and trigger.
When we reach the first TP, save some profit and try to move the stop continuously in the direction of your profit.
If you have any comments please post them, comments will help us improve our performance
Thanks
XEC - in the footsteps of smart money...Next chart with nice, possible accumulation. For me, it is very probable that this market will show gargantuan, bull breakout. So, let's go deeper. Chart shows analysis corresponding for Wyckoff method complemented by VSA elements.
The biggest volume belongs, in my opinion, to Upthrust Action element but not the biggest one is number one. The most important candle and volume is sequent bar. For me, he shows bag holding VSA pattern. This is place where smart money accumulated a lot of XEC's. This is a reason for non-spring market structure - gentle C-phase test and retest.
As I said, this market structure is good looking. So, I'll attentively observe this coin.
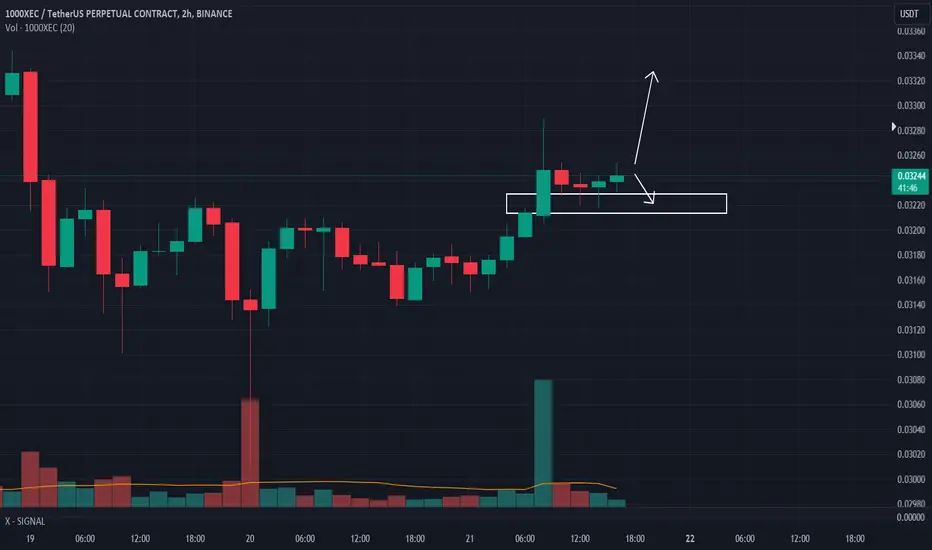
CRYPTO : 1000XECUSDTHM signal v2.0 (High momentum) spotted. Looking good with previous wave up with increasing volume and momentum.
- Heathy retracement and support well at good level @ 0.03214-0.03229
- Trending slow and steady if able to hold above the support zone
It is at extremely good reward to risk level now if able to hold above the support level.
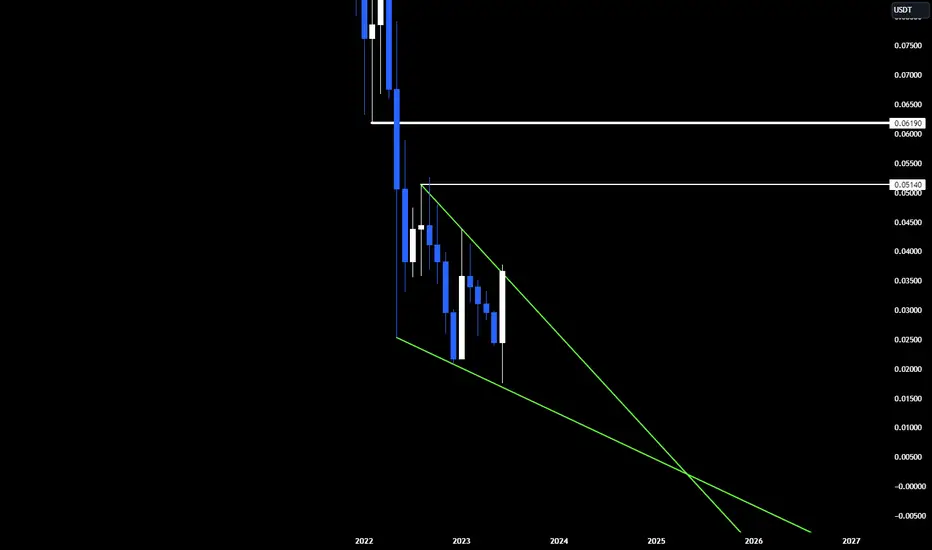
SHORT XEC BIG PROFIT OPPORTUNITYHi everybody,
I see big opportunity currently on xec to short monthly trend/lvl. In case we would continue to the upper side I took now my first position and Im prepared to add more. (lvls mentioned with the white colous)
Trade only money youre able to loss. Peace. Lock your profits :).
Lvls where I´m prepared to add more are mentioned on the chart.
eCash | XEC is going against the grain, possible short!?eCash | XEC is going against the grain, possible short!?
XEC is a weird one and a little risky as its going against the general market but it seems to be sharing a lot of bearish signals with a key break out of the pattern and bearish divergence
| Bearish Signal
| Break down from pattern
| Rejected from 20 Daily EMA
| Filled Weekly Pivot and rejected
| Last Key Support
| Bearish Divergence & Rejection from Resistance
| Break down on CVD
| Key Support is still in play so be careful
If you Could Read my Lines, the story my plots would tellsum of none. master with no grand and no ground.. i have put in my 10,000 hours, i heard that was enough to master a skill.. add as many zeroes as you want i still feel it's my first day with a keyboard... i wake up each day and think of something i need to learn and improve in myself. i'm scared most of the time, and i feel alone more than i knew i could. surviving this world i live in, where my life is impossible to understand, the coffers bare and not slept in a bed in over a year, parking lot to parking lot stealing power and free wifi coding 18 hours a day.. i don't know how i'm still here.
with charts, i find something i understand, can trust, when they speak to me.. indicators are more than simply what's in front of you, but what isn't obviously seen. sometimes we miss that there's more than just the standard tools rigidly picking us up and slamming us down..
by changing the way that we listen, we expand understanding.
my days charting have taught me to speak stronger
and how to listen to what isn't said
amidst noise, distortion, and aggressive volatility
in search of tender.