1INCH Nears Resistance, Bullish Retest ?1INCH has produced a strong bullish impulse from its recent lows and is now approaching a major high timeframe resistance zone.
This area has previously acted as a significant supply region, making it an important level to watch for signs of exhaustion. After such an aggressive rally, a short-term rejection would not be unusual and could provide the market with a healthier structure before any continuation higher.
If sellers defend the current resistance, price action could rotate back towards the key high timeframe support below. This support aligns with the 0.618 Fibonacci retracement, creating a strong technical confluence where buyers may look to re-enter the market. A controlled pullback into this region would allow the market to remove short-term inefficiencies while maintaining the broader bullish outlook.
The reaction at support will be critical. A strong bullish response, accompanied by increasing volume and a shift in lower timeframe market structure, would reinforce the idea that the recent rally remains intact rather than being a temporary relief bounce. This would also confirm the support as a higher low within the developing trend.
Should buyers successfully defend the support region, the probability increases for another impulsive move back towards the current high timeframe resistance. A breakout above that level would strengthen the bullish case further and potentially mark the beginning of a larger trend reversal on the higher timeframe.
In-depth trading ideas
๏ปฟ1INCH is currently completing a bullish triangle pattern (4H)1INCH appears to be nearing the end of a corrective phase that has formed a triangle. This triangle has a bullish outlook, and the final leg of the pattern (Wave E) also appears to be complete.
As long as the green support zone holds, the price could launch higher.
The targets are marked on the chart with red lines. Consider taking partial profits at the first target.
Let's see how it plays out.
If you have a coin or altcoin you want analyzed, first hit the like button and then comment its name so I can review it for you.
What do you think? Is 1INCH Bullish?
1INCH USDT SHORT SIGNAL#116. 1INCH/USDT โ Trade Setup (SHORT)
๐ Position Type: SHORT
๐ Timeframe: 1H
๐ Market: Futures
๐ฐ Entry Zone:
0.08485
0.08617
๐ Stop-Loss:
0.08780
๐ฏ Take-Profit Targets:
โข TP1:ย 0.08315
โข TP2: 0.08140
โข TP3: 0.07886
โข TP4:
โ๏ธ Leverage:
5 *10
โซ๏ธ After TP1, move SL to Entry + 0.2%.
โช๏ธ Exit Plan:
โข 50% at TP1
โข 25% at TP2
โข 25% at TP3
ย
๐ Risk Management:
Risk only 1โ2% of your capital per trade.
โ ๏ธ Always check and confirm the setup on your chart before entering the trade.
1INCHUSDT Forming Bullish Momentum1INCHUSDT is forming a clear bullish momentum pattern, a classic bullish wave signal that often indicates an upcoming breakout. The price has been consolidating within a narrowing range, suggesting that selling pressure is weakening while buyers are beginning to regain control. With consistent volume confirming accumulation at lower levels, the setup hints at a potential bullish breakout soon. The projected move could lead to an impressive gain of around 90% to 100% once the price breaks above the wedge resistance.
This bullish momentum pattern is typically seen at the end of downtrends or corrective phases, and it represents a potential shift in market sentiment from bearish to bullish. Traders closely watching 1INCHUSDT are noting the strengthening momentum as it approaches a key breakout zone. The healthy trading volume adds confidence to this setup, showing that market participants are gradually positioning ahead of a possible trend reversal.
Investors' growing interest in 1INCHUSDT reflects increasing confidence in the project's long-term fundamentals and improving technical outlook. If the breakout is confirmed with sustained buying volume, it could signal the beginning of a strong bullish move. Traders may find this an attractive opportunity for medium-term gains as momentum continues to build and buyers regain market control.
โ
Show your support by hitting the like button and
โ
Leaving a comment below! (What is You opinion about this Coin)
Your feedback and engagement keep me inspired to share more insightful market analysis with you!
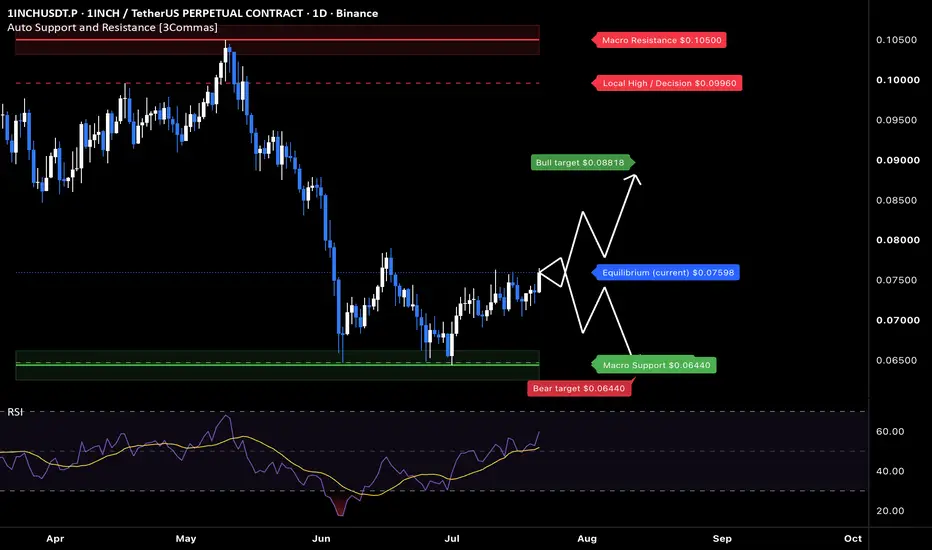
1INCH: local squeeze with $0.0882 destinationThe Macro Picture ๐บ๏ธ
1INCH unwound from the $0.105 highs down to the $0.06440 floor in June, then reversed and reclaimed ground to $0.07599. RSI is now pushing toward 60 as the recovery builds higher lows โ the balance has shifted back toward the buyers.
The Setup โ๏ธ
The Range Floor ๐ข
$0.06440 (Macro Support) is the demand base. The June low was defended and price has built well above it โ that's the floor this range pivots on.
The Decision Point ๐ด
$0.09960 (Local High) is the structural gate. Before it, the $0.08819 measured-move target is the first objective โ clearing it keeps the recovery intact.
The Roadmap ๐ฃ๏ธ
Hold above $0.06440 โ rotate up toward $0.08819 โ then challenge $0.09960. Invalidation is a clean daily close below $0.06440 โ that breaks the base.
This is a GRID Range Play: a defined band to rotate, buying the lower half and scaling out into strength.
More setups in profile.
#1INCH #crypto #trading #TA #3Commas #GRID
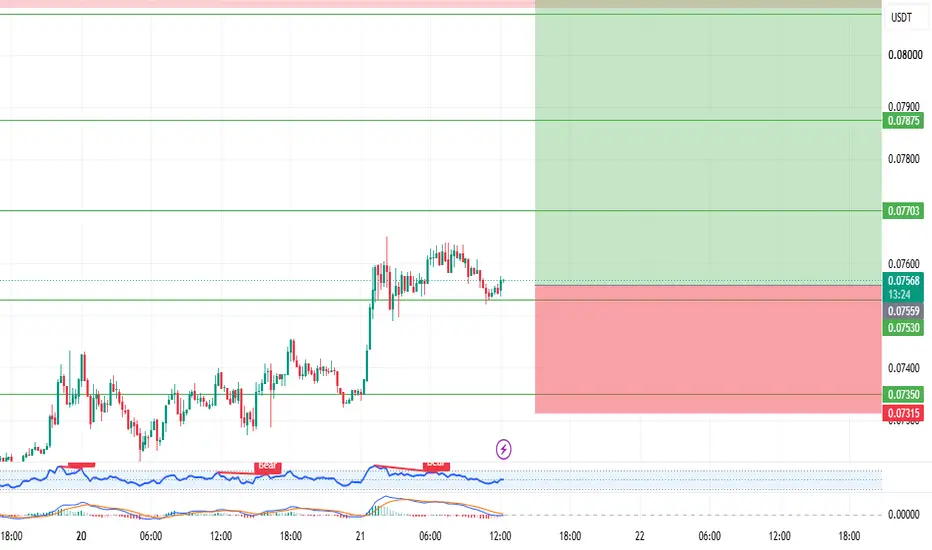
1INCH USDT LONG SIGNAL#100 1 INCH/USDT โ Trade Setup (LONG)
๐ Position Type: LONG
๐ Timeframe: 1H
๐ Market: Futures
๐ฐ Entry Zone:
Market..0.07570
๐ Stop-Loss:
0.073
๐ฏ Take-Profit Targets:
โข TP1: 0.077
โข TP2: 0.07875
โข TP3: 0.08079
โข TP4: 0.08340
โ๏ธ Leverage:
5 *10
โซ๏ธ After TP1, move SL to Entry + 0.2%.
โช๏ธ Exit Plan:
โข 40% at TP1
โข 20% at TP2
โข 20% at TP3
ย 20% at. TP4
๐ Risk Management:
Risk only 1โ2% of your capital per trade.
โ ๏ธ Always check and confirm the setup on your chart before entering the trade.
1INCHUSDT Forming Bullish Momentum1INCHUSDT is forming a clear bullish momentum pattern, a classic bullish wave signal that often indicates an upcoming breakout. The price has been consolidating within a narrowing range, suggesting that selling pressure is gradually weakening while buyers are beginning to regain control. With consistent trading volume confirming accumulation at lower levels, the current setup hints at a potential bullish breakout in the near future. The projected move could lead to an impressive gain of around 90% to 100% once the price breaks above the key resistance level.
This bullish momentum pattern is typically seen at the end of downtrends or corrective phases, representing a potential shift in market sentiment from bearish to bullish. Traders closely watching 1INCHUSDT are noticing strengthening momentum as the price approaches a critical breakout zone. Strong trading volume adds confidence to this setup, showing that market participants are positioning early in anticipation of a sustained upward move.
Growing investor interest in 1INCHUSDT reflects increasing confidence in the project's long-term fundamentals and its improving technical outlook. If the breakout is confirmed with sustained buying volume, it could mark the beginning of a fresh bullish leg. The ongoing consolidation phase suggests steady accumulation, creating favorable conditions for a strong continuation rally once the resistance level is cleared.
Traders may find this an attractive medium-term opportunity, especially as the bullish momentum pattern nears completion and buying pressure continues to build. A confirmed breakout could attract additional market participation and accelerate the move toward the projected upside target.
โ
Show your support by hitting the like button.
โ
Leaving a comment below! (What is You opinion about this Coin)
Your feedback and engagement keep me inspired to share more insightful market analysis with you!
1INCH USDT LONG SIGNAL#12
1INCH/USDT โ Trade Setup (LONG)
๐ Position Type: LONG
๐ Timeframe: 1 H
๐ Market: Futures
๐ฐ Entry Zone:
0.0719
0.0702
๐ Stop-Loss:
0.0680
๐ฏ Take-Profit Targets:
โข TP1:ย 0.0735
โข TP2:ย 0.0753
โข TP3:ย 0 .0770
โข TP4:ย 0.0788
TP5:ย 0.0807
TP6:ย
โ๏ธ Leverage:
5- 3
โ ๏ธ After reaching TP1, move Stop-Loss to Entry Price.
๐ Risk Management:
Risk only 1โ2% of your capital per trade.
Always confirm the setup on your chart before entry
1INCH: Optimal Entry Strategy1INCH: Tight Consolidation After Channel Breakout โ Optimal Entry Strategy
1INCH has officially established a major technical turning point by breaking out and completely escaping its long-term descending structure. Observing the visual chart , the current price candles no longer exhibit the sharp downward momentum of the previous cycle, indicating that sellers are running out of supply. However, because institutional capital has not fully returned to the broader market, the asset has been moving sideways within a narrow rectangular range on the daily (D) timeframe since late February 2026.
From a professional perspective, this flat consolidation phase reflects indecision from both sides, as buying power is not yet decisive enough to trigger a macro explosive rally. Trading inside this sideways noise carries the risk of trapped capital and price whipsaws. Therefore, the most disciplined and intelligent approach is to patiently wait on the sidelines and set a pending buy order once the price decisively shatters the upper boundary of the rectangle.
This trend-following entry strategy helps investors optimize their capital efficiency. Waiting for a confirmed breakout not only ensures the tightest possible stop-loss right below the newly breached boundary but also opens up a trade setup with the highest risk-to-reward (RR) ratio toward the macro targets above.
this is not investment advice, DYOR
1INCH: Triangle Breakout1INCH confirms a breakout from its descending triangle pattern, presenting an opportunity for a trade with an optimized RR ratio. However, the current structure still lacks a decisive consensus from major capital flows to trigger sustainable growth. The preferred strategy is to remain patient on the sidelines, observing for candle signals that confirm strong buying impulse before establishing a position. Prioritize risk management and decisive capital preservation during this sensitive phase.
this is not investment advice, DYOR
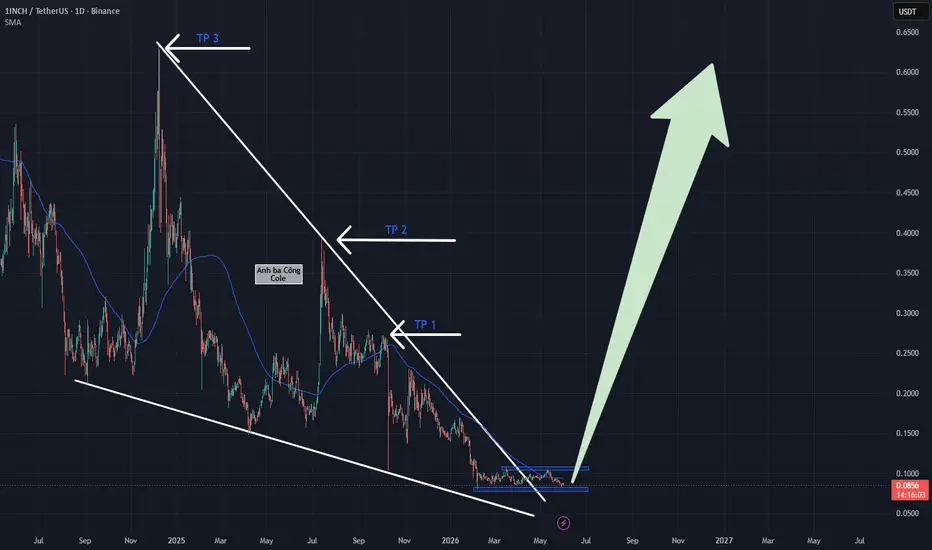
1INCH Macro Reversal Signal and the New Growth Roadmap
1INCH is outlining a highly impressive technical scenario within the 2026 market dynamics. As I emphasized in last week's analysis, the price compression at the decisive boundary was a clear precursor to an upcoming surge. Currently, the asset has officially escaped the grip of the long-term descending triangle pattern while recording a decisive climb above the 100-period moving average (MA100) โ a vital gauge for determining medium-term trend strength.
Looking at the chart, holding firm above the MA100 "ceiling" is not just a typical technical bounce; it is a firm confirmation of the bulls' resurgence. With an 8% gain over the last seven days, growth momentum is in its most expansive phase. For investors who established Long positions following the previous recommendation, iron discipline now means holding firm to optimize profits. If you are still on the sidelines, the current price zone is still considered a potential entry area as the old technical barrier has transformed into a solid foundation. The expected profit target is directed straight toward the apex of the triangle structure, offering an incredibly attractive Risk-to-Reward (RR) ratio. Be patient, stick to the roadmap, and practice decisive capital management as macro hurdles begin to vanish completely.
this is not investment advice, DYOR
Breaking Out from a Consolidation zone. 1INCHUSDT Analysis
CMP 0.1033 (11-05-2026 01:45am PST)
Breaking Out from a Consolidation zone.
Sustaining this Breakout level may lead it
towards 0.1174 initially.
Breakout Retest level is around 0.1018 0.1019
However, breaking 0.0911 may drag the price
towards the rectangular channel bottom again.
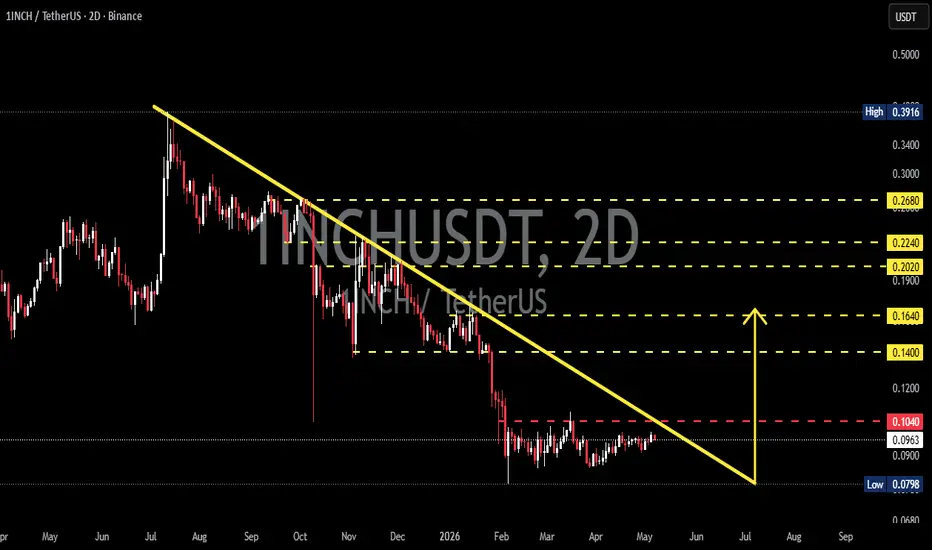
1INCH/USDT - Approaching Major Trendline Breakout?1INCH/USDT is currently sitting at a critical area after experiencing a long-term downtrend since mid last year. On the 2D timeframe, price is approaching a major descending trendline resistance that has been suppressing bullish movement for months. ๐ฅ
The current chart structure suggests that the market may be forming an accumulation phase near the bottom area, which often becomes an early sign before a major reversal begins. โก
โโโโโโโโโโโโโโโโโโ
๐ Chart Structure & Pattern
๐ป Descending Trendline (Long-Term Downtrend)
Price has continuously formed:
โ Lower Highs
โ Lower Lows
This confirms that sellers have remained dominant in the medium-to-long term trend. ๐
However, several positive signals are starting to appear:
โ
Selling pressure is weakening
โ
Price movement is becoming more stable around support
โ
Volatility is decreasing
โ
Candles are approaching the breakout area
Conditions like this often indicate that the market is preparing for a bullish reversal momentum. ๐
โโโโโโโโโโโโโโโโโโ
๐ข Bullish Scenario
The bullish scenario will become stronger if price manages to:
โ๏ธ Break above the descending trendline
โ๏ธ Close candles above the major resistance area
โ๏ธ Show significant buying volume
โ๏ธ Successfully hold the breakout retest
If the breakout succeeds, the potential move toward higher resistance levels becomes much stronger. ๐ฅ
๐ฏ Bullish Targets:
๐ 0.1040
๐ 0.1400
๐ 0.1640
๐ 0.2020
๐ 0.2240
๐ 0.2680
The 0.2020 โ 0.2680 zone becomes a major upside target if bullish momentum continues. ๐
โโโโโโโโโโโโโโโโโโ
๐ด Bearish Scenario
The bearish scenario still needs attention if:
โ Price fails to break the trendline
โ Strong rejection appears at diagonal resistance
โ Buyers lose momentum
โ The overall crypto market turns weak again
๐ Important Support Levels:
๐ก๏ธ 0.0900
๐ก๏ธ 0.0798
If the major support at 0.0798 breaks down, the probability of continuing the downtrend and creating new lows becomes significantly higher. ๐
โโโโโโโโโโโโโโโโโโ
๐ Conclusion
1INCH is currently trading in a very important market decision zone. ๐
Technically:
โ
Downtrend momentum is weakening
โ
Accumulation structure is starting to form
โ
Breakout potential is becoming clearer
However, the market still needs:
โ ๏ธ Breakout confirmation
โ ๏ธ Strong volume
โ ๏ธ A valid retest
Before entering a larger bullish reversal phase. ๐
As long as price remains above the major support zone, the recovery opportunity remains open for the medium term. ๐
โโโโโโโโโโโโโโโโโโ
#1INCH #1INCHUSDT #Crypto #CryptoTrading #TradingView #Altcoin #Bullish #Breakout #TechnicalAnalysis #CryptoAnalysis #SupportResistance #Trendline #Reversal #Altseason
1INCH: Weekly Breakout1INCH has just reached a major technical turning point by officially escaping its long-term descending channel on the weekly timeframe. This is a promising macro signal for 2026, marking the bulls' effort to break a prolonged negative trend. However, through the lens of a professional risk manager, this shift still lacks a vital element to trigger an explosive rally: Decisive buying momentum. The appearance of small and fragmented bullish candle bodies is clear evidence that smart money remains in observation mode rather than actively pushing the price.
In reality, 1INCH has maintained a "hibernation" state within the 0.08 - 0.11 USD support zone for 11 consecutive weeks. This is an extremely long liquidity compression phase, where the boundary between accumulation and weakness becomes very thin. In professional circles, breaking a bearish structure without exploding volume often carries the risk of a bull trap (fakeout). Therefore, the safest and most disciplined strategy right now is not to chase buy orders within the noisy sideways range. Instead, setting a Buy Stop order at the 0.113 USD threshold will be the key to capital preservation. This action ensures we only enter when the market confirms a powerful thrust, completely neutralizing the stalemate and opening a new, decisive growth roadmap as technical obstacles vanish and momentum returns.
this is not investment advice, DYOR
1INCH: Confirming the "Growth Stairs" Pattern1INCH is performing with remarkable precision, strictly following the scenario we outlined last week. Observing the current structure, we can clearly see a highly sustainable uptrend built on a "staircase" model. The sequence of higher highs and higher lows serves as a testament that neutralizes all doubts regarding current buying momentum. This indicates that capital is quietly accumulating positions with discipline, rather than through fleeting, impulsive spikes.
The most critical technical highlight is the price candle officially closing above the 100-period Moving Average (MA100). In professional circles, this is the "golden" boundary that distinguishes a downtrend from a powerful impulsive recovery cycle. Holding firm on this foundation provides 1INCH with the necessary drive to conquer the next challenge: the 0.1 USD psychological round-number threshold. This is considered an emotional barrier rather than a purely technical one. Once the 0.01 USD hurdle is decisively cleared, the path toward the 0.117 USD target this April will become wide open. We are in a positive capital rotation cycle where patience and iron discipline will yield worthy rewards.
] 1INCH: Touching the Expanding Triangle "Floor"1INCH is capturing significant market attention as it officially touches the "golden" support zone within a high-potential expanding triangle structure. From a strategic perspective, this is one of the most explosive technical patterns, typically appearing when the market is coiling energy for a major volatile shift. The fact that price candles reacted precisely at the lower boundary of the long-term accumulation model is no coincidence; it is evidence that active buying power is returning to defend this core value zone throughout 2026.
Why do we have a Long setup with an impressive Risk-to-Reward (RR) ratio exceeding 8? The reason lies in the expanding volatility of the current structure. As the price holds firm at this steel foundation, the target toward the triangleโs upper edge becomes vast, while the stop-loss remains extremely tight just below the barrier. In professional circles, this support touch acts like a spring compressed to its limit. With just a sufficient "push" from broader market capital, 1INCH will easily trigger a powerful growth impulse, neutralizing technical doubts and opening the path to conquer new macro milestones.
1INCH/USDT โ Test Downtrend Resistance | Breakout or Rejection?1INCH/USDT remains in a medium to long-term downtrend, clearly characterized by a sequence of lower highs and lower lows since the previous peak. Price is currently experiencing a relief rally, moving upward toward a major descending trendline resistance that has historically capped bullish attempts.
This area represents a critical decision zone. Market participants are closely watching whether price will break the trendline or get rejected and continue the bearish structure.
---
Pattern Explanation
Descending Trendline (Bearish Market Structure)
The descending trendline has been respected multiple times, acting as a strong dynamic resistance.
Each previous touch of this trendline resulted in price rejection and continuation to the downside.
Price is now approaching the same trendline again, making this level technically significant.
Potential Bearish Continuation Structure
Overall structure still favors sellers unless a confirmed breakout occurs.
Failure to break above resistance may form a bearish continuation setup, leading to another impulsive drop.
---
Key Levels
Resistance Zones
0.1700 USDT โ Minor resistance / reaction zone
0.2035 USDT โ Key resistance & trendline breakout level
0.2245 USDT โ Strong resistance / confirmation level
0.2700 โ 0.2950 USDT โ Upper supply zone
0.3540 USDT โ Major resistance / previous range high
Support Zones
0.1635 USDT โ Short-term support
0.1450 โ 0.1330 USDT โ Major demand zone
A breakdown below this zone would strengthen the bearish continuation scenario.
---
Bullish Scenario
Price breaks and closes above the descending trendline on the daily timeframe.
Strong confirmation occurs with a daily close above 0.2035 USDT.
This would invalidate the bearish structure and signal a potential trend reversal.
Bullish targets:
0.2245 USDT
0.2700 USDT
0.2950 USDT
Increasing volume during breakout would further support bullish momentum.
Bias: Trend reversal if breakout is confirmed.
---
Bearish Scenario
Price fails to break the trendline and shows rejection (bearish candle / long upper wick).
Rejection around 0.1700 โ 0.2035 USDT confirms seller dominance.
Downside targets:
0.1635 USDT
0.1450 USDT
0.1330 USDT
A clean breakdown below support would confirm bearish continuation.
Bias: Bearish continuation if rejection occurs.
---
Conclusion
1INCH/USDT is currently trading at a major technical inflection point. The descending trendline acts as the key level determining the next major move.
Traders should wait for clear confirmation โ either a breakout for bullish continuation or a rejection for bearish continuation.
This is a high-risk, high-impact zone, best traded with confirmation and proper risk management.
---
#1INCH #1INCHUSDT #CryptoAnalysis #TechnicalAnalysis #Altcoins #Downtrend #Trendline #SupportResistance #Breakout #Bearish #Bullish #PriceAction
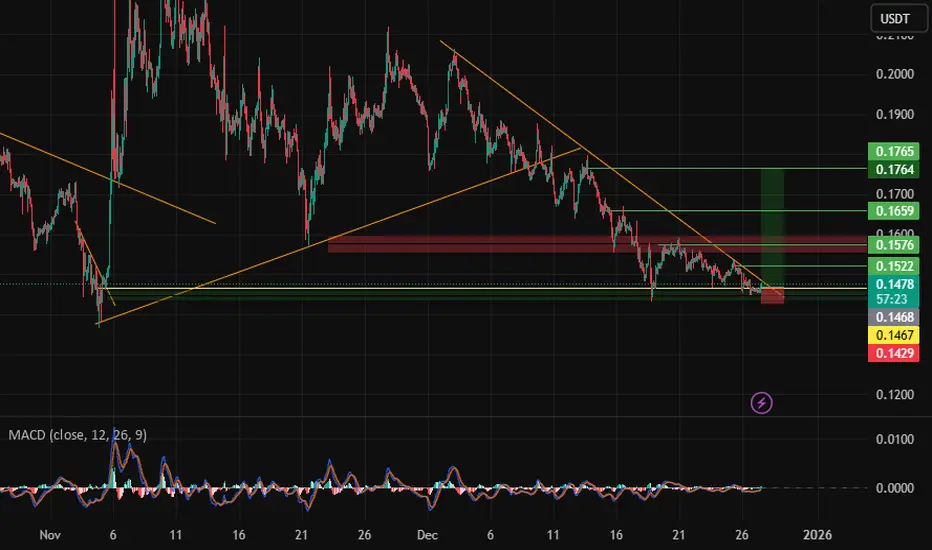
1INCHUSDT LONG SIGNAL
---
๐ข **Trade Idea โ 1INCH/USDT**
๐ **Position Type:** LONG
๐ฐ **Entry Price:** 0.1468
๐ **Stop-Loss:** 0.1429
๐ฏ **Take-Profit Targets (Partial Exits):**
โข TP1: 0.1522
โข TP2: 0.1576
โข TP3: 0.1659
โข TP4: 0.1764
๐ **Timeframe:** 15m
โ๏ธ **Suggested Leverage:** 3ร
---
๐ง **Technical Analysis**
Price is trading at the lower boundary of a falling wedge and reacting from a strong demand zone.
The structure suggests a potential bullish breakout with continuation toward higher resistance levels.
Targets are aligned with key liquidity and resistance zones.
---
โ๏ธ **Trade Management Plan**
โ๏ธ Take partial profit at TP1
โ๏ธ Move Stop-Loss to Break-Even after TP1
โ๏ธ Secure profits step by step
โ๏ธ If a 15m candle closes below 0.1429 โ setup invalid
---
โ ๏ธ **Risk Disclaimer**
This is not financial advice.
Always manage your own risk.
Capital protection comes first.
---
โ **mastercrypto2020
1INCH โ Long Setup Idea (15m)The weekend range has been fully swept, and price has moved back inside the Monday range. After reclaiming the MDAY-Low, we can see early signs of a shift in momentum, supported by the Total Market Cap structure which also suggests a potential long opportunity.
Price is breaking above the descending trendline while forming a rounded retest structure. My first target is the Monday High (MDAY-H), where a bearish order block sits. I plan to secure 50% profits at that level and let the remainder run if market strength continues.
Invalidation sits below the recent swing low.
MrC
$1INCH/USDT ANALYSISOn the 3-day chart of 1INCH/USDT, the price is trading inside a long-term descending triangle pattern, capped by a strong downtrend line from the previous major high near $0.60. The horizontal support zone around $0.16โ$0.18 has repeatedly held since early 2025, acting as a major accumulation base. Each dip into this area has been met with buying pressure, shown by long lower wicks and volume spikes, confirming it as a strong demand zone. However, momentum remains weak as the candles are still forming below the Ichimoku cloud, keeping the broader trend bearish.
Currently, 1INCH is consolidating near $0.19, facing resistance from the descending trendline and lower edge of the cloud near $0.22โ$0.24. A decisive breakout and close above that zone would be the first sign of a potential trend reversal, possibly targeting $0.28โ$0.32 in the mid-term. But if the price fails to hold above the $0.16โ$0.18 support and breaks down, it could extend lower toward $0.13โ$0.14, which is the next major liquidity pocket. Overall, the structure remains bearish-neutral, with accumulation signs at the base but no confirmed reversal until a breakout above the descending trendline.
#1INCHUSDT โ Accumulation or the Beginning of a Breakdown?#1INCH
The price is moving within an ascending channel on the 1-hour timeframe and is adhering to it well. It is poised to break out strongly and retest the channel.
We have a downtrend line on the RSI indicator that is about to break and retest, which supports the upward move.
There is a key support zone in green at 0.1770, representing a strong support point.
We have a trend of consolidation above the 100-period moving average.
Entry price: 0.1909
First target: 0.1954
Second target: 0.2010
Third target: 0.2080
Don't forget a simple money management rule:
Place your stop-loss order below the green support zone.
Once you reach the first target, save some money and then change your stop-loss order to an entry order.
For any questions, please leave a comment.
Thank you.