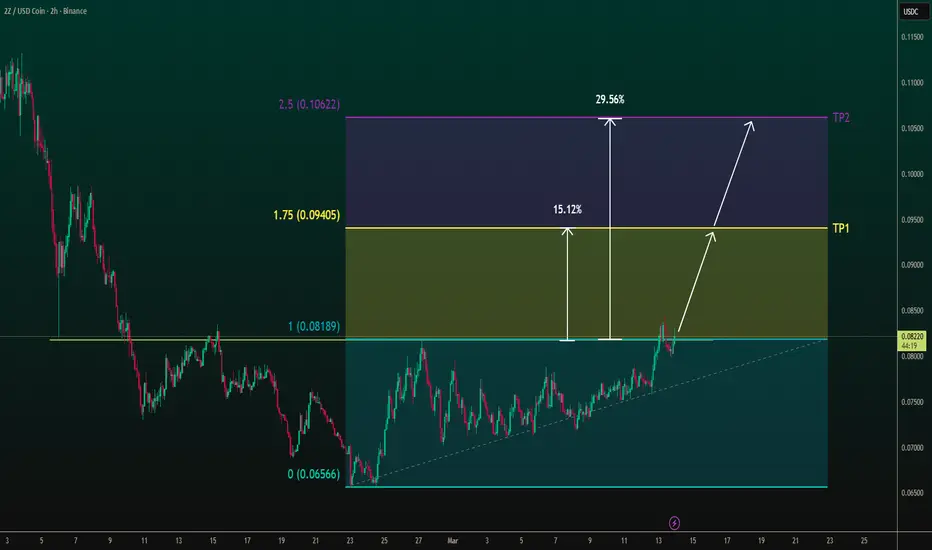
2Z/USDC – Ascending Structure With Breakout PotentialPrice appears to be forming an ascending structure after a prolonged downtrend, with higher lows building along the rising trendline. If momentum continues and price holds above the current support zone, a move toward the next resistance areas becomes possible. The first target sits near the mid-ran
Compare with 2ZU/SDC
2Z/USDC – possible bounce from monthly low?2Z seems to have found some footing around the 0.073–0.074 zone after a sharp drop.
Looks like we're slowly building higher with a series of higher lows so far.
If this structure holds, first interesting area might be around the 1.75 fib extension (~5–6%), and maybe even 2.5 fib (~11%) if momentum p
See all ideas
Summarizing what the indicators are suggesting.
Oscillators
Neutral
SellBuy
Strong sellStrong buy
Strong sellSellNeutralBuyStrong buy
Oscillators
Neutral
SellBuy
Strong sellStrong buy
Strong sellSellNeutralBuyStrong buy
Summary
Neutral
SellBuy
Strong sellStrong buy
Strong sellSellNeutralBuyStrong buy
Summary
Neutral
SellBuy
Strong sellStrong buy
Strong sellSellNeutralBuyStrong buy
Summary
Neutral
SellBuy
Strong sellStrong buy
Strong sellSellNeutralBuyStrong buy
Moving Averages
Neutral
SellBuy
Strong sellStrong buy
Strong sellSellNeutralBuyStrong buy
Moving Averages
Neutral
SellBuy
Strong sellStrong buy
Strong sellSellNeutralBuyStrong buy
Displays a symbol's price movements over previous years to identify recurring trends.