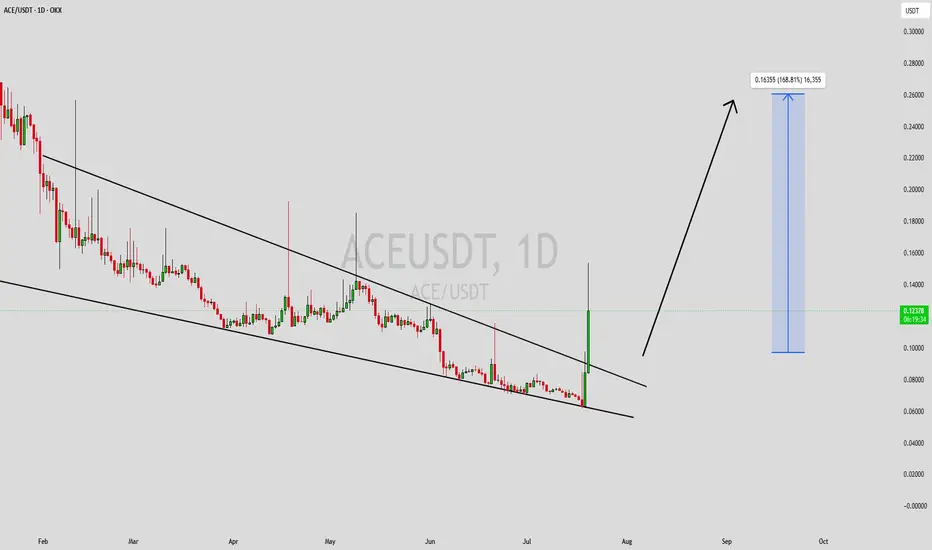
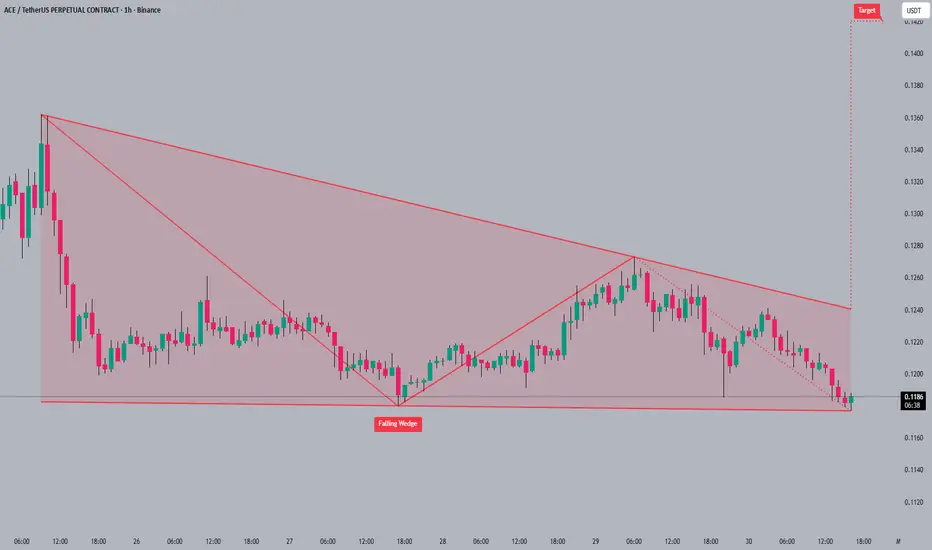
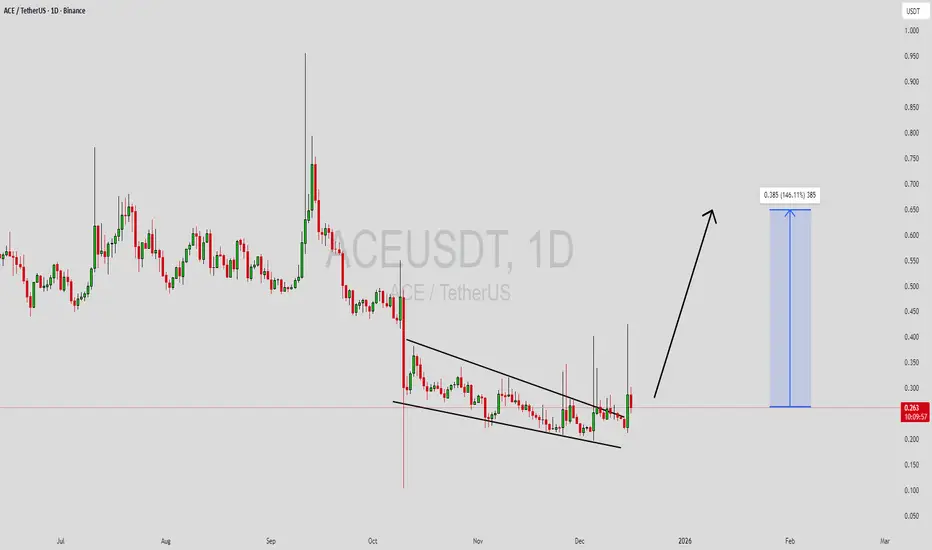
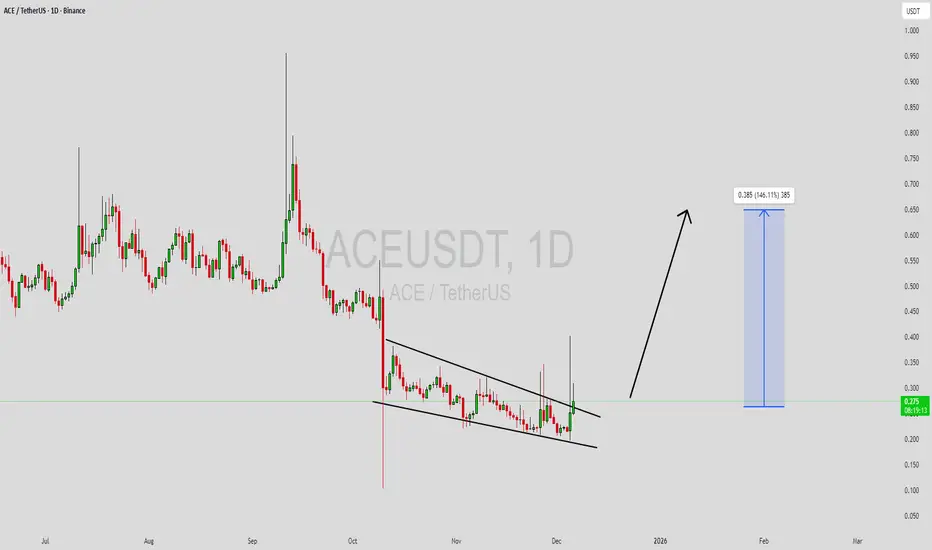
ACEUSDT Forming Falling WedgeACEUSDT is forming a clear falling wedge pattern, a classic bullish wave signal that often indicates an upcoming breakout. The price has been consolidating within a narrowing range, suggesting that selling pressure is gradually weakening while buyers are beginning to regain control. With consistent trading volume confirming accumulation at lower levels, the current setup hints at a potential bullish breakout in the near future. The projected move could lead to an impressive gain of around 140% to 150% once the price breaks above the key resistance level.
This falling wedge pattern is typically seen at the end of downtrends or corrective phases, representing a potential shift in market sentiment from bearish to bullish. Traders closely watching ACEUSDT are noticing strengthening momentum as the price approaches a critical breakout zone. Strong trading volume adds confidence to this setup, showing that market participants are positioning early in anticipation of a sustained upward move.
Growing investor interest in ACEUSDT reflects increasing confidence in the project's long-term fundamentals and its improving technical outlook. If the breakout is confirmed with sustained buying volume, it could mark the beginning of a fresh bullish leg. The ongoing consolidation phase suggests steady accumulation, creating favorable conditions for a strong continuation rally once the resistance level is cleared.
Traders may find this an attractive medium-term opportunity, especially as the falling wedge pattern nears completion and buying pressure continues to build. A confirmed breakout could attract additional market participation and accelerate the move toward the projected upside target.
✅ Show your support by hitting the like button.
✅ Leaving a comment below! (What is You opinion about this Coin)
Your feedback and engagement keep me inspired to share more insightful market analysis with you!
In-depth trading ideas
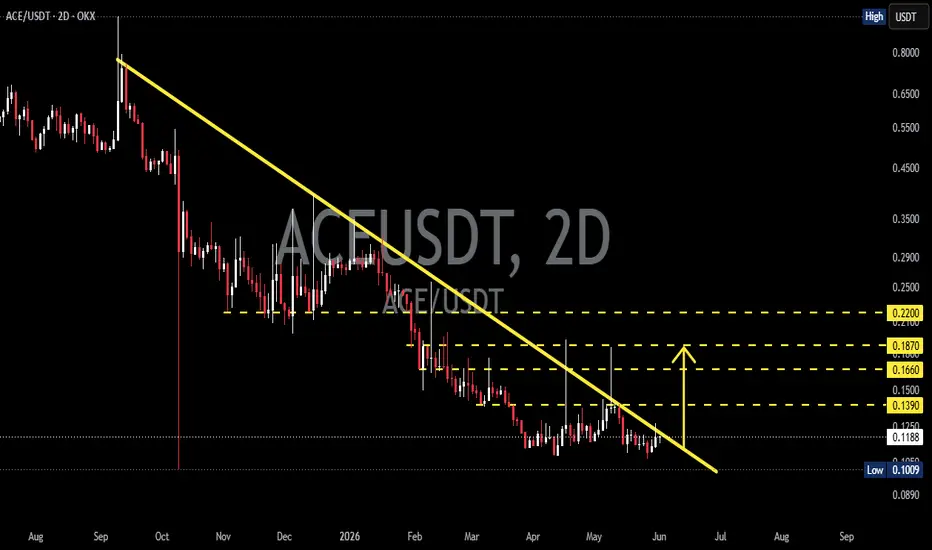
ACEUSDT - Descending TrendLine, Reversal or Another Rejection?On the 2-day timeframe chart, ACE/USDT is still trading below the major Descending TrendLine that has been suppressing price action since the September 2025 peak. 📉
This structure indicates that the medium- to long-term trend remains bearish. However, the price is now approaching the final section of the trendline, which often becomes a decisive area for determining the next major move. 🎯
After experiencing a prolonged decline, the price has started forming an accumulation phase around the 0.1009 – 0.1200 USDT area. 🏗️
Selling pressure appears to be weakening while volatility is narrowing, which is often an early sign that a significant move could be approaching. ⚡
---
📐 Pattern Formation
🔻 Descending TrendLine
The primary pattern on this chart is a Descending TrendLine, connecting a series of lower highs since September 2025.
🔍 Pattern Characteristics:
✅ Indicates seller dominance for several months.
✅ Consistently forms a lower-high structure.
✅ The closer the price gets to the end of the trendline, the greater the probability of a breakout. 💥
✅ A valid breakout is typically confirmed by a candle close above the trendline accompanied by increased volume. 📊
✅ This pattern often serves as an early signal of a trend reversal when resistance is successfully broken. 🚀
---
🟢 Bullish Scenario
A bullish confirmation would occur if the price successfully breaks and holds above the Descending TrendLine. 📈
🎯 Bullish Targets:
🥇 0.1390 USDT
- The nearest resistance level after a breakout.
🥈 0.1660 USDT
- The next supply zone and intermediate resistance.
🥉 0.1870 USDT
- A higher target if buying momentum continues to strengthen.
🏆 0.2200 USDT
- The major resistance level and the ultimate bullish target shown on the chart.
🚀 Bullish Supporting Factors:
✔️ Breakout above the Descending TrendLine.
✔️ Formation of a higher low following the accumulation phase.
✔️ Increased volume during the breakout. 📊
✔️ Buyers begin taking control of the market. 🐂
✔️ Overall cryptocurrency market sentiment turns positive. 🌎
---
🔴 Bearish Scenario
As long as the price remains below the trendline, downside risks still exist. ⚠️
🎯 Bearish Targets:
🔻 0.1100 USDT
- The nearest support zone that must be defended.
🔻 0.1009 USDT
- The major historical support and current cycle low.
🔻 If this support fails to hold, the price could create a new low and continue the downtrend that has been in place since 2025. 📉
⚠️ Bearish Factors:
❌ Strong rejection at the Descending TrendLine.
❌ False breakout (Fake Breakout). 🚨
❌ Weak buying volume.
❌ Sellers regain market control. 🐻
❌ The broader crypto market enters another correction phase.
---
🔍 Conclusion
ACE/USDT is currently at a highly interesting stage as the price approaches the end of its long-term Descending TrendLine. 📐
This area often becomes a critical decision point between trend continuation and a potential trend reversal. 🔄
🟢 If the price successfully breaks above and holds the trendline, the path toward 0.1390 – 0.2200 USDT becomes increasingly achievable.
🔴 However, if the breakout fails, 0.1009 USDT will once again become the key support level that buyers must defend.
📌 Traders should wait for a valid breakout confirmation before making major decisions, as the current area represents a high-volatility zone. ⚡
💡 In other words, ACE/USDT is currently in a "make-or-break" phase that could determine the direction of the next major trend over the coming weeks.
#ACEUSDT #ACE #Crypto 🚀 #Cryptocurrency #Altcoin #TradingView #TechnicalAnalysis 📊 #ChartAnalysis #PriceAction #DescendingTrendline #Breakout 💥 #BullishSetup 🐂 #BearishScenario 🐻 #SupportAndResistance #TrendlineBreakout #CryptoTrading #SwingTrading #AltcoinSeason #MarketStructure #CryptoMarket #TechnicalTrader #AccumulationZone #TrendReversal 🔥 #MarketAnalysis #TraderLife #BullishBreakout #CryptoCommunity
ACEUSDT – Ready for Reversal or Further Drop?The ACE/USDT (1D) pair is still in a strong downtrend (bearish trend) 📉 since its previous major peak. Price continues forming lower highs and lower lows ⬇️⬇️, indicating clear seller dominance ⚠️
Currently, price is sitting in the lower range and starting to show signs of minor consolidation 🔄, right near a key support zone 🟡
---
📐📉 Pattern Explanation
A clear Descending Channel / Descending Trendline is visible 🔻
The yellow trendline acts as dynamic resistance 🚧
Price consistently gets rejected from this trendline ❌
This structure confirms ongoing selling pressure 🐻
Additionally:
Yellow horizontal zones represent layered supply & resistance areas 🟨
These levels will be key reaction zones if price moves upward ⚡
---
🎯📍 Key Levels
Support:
0.1320 – 0.1250 ➝ current demand zone 🟢
0.1100 ➝ next strong support 🧱
Resistance:
0.1400 🚧
0.1530 🚧
0.1665 🚧
0.1880 🚧
0.2150 ➝ major resistance 🔥
---
🚀📈 Bullish Scenario
Bullish momentum may develop if:
✅ Price breaks & closes above the trendline 📊
✅ Volume increases during breakout 📢
✅ Price reclaims the 0.1400+ zone 🔓
Upside targets:
0.1530 🎯
0.1665 🎯
0.1880 🎯
0.2150 🎯🔥
💡 This would indicate a potential trend reversal or at least a relief rally 🚀
---
📉🐻 Bearish Scenario
Bearish bias remains dominant if:
❌ Price fails to break the trendline 🚫
❌ Rejection occurs at resistance zones 🔻
❌ Breakdown below 0.1250 support 💥
Downside targets:
0.1100 🎯
Potentially lower if panic selling occurs 😱
💡 Structure remains lower highs → confirming continuation of the downtrend ⬇️
---
🧠⚖️ Conclusion
ACEUSDT is currently at a critical point ⚖️🔥
Break above trendline = reversal opportunity 🚀
Another rejection = continuation to the downside 📉
This area is best for wait & see or confirmation-based entries, not aggressive positions without validation ⚠️
#ACEUSDT #CryptoAnalysis #TechnicalAnalysis #Altcoin #TradingView #Breakout #Downtrend #SupportResistance #CryptoTrading #ChartAnalysis #Bearish #Bullish #PriceAction
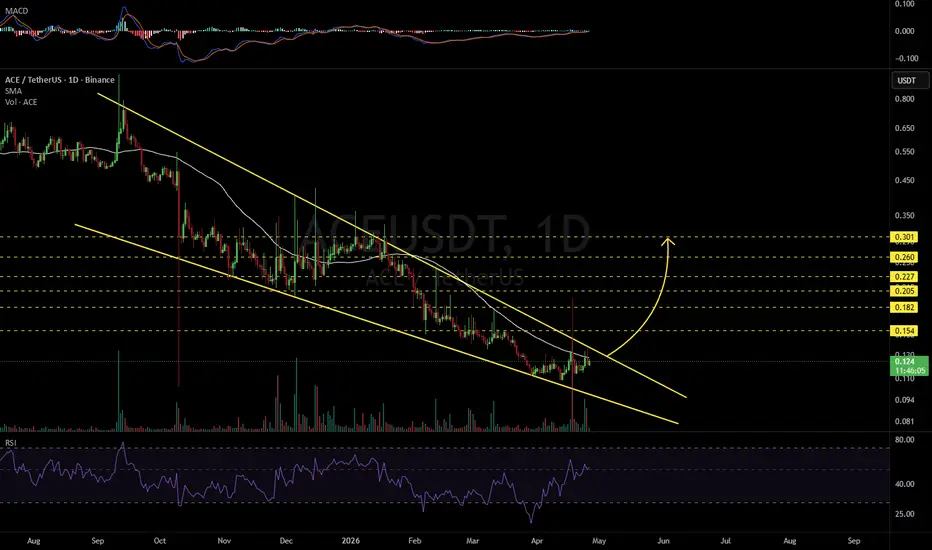
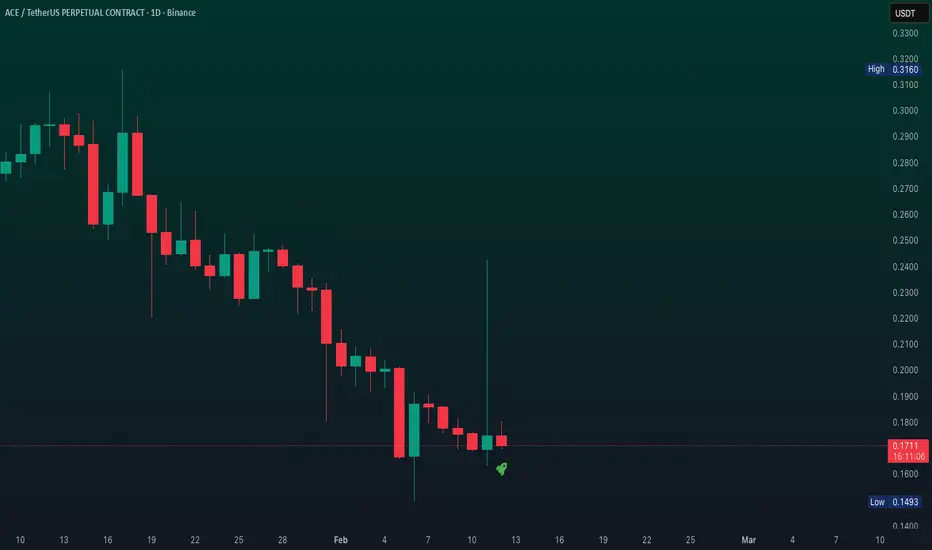
ACEUSDT 1D#ACE is moving within a falling wedge pattern on the daily chart. Consider entering this coin after a confirmed breakout above the wedge resistance and the daily SMA50. In that case, the upside targets are:
🎯 $0.154
🎯 $0.182
🎯 $0.205
🎯 $0.227
🎯 $0.260
🎯 $0.301
⚠️ Always remember to use tight stop-losses and maintain proper risk management.
#ACE/USDT Forming Bullish Momentum#ACE
The price is moving within a descending channel on the hourly timeframe. It has reached the lower boundary and is heading towards a breakout, with a retest of the upper boundary expected.
The Relative Strength Index (RSI) is showing a downward trend, approaching the lower boundary, and an upward bounce is anticipated.
There is a key support zone in green at 0.164, and the price has bounced from this level several times. Another bounce is expected.
The RSI is showing a trend towards consolidation above the 100-period moving average, which we are approaching, supporting the upward move.
Entry Price: 0.170
First Target: 0.175
Second Target: 0.182
Third Target: 0.190
Stop Loss: Below the green support zone.
Remember this simple thing: Money management.
For any questions, please leave a comment.
Thank you.
#ACE/USDT Forming Bullish Momentum#ACE
The price is moving within a descending channel on the hourly timeframe. It has reached the lower boundary and is heading towards a breakout, with a retest of the upper boundary expected.
The Relative Strength Index (RSI) is showing a downward trend, approaching the lower boundary, and an upward bounce is anticipated.
There is a key support zone in green at 0.172, and the price has bounced from this level several times. Another bounce is expected.
The RSI is showing a trend towards consolidation above the 100-period moving average, which we are approaching, supporting the upward move.
Entry Price: 0.175
Target 1: 0.181
Target 2: 0.191
Target 3: 0.200
Stop Loss: Below the green support zone.
Remember this simple thing: Money management.
For any questions, please leave a comment.
Thank you.
#ACE/USDT Forming Bullish Momentum#ACE
The price is moving within a descending channel on the hourly timeframe. It has reached the lower boundary and is heading towards a breakout, with a retest of the upper boundary expected.
The Relative Strength Index (RSI) is showing a downward trend, approaching the lower boundary, and an upward bounce is anticipated.
There is a key support zone in green at 0.245. The price has bounced from this level several times and is expected to bounce again.
The indicator is showing a trend towards consolidation above the 100-period moving average, which we are approaching, supporting the upward move.
Entry Price: 0.251
Target 1: 0.261
Target 2: 0.273
Target 3: 0.287
Stop Loss: Below the green support zone.
Remember this simple thing: Money management.
For any questions, please leave a comment.
Thank you.
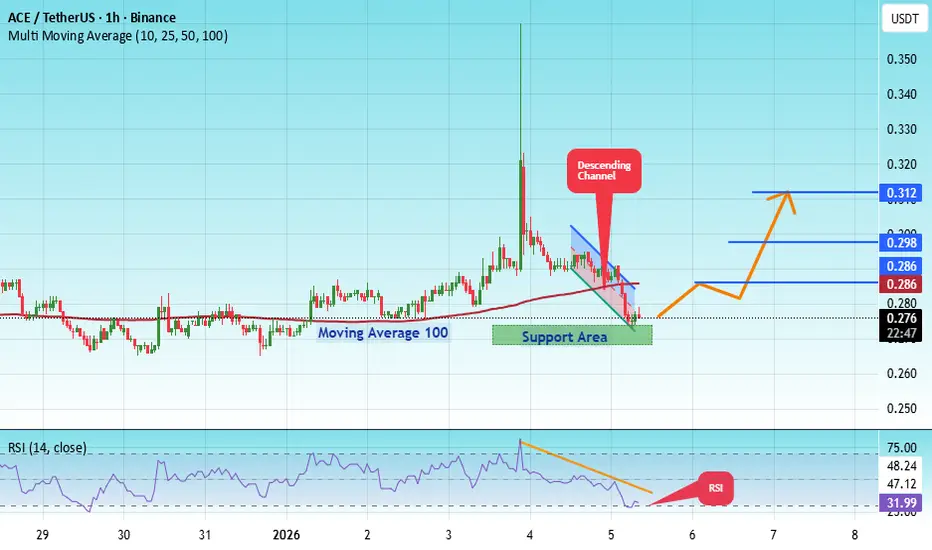
#ACE/USDT LONG#ACE
The price is moving in a descending channel on the 1-hour timeframe. It has reached the lower boundary and is heading towards breaking above it, with a retest of the upper boundary expected.
We have a downtrend on the RSI indicator, which has reached near the lower boundary, and an upward rebound is expected.
There is a key support zone in green at 0.270. The price has bounced from this zone multiple times and is expected to bounce again.
We have a trend towards stability above the 100-period moving average, as we are moving close to it, which supports the upward movement.
Entry price: 0.276
First target: 0.286
Second target: 0.298
Third target: 0.312
Stop loss: Below the support zone in green.
Don't forget a simple thing: capital management.
For inquiries, please leave a comment.
Thank you.
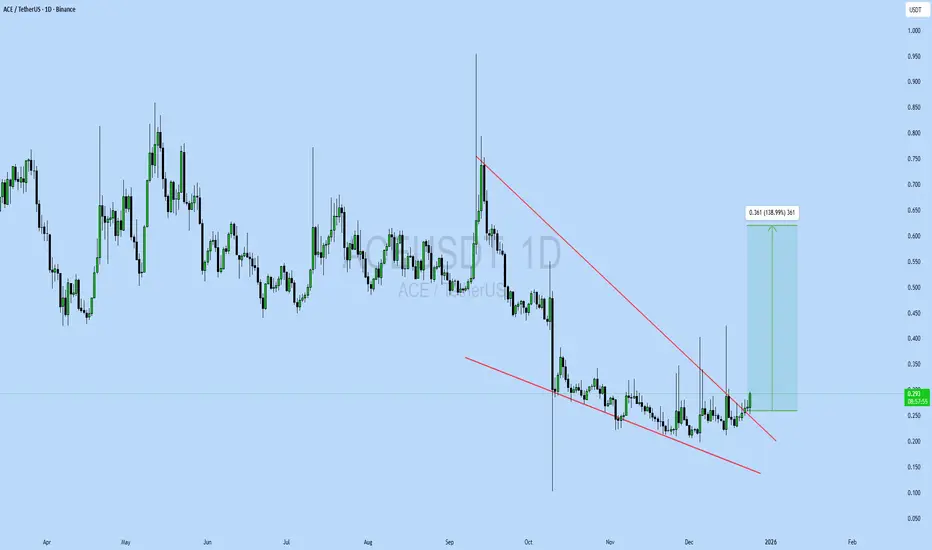
ACEUSDT UPDATE#ACE
UPDATE
ACE Technical Setup
Pattern: Falling Wedge Pattern
Current Price: $0.292
Target Price: $0.361
Target % Gain: 138.99%
Technical Analysis: ACE is breaking out of a falling wedge pattern on the 1D chart, signaling bullish potential. The price has recently surged above the resistance trendline, supported by an increase in volume. The setup is validated as the price approaches key resistance areas.
Time Frame: 1D
Risk Management Tip: Always use proper risk management.
ACEUSDT Forming Falling WedgeACEUSDT is forming a clear falling wedge pattern, a classic bullish reversal signal that often indicates an upcoming breakout. The price has been consolidating within a narrowing range, suggesting that selling pressure is weakening while buyers are beginning to regain control. With consistent volume confirming accumulation at lower levels, the setup hints at a potential bullish breakout soon. The projected move could lead to an impressive gain of around 90% to 100% once the price breaks above the wedge resistance.
This falling wedge pattern is typically seen at the end of downtrends or corrective phases, and it represents a potential shift in market sentiment from bearish to bullish. Traders closely watching ACEUSDT are noting the strengthening momentum as it nears a breakout zone. The good trading volume adds confidence to this pattern, showing that market participants are positioning early in anticipation of a reversal.
Investors’ growing interest in ACEUSDT reflects rising confidence in the project’s long-term fundamentals and current technical strength. If the breakout confirms with sustained volume, this could mark the start of a fresh bullish leg. Traders might find this a valuable setup for medium-term gains, especially as the wedge pattern completes and buying momentum accelerates.
✅ Show your support by hitting the like button and
✅ Leaving a comment below! (What is your opinion about this Coin?)
Your feedback and engagement keep me inspired to share more insightful market analysis with you!
ACEUSDT Forming Falling WedgeACEUSDT is forming a clear falling wedge pattern, a classic bullish reversal signal that often indicates an upcoming breakout. The price has been consolidating within a narrowing range, suggesting that selling pressure is weakening while buyers are beginning to regain control. With consistent volume confirming accumulation at lower levels, the setup hints at a potential bullish breakout soon. The projected move could lead to an impressive gain of around 90% to 100% once the price breaks above the wedge resistance.
This falling wedge pattern is typically seen at the end of downtrends or corrective phases, and it represents a potential shift in market sentiment from bearish to bullish. Traders closely watching ACEUSDT are noting the strengthening momentum as it nears a breakout zone. The good trading volume adds confidence to this pattern, showing that market participants are positioning early in anticipation of a reversal.
Investors’ growing interest in ACEUSDT reflects rising confidence in the project’s long-term fundamentals and current technical strength. If the breakout confirms with sustained volume, this could mark the start of a fresh bullish leg. Traders might find this a valuable setup for medium-term gains, especially as the wedge pattern completes and buying momentum accelerates.
✅ Show your support by hitting the like button and
✅ Leaving a comment below! (What is your opinion about this Coin?)
Your feedback and engagement keep me inspired to share more insightful market analysis with you!
ACE/USDT — Accumulation Zone! Bulls for a Major Reversal?ACE is currently trading above its key demand zone between 0.416 and 0.479 USDT — an area that has consistently absorbed selling pressure throughout 2025.
Each touch of this yellow zone has produced a strong rebound and long lower wicks, signaling aggressive accumulation by buyers or larger market participants.
After a prolonged downtrend from the 3.9 USDT level, price has entered a sideways structure, forming a potential accumulation base — a typical setup that often precedes a major trend reversal.
---
Pattern & Structure Overview:
Primary Trend: Long-term bearish.
Current Phase: Accumulation/sideways range.
Key Demand Zone: 0.416–0.479 USDT (yellow box).
Nearest Resistance Levels: 0.654 → 0.783 → 1.051 → 1.915.
Volume Behavior: Low at the base, with spikes on rallies — hinting at smart money accumulation.
---
Bullish Scenario:
If ACE can hold above the yellow zone and confirm a 2D close above 0.654 USDT with a noticeable volume surge, this could spark a strong reversal rally toward 0.783 → 1.051 → 1.915.
A breakout above these levels would mark a structural shift from distribution to accumulation — the early stage of a bullish trend.
🎯 Bullish Targets:
T1 → 0.654
T2 → 0.783
T3 → 1.051
T4 (extension target) → 1.915
📈 Bullish Narrative:
This accumulation phase could be the calm before the storm — if demand continues to build, ACE may deliver a sharp upside move that catches the market off guard.
---
Bearish Scenario:
If the price breaks down below 0.416 with a clean 2D close and strong selling volume, it would confirm a continuation of the bearish trend.
In that case, ACE may extend its decline toward the psychological zone below 0.38 USDT or even lower, depending on market sentiment.
📉 Bearish Narrative:
Losing this critical demand zone would expose the market to another leg down — turning the current range into a failed accumulation and confirming further weakness.
---
Strategic Takeaway:
ACE is now at a critical inflection point — where accumulation could transform into a new bullish phase, or failure could resume the macro downtrend.
This 0.416–0.479 zone is the battlefield between bulls and bears, and the next decisive 2D candle close will likely define the trend for the weeks ahead.
Smart traders will wait for clear confirmation before committing.
A strong rejection means a potential reversal.
A confirmed breakdown means continuation of the trend.
#ACEUSDT #CryptoAnalysis #TechnicalAnalysis #PriceAction #AccumulationZone #TrendReversal #CryptoTrading #Altcoins #SwingTrade #SupportAndResistance #CryptoMarket
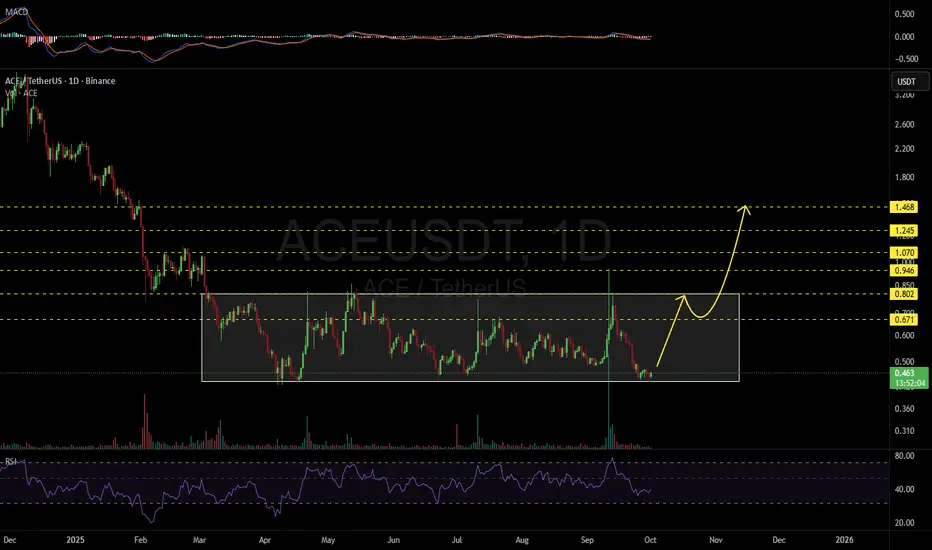
ACEUSDT 1D#ACE is moving inside a rectangle on the daily chart. We can be bullish only if it can hold the price above the rectangle support line. The potential targets are:
🎯 $0.671
🎯 $0.802
🎯 $0.946
🎯 $1.070
🎯 $1.245
🎯 $1.468
⚠️ Always remember to use a tight stop-loss and follow proper risk management.
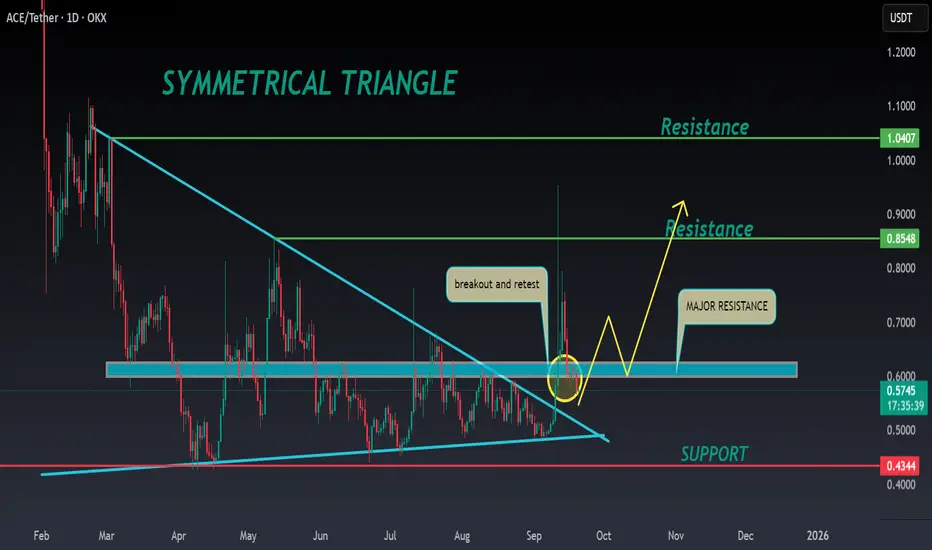
ACE ANALYSIS🔮#ACE Analysis 💰💰
#ACE is trading in a symmetrical triangle in a weekly time frame and breakouts with high volume and we could see a bullish momentum in #ACE. Before that we will see little bit retest and then bullish movement
🔖 Current Price: $0.5745
⏳ Target Price: $0.8548
⁉️ What to do?
- We can trade according to the chart and make some profits in #ACE. Keep your eyes on the chart, observe trading volume and stay accustom to market moves.💲💲
#ACE #Cryptocurrency #Pump #DYOR
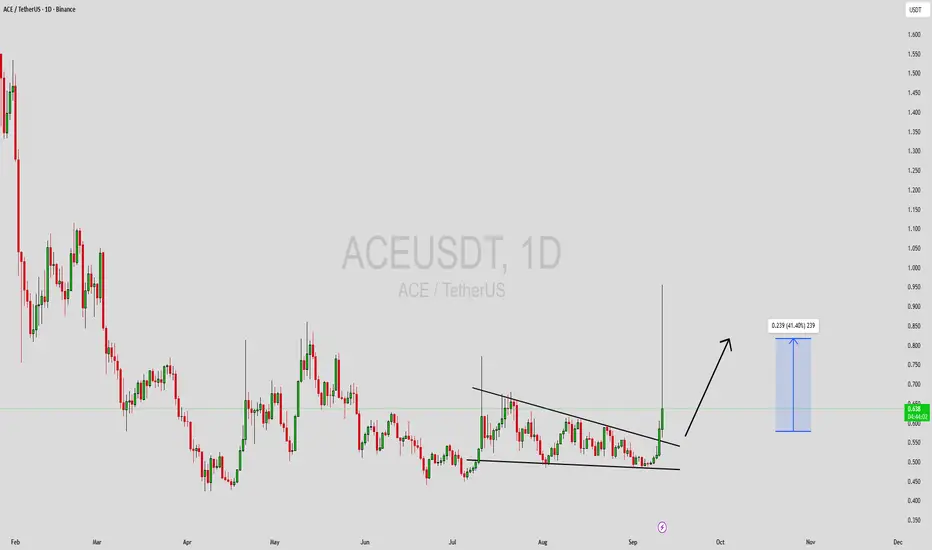
ACEUSDT Forming Falling WedgeACEUSDT is currently trading within a falling wedge pattern, a bullish technical setup that often precedes a reversal to the upside. This pattern forms as the price consolidates with lower highs and lower lows, but with diminishing bearish pressure. The narrowing price action signals that sellers are losing control while buyers are preparing to step in strongly. With good trading volume supporting the move, ACEUSDT is showing early signs of strength that could soon trigger a breakout.
The expected gain projection of 30% to 40%+ fits well with the wedge breakout scenario. Historically, falling wedge patterns combined with healthy volume often lead to significant price surges once resistance levels are breached. For ACEUSDT, a confirmed breakout could open the door to higher price zones, offering traders an opportunity to capitalize on short- to mid-term momentum.
Investor interest in this project is steadily growing, further adding confidence to the bullish outlook. Market sentiment and liquidity both indicate that ACEUSDT is gaining attention from both retail and institutional participants. This combination of technical and fundamental strength makes the pair an appealing setup for traders closely watching the crypto markets.
✅ Show your support by hitting the like button and
✅ Leaving a comment below! (What is You opinion about this Coin)
Your feedback and engagement keep me inspired to share more insightful market analysis with you!
ACEUSDT Forming Falling WedgeACEUSDT is currently trading within a falling wedge pattern, a bullish technical setup that often precedes a reversal to the upside. This pattern forms as the price consolidates with lower highs and lower lows, but with diminishing bearish pressure. The narrowing price action signals that sellers are losing control while buyers are preparing to step in strongly. With good trading volume supporting the move, ACEUSDT is showing early signs of strength that could soon trigger a breakout.
The expected gain projection of 30% to 40%+ fits well with the wedge breakout scenario. Historically, falling wedge patterns combined with healthy volume often lead to significant price surges once resistance levels are breached. For ACEUSDT, a confirmed breakout could open the door to higher price zones, offering traders an opportunity to capitalize on short- to mid-term momentum.
Investor interest in this project is steadily growing, further adding confidence to the bullish outlook. Market sentiment and liquidity both indicate that ACEUSDT is gaining attention from both retail and institutional participants. This combination of technical and fundamental strength makes the pair an appealing setup for traders closely watching the crypto markets.
✅ Show your support by hitting the like button and
✅ Leaving a comment below! (What is You opinion about this Coin)
Your feedback and engagement keep me inspired to share more insightful market analysis with you!
ACE/USDT – Between Critical Support and Potential Rebound🔎 Overview
ACE/USDT is currently sitting at a make-or-break zone. After a prolonged decline from the $3.9 peak, the price has been consolidating for months inside the demand zone $0.425–$0.496.
This area has been tested multiple times since April 2025, making it a key historical support. The mid-term structure still shows lower highs (bearish), but the sideways action could evolve into either an accumulation base (bullish setup) or a distribution phase before a deeper breakdown.
---
📍 Key Levels
Critical Support Zone: $0.425 – $0.496 (yellow box)
Nearest Resistance: $0.654
Next Resistances: $0.783 – $1.051
Mid-term Targets: $1.915 – $2.267 – $2.641
Macro Resistance: $3.507 – $3.900
---
📈 Bullish Scenario
1. Trigger: Price holds above $0.425 and breaks out with a confirmed 2D close above $0.654.
2. Confirmation: Successful retest of $0.654 as new support + strong buying volume.
3. Upside Targets:
$0.654 (initial)
$0.783 (next)
$1.051 (conservative mid-term)
If momentum expands, recovery towards $1.9+ is on the table.
✨ Bullish Narrative: "The $0.425–$0.496 zone could act as an accumulation base where smart money positions quietly. A confirmed breakout could trigger a meaningful trend reversal."
---
📉 Bearish Scenario
1. Trigger: A 2D close below $0.425.
2. Immediate Impact: Breakdown of long-held demand → fast drop towards $0.30 (psychological zone).
3. Extended Risk: Continued selling pressure could drag price further into $0.20–$0.15 levels.
⚠️ Bearish Narrative: "If this multi-month support fails, confidence in the base collapses. A breakdown could extend the bearish cycle and push ACE much lower."
---
📊 Structure & Pattern
Sideways Base: Range-bound between $0.425–$0.65 → market indecision.
Multi-bottom retests: Repeated touches at $0.425–$0.496 strengthen the zone’s importance.
Lower highs: Bearish structure intact until higher highs are formed above $0.654–$0.783.
Reversal Confirmation: Only validated if price breaks out and sustains above key resistance with strong volume.
---
🎯 Conclusion
ACE is at a critical decision point:
Holding this zone → opens room for a rebound towards $0.65–$0.78.
Breaking below $0.425 → exposes downside risk towards $0.30 and potentially lower.
For traders, this area offers a favorable risk/reward setup if managed with strict stop losses and confirmed breakouts.
---
#ACE #ACEUSDT #Crypto #Altcoin #TechnicalAnalysis #SupportResistance #PriceAction #SwingTrade #RiskManagement
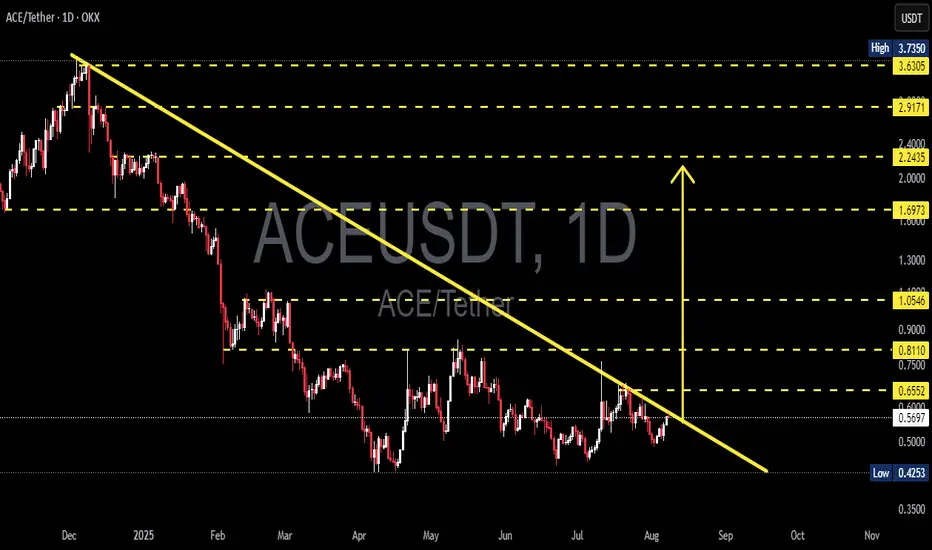
ACE/USDT Testing Long-Term Downtrend – Will It Break Out?Chart Overview:
The ACE/USDT pair on the 1D (Daily) timeframe is currently in a prolonged downtrend that has persisted since early 2025. The price has consistently formed lower highs, and it's been contained under a well-respected descending trendline (yellow line).
Currently, ACE is approaching a key decision point near the trendline resistance zone ($0.57–$0.60). What happens at this level will likely determine the next major move.
---
🟢 Bullish Scenario: Breakout Ahead?
If the price successfully breaks above the descending trendline and confirms with a daily close above $0.6552, we could see a trend reversal from bearish to bullish. Key resistance levels to watch for potential upside targets are:
1. $0.8110 – psychological and structural resistance
2. $1.0546 – strong previous resistance
3. $1.6973 – mid-term bullish target
4. $2.2435 and $2.9171 – extended bullish targets if momentum continues
Confirmation should be supported by increasing volume and RSI breaking above 50.
---
🔴 Bearish Scenario: Another Rejection?
If the price fails to break the trendline and gets rejected, ACE/USDT may resume its downward trajectory and test the following support levels:
1. $0.5691 – immediate support
2. $0.5000 – psychological support
3. $0.4253 – historical low and potential demand zone
This scenario would reaffirm continued bearish dominance and prolong the current downtrend.
---
📊 Pattern Analysis: Descending Trendline
The dominant pattern here is a descending resistance trendline, showing clear selling pressure and bearish market structure.
A breakout would signal the first major higher high in months – a potential trend reversal signal.
---
🎯 Conclusion & Strategy:
ACE is at a crucial inflection point.
Traders should wait for confirmation before entering a breakout trade.
If a breakout occurs, consider a buy-the-breakout strategy with a stop-loss below the trendline.
If rejected, a short/rejection play toward lower support zones could be viable.
#ACEUSDT #CryptoAnalysis #Altcoins #TechnicalAnalysis #BreakoutTrade #BearishScenario #BullishScenario #DescendingTrendline