ACH: Supply Exhaustion at Key Resistance BarrierACH: Supply Exhaustion at Key Resistance Barrier โ Strategic Long Setup on Accumulation Retest
ACH is displaying highly encouraging signs of momentum building following two successive attempts to resolve its rectangular accumulation structure to the upside. During the first breakout attempt, heavy profit-taking triggered a long upper wick suppressing prices back beneath the dynamic MA100 baseline and into the range. However, on the second breakout attempt, despite encountering mild resistance at the $0.0050 psychological round number, the subsequent pullback proved remarkably shallow, indicating that overhead supply has been largely absorbed.
Based on the visual data from the 4-hour chart , the clear exhaustion of selling pressure around $0.0050 sets the stage for an expansive bullish continuation. Within the current price framework, this shallow dip functions as a routine technical retest against the upper boundary of the rectangle to sweep for liquidity. Reclaiming $0.0050 decisively will unlock vast upside potential, as the price territory above remains completely clear of significant overhead barriers.
Consequently, the optimal strategy right now is to exercise patience and await the price action to execute a clean retest against the newly converted support floor. Activating a Long position upon this support confirmation provides an exceptional risk-to-reward edge, allowing for an exceptionally tight stop-loss placement while targeting expanded upside objectives.
Disclaimer: This is not financial advice, DYOR.
In-depth trading ideas
๏ปฟACHUSDT โ Long off Demand [Quantum Algo]ACH sold off into a 0.00422 base, then recovered and has been rotating in a 0.00430โ0.00457 balance. Price pushed toward the upper half, pulled back into a demand shelf around 0.004397, and held โ firing the Buy. This is a rotation long: buy the reaction in the lower-middle of the balance, target the range highs where the last supply sits.
Why this setup works โ three confluences:
Demand rejection on the retrace. Price pulled back into the demand zone and held rather than sliding back toward the base. That's where buyers step in โ the Buy printed on the reaction, giving a defined floor to lean risk against instead of chasing the push.
Higher lows since the base. Since the 0.00422 low, each pullback has been bought at a progressively higher level. Buying this dip sits with the recovery structure rather than fighting it.
Open room to the range highs. Above entry the chart is clean up toward the 0.004566 zone, the last supply and the logical draw. Defined risk below demand, asymmetric room up to structure.
Trade management:
Entry: 0.004397 (rejection off demand)
SL: 0.004295 (below the demand shelf)
TP1: 0.004490 โ take 50% off, move stop to breakeven
TP2: 0.004566 โ 100% exit at the range highs
R:R: ~1.66:1 to full target
Invalidation:
A 2h close back below 0.004295. That breaks the demand shelf and the higher-low sequence off the base โ sellers reclaim control, thesis dead, just out.
The lesson:
Every pullback into demand is a question the market asks: are the buyers still here? The answer isn't a prediction โ it's a reaction you wait to see. Let price come to the level, let it hold, then take the entry with risk parked below the shelf. If the answer comes back no, you're out for one clean R and nothing more. That's the whole job: ask at the right level, and make sure a wrong answer stays cheap.
Signal fired. We took it. Update coming.
Disclaimer: Not financial advice. This idea is shared for educational purposes only. Trading leveraged instruments carries substantial risk. Past performance is not indicative of future results. Always do your own research and manage your own risk.
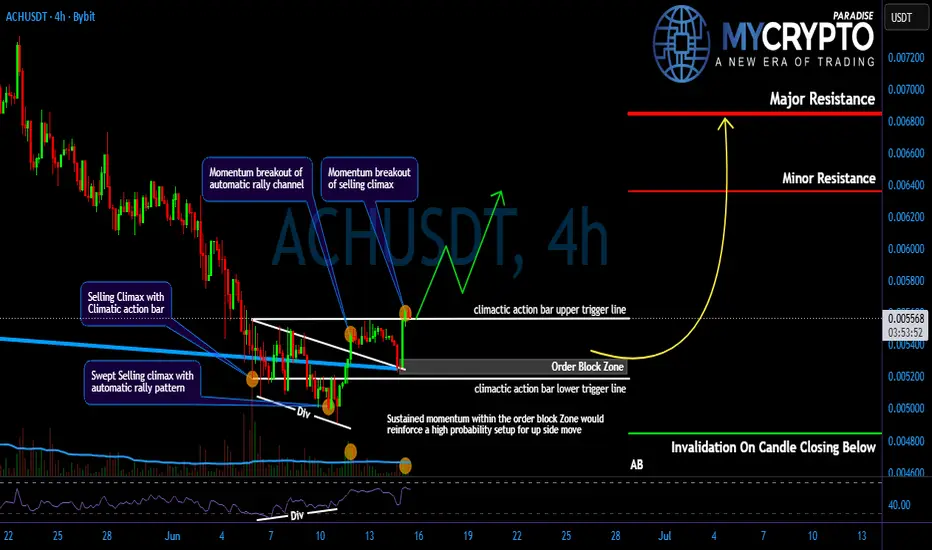
ACHโs Trap Is Loading โ Is the Real Move Next?Yello Paradisers! Are you prepared for a potential sharp move on #ACH, or are you still underestimating whatโs quietly building behind the scenes? At first glance, this structure might seem like a simple and healthy pullback. But when we strip away emotions and analyse the chart objectively, a completely different narrative emerges. This is not random price action โ this is a high-risk, high-opportunity zone where discipline matters far more than opinions.
๐#ACH has recently printed a classic Selling Climax, followed by a Climactic Action candle backed by ultra-high volume. This is a textbook probability that accumulation may be developing. Historically, this type of behaviour often appears when smart money starts positioning before a larger move. To inexperienced traders, it may look like noise. But for experienced traders, this kind of volume reaction carries serious weight.
๐#ACH swept the Selling Climax with an Automatic Rally structure and then aggressively breaking above the Automatic Rally trend-line with strong momentum. This is a key probability. It suggests weak hands are being forced out of the market while stronger participants continue accumulating positions with confidence.
๐#ACH breaks above the upper trigger line of selling climax with a strong momentum candle adding more confluence for the bullish probability. If the prices sustain this momentum, the next upside path can open toward 6845, which is currently acting as a major structural resistance level.
๐On top of that, #ACH has broken above the descending resistance trend-line and retested it, showing that momentum is gradually shifting toward the bullish side. We can also see a clear RSI divergence, which adds further confirmation to the bullish probability. As long as price continues holding momentum inside the order block zone, the structure remains constructive, with 6360 acting as the first key resistance level to monitor closely.
๐If #ACH fails to hold bullish momentum and a momentum candle closes below 4845, the current bullish probability becomes invalid. In that case, we could see further downside pressure.
That is why Paradisers, we are playing it safe right now. If you want to be consistently profitable, you need to be extremely patient and always wait only for the best, highest probability trading opportunities only on confirmations.
MyCryptoParadise
iFeel the success๐ด
ACH/USDT 2D โ Major Breakout or Fakeout?The chart of Alchemy Pay on the 2D timeframe is showing a very interesting technical structure after spending months moving below a major descending trendline resistance.
At the moment, price action is attempting to break out from the long-term bearish trendline that has acted as strong resistance since mid-2025. ๐
---
๐ Chart Structure Analysis
๐ก Main Pattern: Descending Resistance Breakout Attempt
For several months, the price has continued forming lower highs, creating a clear descending resistance trendline shown in yellow on the chart.
This pattern indicates:
Sellers have been dominating the market ๐
However, bearish momentum is starting to weaken
Buyers are beginning to recover from the bottom area around 0.0056
Now the price is pushing back toward the descending resistance, which has become a critical zone that could determine the next major direction.
---
๐ข Bullish Scenario
If the price manages to:
Break out and close strongly above the descending trendline
Hold above the 0.0087 โ 0.0094 area
Be supported by increasing buying volume ๐
Then a bullish continuation could potentially occur toward the next resistance targets:
๐ฏ Bullish Targets:
0.0094
0.0103
0.0124
0.0148
The 0.0103 area is an important psychological resistance because it previously acted as a major supply zone. If this level is broken, the probability of a larger recovery move increases significantly.
๐ก Technically, a breakout from a long-term downtrend often becomes the early phase of a medium-to-long-term trend reversal.
---
๐ด Bearish Scenario
However, if the price fails to break out and gets rejected again at the descending resistance trendline, the market could continue its bearish structure.
โ ๏ธ Bearish signals:
Strong rejection from the trendline resistance
Candle closes back below 0.0087
Weakening volume during resistance retest
If that happens, the next downside targets could be:
0.0072
0.0064
0.0056 support low
If the 0.0056 support breaks, the medium-term bearish structure would remain valid and the market could enter a deeper distribution phase.
---
๐ Conclusion
ACH is currently trading in a highly important area as it tests the medium-term descending resistance. A confirmed breakout could become the early signal of a bullish trend reversal. However, as long as there is no strong close above the key resistance, the market still carries the risk of a fakeout and rejection.
Traders should closely monitor: โ
Breakout volume
โ
Higher timeframe candle closes
โ
Resistance turning into support during retest
Because this zone could become the starting point of the next major market move. ๐
---
#ACH #ACHUSDT #AlchemyPay #Crypto #CryptoTrading #TechnicalAnalysis #TradingView #Altcoin #Bullish #Bearish #Breakout #CryptoMarket #Binance #PriceAction #SupportResistance #Altseason #TrendlineBreakout #TradingCrypto #ChartAnalysis #CryptoSignals
ACH ยท Bearish continuation (-10%) vs bullish breakout (+300%)Here I have a great example of the argument that I've been making in support of a bullish altcoins market. I know you will agree with me or at least you will be able to understand my point of view even if you disagree.
I realized that many people leaving strange comments don't actually read. Whenever I read an article I find myself agreeing with the author. Not because I am easy to convince but because most people have a sound argument. I can disagree but after reading I know what the author is all about so any discussion can start from a sound base.
Alchemy PayโACHUSDT
The main low happened 6-February. Before this low a 'weak' bullish jump was 78% in size.
After 6-Feb, ACHUSDT continued to move lowerโa bearish continuation. A new bearish impulse? A major down-move? A lower low? No, not much.
After 65 days of bearish action, guess how much ACH went down? Yep! you guessed it, only 8.26%. That is, ACHUSDT went down by 8% in more than two months. This is nothing more than a stop-loss hunt, a weak one.
Now, consider the other scenario. An altcoin breaks bullish from similar levels; multiple years low, atl, etc. And what happens? Growth starts with +100% in one day. It can reach even higher followed by a strong continuation. I've seen this and you've seen this hundreds of times already, I've been showing you the charts.
No breakdown, a weak continuation at best. Most trading pairs are producing higher lows, double-bottoms or simply more consolidation until the bullish breakout happens. So there isn't any new bearish force, no new bearish participants, not a new bearish impulse; just the market moving on autopilot until we experience change.
When the market breaks bullish, we get 100, 200 or even 300% growth in the first 2-3 weeks. When the market stays bearish, we get minus 5, 10 or 15% maybe in 1-2 months.
This means that the bearish cycle is over, we are looking at the accumulation phase. The best possible time to buy as everything is trading at bargain prices (with the exception of all those pairs that moved first).
Those moving first simply reveals what is coming to the rest of the market, a bull market. Not just a strong bullish move but sustained long-term growth. You saw it going down for years, you will see it grow for years to come... Just watch!
I love you. Thanks a lot for your continued support.
Namaste.
ACH ยท Bearish continuation (-10%) vs bullish breakout (+200%)Here I have a great example of the argument that I've been making in support of a bullish altcoins market. I know you will agree with me or at least you will be able to understand my point of view even if you disagree.
I realized that many people leaving strange comments don't actually read. Whenever I read an article I find myself agreeing with the author. Not because I am easy to convince but because most people have a sound argument. I can disagree but after reading I know what the author is all about so any discussion can start from a sound base.
Alchemy PayโACHUSDT
The main low happened 6-February. Before this low a 'weak' bullish jump was 78% in size.
After 6-Feb, ACHUSDT continued to move lowerโa bearish continuation. A new bearish impulse? A major down-move? A lower low? No, not much.
After 65 days of bearish action, guess how much ACH went down? Yep! you guessed it, only 8.26%. That is, ACHUSDT went down by 8% in more than two months. This is nothing more than a stop-loss hunt, a weak one.
Now, consider the other scenario. An altcoin breaks bullish from similar levels; multiple years low, atl, etc. And what happens? Growth starts with +100% in one day. It can reach even higher followed by a strong continuation. I've seen this and you've seen this hundreds of times already, I've been showing you the charts.
No breakdown, a weak continuation at best. Most trading pairs are producing higher lows, double-bottoms or simply more consolidation until the bullish breakout happens. So there isn't any new bearish force, no new bearish participants, not a new bearish impulse; just the market moving on autopilot until we experience change.
When the market breaks bullish, we get 100, 200 or even 300% growth in the first 2-3 weeks. When the market stays bearish, we get minus 5, 10 or 15% maybe in 1-2 months.
This means that the bearish cycle is over, we are looking at the accumulation phase. The best possible time to buy as everything is trading at bargain prices (with the exception of all those pairs that moved first).
Those moving first simply reveals what is coming to the rest of the market, a bull market. Not just a strong bullish move but sustained long-term growth. You saw it going down for years, you will see it grow for years to come... Just watch!
I love you. Thanks a lot for your continued support.
Namaste.
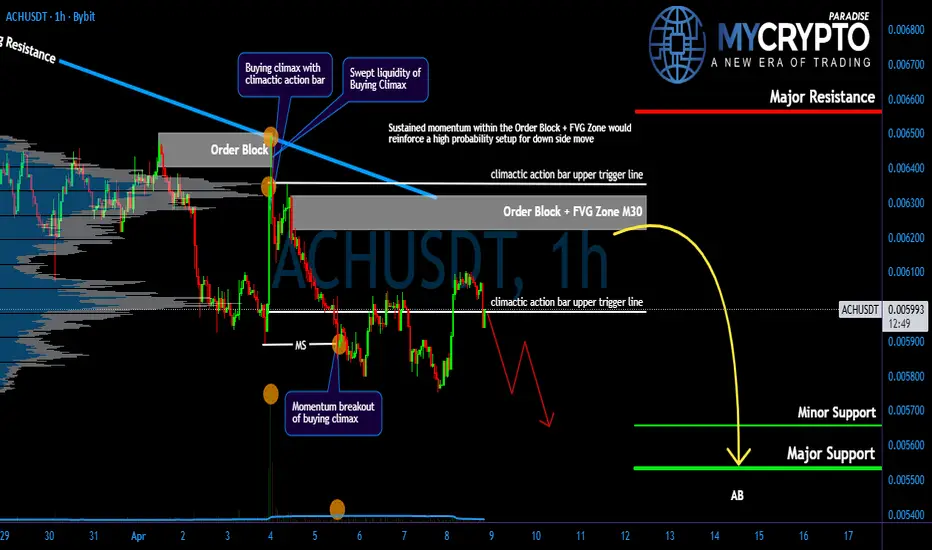
ACH Distribution Trap โ Is a Drop Coming?Yello Paradisers! Are you prepared for a potential sharp downside move on #ACH, or are you still calling this โjust a healthy pullbackโ while smart money quietly distributes above you? At first glance, the structure may look harmless. But when we remove emotions and read the chart objectively, the story changes completely. This is not a random retracement. This is a high-risk zone where discipline matters more than opinions.
๐#ACH has clearly respected the descending resistance trend-line and failed to break above it. This rejection is a key probability of ongoing structural weakness. At the same time, Overall structure is bearish and momentum has shifted to the downside, adding further confluence to the bearish case. As long as price remains within the 30M order block and fair value gap zone, the probability favours continuation lower. The immediate minor support align with Fib level 1.272 sits around 5656, which now acts as the first downside magnet if selling pressure persists.
๐From Volume Spread Analysis perspective, the sequence is even more revealing. We saw a buying climax followed by a climactic action bar. This combination typically shows distribution. In simple terms, institutions use these aggressive spikes to offload positions into retail enthusiasm. When the crowd feels confident, smart money distributes quietly.
๐#ACH swept the upper trigger line of the buying climax but failed to sustain higher levels, followed by a strong momentum candle breaking below the lower trigger line. This is a classic confirmation that supply is dominating. If bearish momentum continues, the next probability of major downside target align with Fib Level 1.618 sits around 5533, and it could be reached sooner than most expect.
๐If #ACH manages to break above the key resistance at 6563 with a strong momentum candle, this whole bearish probability would be invalidated, and we could instead see a bullish continuation. As always, we let price confirm our bias.
Discipline is key, Paradisers! The charts may look volatile, but this is where professionals thrive and amateurs panic. Donโt let emotions guide your trades. Wait for clear confirmation and manage risk like a pro. Strive for consistency, not quick profits. Treat the market as a businessman, not as a gambler.
MyCryptoParadise
iFeel the success๐ด
ACH Is About to Collapse? Smart Money Is Dumping!Yello Paradisers! Are you seeing what smart money is doing on #ACH right now, or are you about to become liquidity for the next leg down? This current move might look harmless to inexperienced tradersโฆ but the structure is telling a completely different story. And if you understand what the chart is really showing, you know this is not the place to get emotional.
๐#ACH formed a buying climax followed by climactic action bar, strongly suggesting that institutional players are offloading and preparing for more downside move according to volume spread analysis (VSA).
๐#ACH breaks the lower trigger line of buying climax for the second time, which confirmed the weakness, if momentum holds, the next major target sits around 626 that could be tested soon.
๐#ACH respected the descending resistance and failed to break above it, which confirms ongoing weakness. #ACH momentum has now clearly shifted to the downside, as long momentum sustained within the supply zone, we can expect a further move down toward the minor support level of 707.
๐If #ACH manages to break above the key resistance at 822 with a strong momentum candle, this whole bearish probability would be invalidated, and we could instead see a bullish continuation. As always, we let price confirm our bias.
Discipline is key, Paradisers! The charts may look volatile, but this is where professionals thrive and amateurs panic. Donโt let emotions guide your trades. Wait for clear confirmation and manage risk like a pro. Strive for consistency, not quick profits. Treat the market as a businessman, not as a gambler.
MyCryptoParadise
iFeel the success๐ด
ACH will experience a strong pump soon (8H)The price has formed a bottom at a 3D pattern. This pattern indicates the liquidation of sellers, after which the price typically rebounds upward.
Our confirmation comes from the break of the trigger line. For some time, the price was unable to break this trigger line, but now it is trading above it, which clearly shows that buyers are strong.
Additionally, we have a bullish CH (Change of Character) on the chart, further confirming that strong buyers have appeared.
The current structure supports buy/long positions, which is why we are focusing on looking for long entries.
There are two entry points, which should be taken using a DCA (Dollar-Cost Averaging) strategy to manage risk and optimize the position.
Targets are marked on the chart. At the first target, consider taking partial profits, and then move your stop-loss to the entry point to protect your capital while keeping the remaining position active for potential further upside.
In summary:
Pattern: 3D bottom indicating seller liquidation
Confirmation: Price breaking above the trigger line
Bullish signal: CH on the chart
Strategy: Buy/long positions with DCA entries
Risk management: Partial profit at first target, stop-loss at entry
This setup highlights a strong bullish structure, giving traders a clear framework to participate while managing risk efficiently.
If you would like us to analyze a coin or altcoin for you, first like this post, then comment the name of your altcoin below.
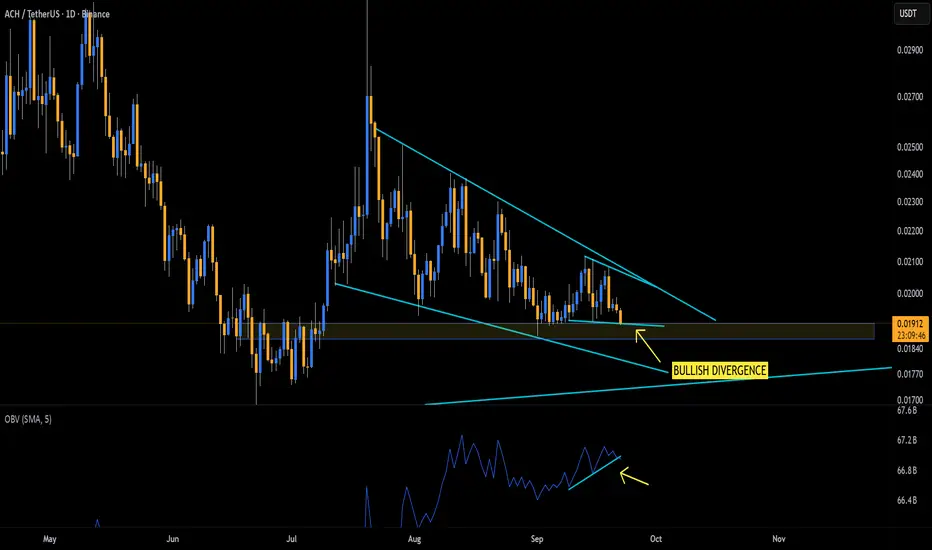
ACH/USDT โ Multi-Year Support Zone, Bounce or Breakdown?๐ Overview
ACH/USDT is currently consolidating within a multi-year demand zone around ~0.01811 (highlighted in yellow). This level has acted as a strong support multiple times, producing significant reactions whenever price touched it.
However, each bounce from this area has been weaker than the last, forming lower highs โ a clear sign of persistent selling pressure. Structurally, this resembles a descending triangle, where sellers are consistently pushing from above while buyers defend the same support zone.
This puts ACH at a critical crossroads:
Will buyers defend the support again and trigger a strong rebound?
Or will sellers finally break it down, opening the path toward new lows?
---
๐ Key Technical Levels
Main demand zone (support): 0.01811
Next supports if breakdown: 0.01400 โ 0.00950 โ historical low 0.00720
Major resistances (bullish targets):
0.02263
0.02867
0.03441
0.04075
0.04500
0.05059
---
๐ Bullish Scenario
Trigger: Weekly close above 0.02263 or a confirmed breakout from the lower-high structure.
Implication: Buyers successfully defend the multi-year demand zone and regain short-term control.
Targets: 0.02867 โ 0.03441 โ 0.04075 โ 0.05059
Note: A sustainable breakout will require strong buying volume; otherwise, it risks being another failed rally.
---
๐ Bearish Scenario
Trigger: Weekly close below the 0.01811 demand zone.
Implication: Descending triangle confirms to the downside, signaling potential mid-term breakdown.
Targets: 0.01400 โ 0.00950 โ possibly retesting the historical low at 0.00720.
Note: A breakdown here could trigger capitulation, since this zone has long been a critical stronghold for buyers.
---
๐ Pattern & Sentiment
Dominant pattern: Descending Triangle (neutral-to-bearish bias).
Short-term sentiment: Neutral, awaiting reaction at the demand zone.
Mid-term sentiment: Bearish leaning, as repeated tests of support increase breakdown risk.
Catalysts: A broader crypto market recovery (BTC/ETH rally) could fuel upside, while weak market conditions may accelerate a breakdown.
---
๐ Conclusion
ACH/USDT is standing at a make-or-break zone. The multi-year support around 0.01811 is the last stronghold for buyers. A solid bounce could spark rallies toward 0.02867 and higher, but if the support breaks, a deep correction toward the historical lows near 0.00720 becomes likely.
Strategy:
Bullish traders: Wait for confirmed weekly breakout & retest.
Bearish traders: Watch for a confirmed weekly breakdown below 0.01811.
Neutral traders: Stay patient, as this zone may define ACHโs direction for the coming months.
---
#ACHUSDT #ACH #AlchemyPay #Crypto #Altcoin #ChartAnalysis #TechnicalAnalysis #SupportResistance #DescendingTriangle #BreakoutOrBreakdown
$ACH LAST OPPORTUNITY TO BUY AT THIS PRICE!FWB:ACH Is consolidating before pumping up to $0.05 like it did the last 2 times. zoom out on my chart and you will see.
Only this time, with the altcoins gearing up for a bull run and main net for FWB:ACH scheduled for Q2 2026, We are going to faintly break out of the MULTI YEAR CHANNEL!
EASILY HEADED TO $0.20+
ACCUMULATE AS MUCH AS YOU CAN WHILE YOU HAVE TIME!!!!!
Title: Buy Trade Strategy for ACH: Powering the Future of CryptoDescription:
This trading idea highlights ACH, the native token of the Alchemy Pay ecosystem, a project focused on bridging the gap between fiat and crypto through seamless payment solutions. ACH enables fast, low-cost transactions and supports real-world utility by integrating with global merchants and payment gateways. With partnerships spanning major platforms and growing adoption in Asia and beyond, Alchemy Pay positions itself as a key player in driving cryptocurrency adoption for everyday use. The projectโs mission to enable crypto-to-fiat conversions for businesses and consumers gives ACH strong utility and growth potential.
Still, the crypto market remains highly volatile, and the value of ACH can be influenced by global economic trends, competition, regulatory frameworks, and evolving market sentiment. Like all digital assets, ACH carries risks that must be carefully considered.
Disclaimer:
This trading idea is for educational purposes only and should not be considered financial advice. Investing in cryptocurrencies such as ACH involves significant risk, including the potential for total capital loss. Always perform your own research, assess your financial situation, and consult a licensed financial advisor before making investment decisions. Past performance is not indicative of future results.
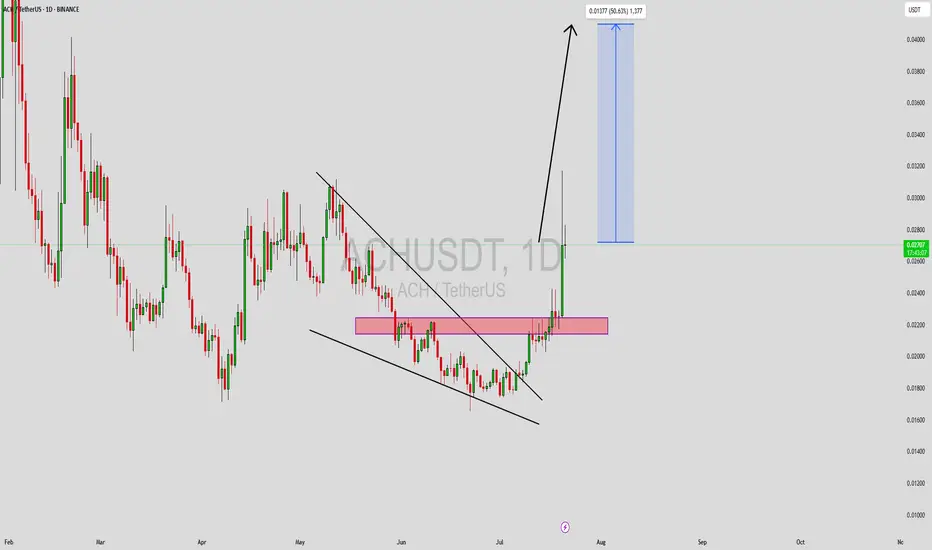
ACHUSDT Forming Descending ChannelACHUSDT is currently displaying a promising descending channel pattern, which is a classic technical setup often seen before a bullish reversal. The price has consistently respected the upper and lower bounds of the channel, and recent price action indicates a potential breakout. With good volume support, this setup gains even more credibility, suggesting growing interest and confidence among market participants. As of now, traders are eyeing a potential 40% to 50% upside move as the price attempts to escape the downtrend and head toward key resistance levels.
Alchemy Pay (ACH) continues to gain traction due to its role in connecting traditional finance systems with the crypto economy. As the project expands partnerships and improves its payment infrastructure, the coin is becoming more attractive to both retail and institutional investors. This growing interest is reflected in its trading volume, which aligns with the current bullish chart pattern and builds the case for a strong short-term rally.
From a technical standpoint, the descending channel has compressed price action over several weeks, and this type of structure often precedes large price moves once a breakout occurs. Traders watching for confirmation may look for strong bullish candles above resistance with high volume. A breakout from this level could act as a springboard for a rapid upward price movement, especially in favorable market conditions.
โ
Show your support by hitting the like button and
โ
Leaving a comment below! (What is You opinion about this Coin)
Your feedback and engagement keep me inspired to share more insightful market analysis with you!
ACH/USDT at a Historical Pivot Zone โ Is a Major Reversal๐ In-Depth Weekly Chart Analysis of ACH/USDT
ACH/USDT is currently retesting a critical historical demand zone between $0.01876 โ $0.02263, which has consistently acted as a major accumulation area since late 2022. This zone has served as the launchpad for multiple bullish moves in the past and is now being tested once again.
Interestingly, price action appears to be forming a long-term consolidation base, potentially a triple bottom pattern or a classic accumulation phase, which often precedes significant impulsive rallies.
โ
Bullish Scenario (High-Probability Reversal)
If price successfully:
1. Holds above $0.01876, and
2. Breaks above minor resistances at $0.02263 and $0.02867
Then a bullish reversal is likely, with price targeting the following resistance levels:
๐ธ $0.02867 โ structural resistance
๐ธ $0.03441 โ neckline zone of the accumulation pattern
๐ธ $0.04075 โ key psychological level
๐ธ $0.05059 โ full measured move target from the base pattern
Should momentum and market sentiment align, ACH could even test the $0.065โ$0.098 range, especially if volume supports a breakout continuation.
Key confirmation: A weekly close above $0.02867 with strong volume would signal a clear breakout from accumulation.
โ Bearish Scenario (Breakdown from Critical Support)
On the flip side, if price fails to hold:
A weekly breakdown and close below $0.01876 will invalidate the bullish structure.
This could lead to a decline toward:
$0.01400 โ minor support
$0.01000 โ $0.00720 โ historical bottom zone
This would likely reflect a capitulation phase, particularly if accompanied by negative macro sentiment across the broader crypto market.
๐ Technical Pattern Structure
๐ Triple Bottom + Long-Term Accumulation = Early Reversal Signal
๐ Multiple rejections off the support zone = Buyer defense still strong
๐ Increasing volume near lows = Signs of smart money accumulation
๐ Formation of higher lows in the coming weeks will reinforce bullish momentum
๐ฌ Market Psychology Insight
After prolonged sideways action, many retail traders tend to exit
This creates ideal conditions for smart money to accumulate quietly
A breakout from this zone could trigger mass FOMO, accelerating price action
๐ง Conclusion
ACH/USDT currently offers a highly attractive risk-to-reward setup, especially for swing traders and medium-term investors. The zone being tested is a make-or-break level that could dictate the next major trend. A confirmed breakout could mark the beginning of a powerful expansion phase.
#ACHUSDT #CryptoAnalysis #AltcoinReversal #BullishSetup #TechnicalAnalysis #TripleBottom #BreakoutTrade #SwingTradeOpportunity #CryptoOpportunities
#ACH/USDT#ACH
The price is moving within a descending channel on the 1-hour frame and is expected to break and continue upward.
We have a trend to stabilize above the 100 moving average once again.
We have a downtrend on the RSI indicator, which supports the upward move by breaking it upward.
We have a support area at the lower limit of the channel at 0.01800, acting as strong support from which the price can rebound.
Entry price: 0.01878
First target: 0.01925
Second target: 0.01970
Third target: 0.02025